the Creative Commons Attribution 4.0 License.
the Creative Commons Attribution 4.0 License.
 | 16 Mar 2018
Quantifying biostabilisation effects of biofilm-secreted and extracted extracellular polymeric substances (EPSs) on sandy substrate
Wietse I. van de Lageweg
Stuart J. McLelland
Daniel R. Parsons
Microbial assemblages (“biofilms”) preferentially develop at water–sediment interfaces and are known to have a considerable influence on sediment stability and erodibility. There is potential for significant impacts on sediment transport and morphodynamics, and hence on the longer-term evolution of coastal and fluvial environments. However, the biostabilisation effects remain poorly understood and quantified due to the inherent complexity of biofilms and the large spatial and temporal (i.e. seasonality) variations involved. Here, we use controlled laboratory tests to systematically quantify the effects of natural biofilm colonisation as well as extracted extracellular polymeric substances (EPSs) on sediment stability. Extracted EPSs may be useful to simulate biofilm-mediated biostabilisation and potentially provide a method of speeding up timescales of physical modelling experiments investigating biostabilisation effects. We find a mean biostabilisation effect due to natural biofilm colonisation and development of almost 4 times that of the uncolonised sand. The presented cumulative probability distribution of measured critical threshold for erosion of colonised sand reflects the large spatial and temporal variations generally seen in natural biostabilised environments. For identical sand, engineered sediment stability from the addition of extracted EPSs compares well across the measured range of the critical threshold for erosion and behaves in a linear and predictable fashion. Yet, the effectiveness of extracted EPSs to stabilise sediment is sensitive to the preparation procedure, time after application and environmental conditions such as salinity, pH and temperature. These findings are expected to improve biophysical experimental models in fluvial and coastal environments and provide much-needed quantification of biostabilisation to improve predictions of sediment dynamics in aquatic ecosystems.
- Article
(3376 KB) - Full-text XML
- BibTeX
- EndNote


Micro-organisms are a fundamental feature of aquatic environments providing a range of ecosystem services (Gerbersdorf et al., 2011; Gerbersdorf and Wieprecht, 2015). A large variety of microbial assemblages (“biofilms”) such as microphytobenthos, microbial mats and biofouling in pipes (Flemming and Wingender, 2010) are representations of microbial communities in aqueous environments. The microbes in biofilms live in a self-formed matrix of glue-like and hydrated extracellular polymeric substances (EPSs) such as polysaccharides (often 40–95 %), proteins (up to 60 %) and minor amounts of acids, lipids and biopolymers (Decho, 1990; Flemming, 2011; Gerbersdorf et al., 2011). The ecosystem functions of EPSs in sediment particle aggregation, increasing sediment stability, altering chemical properties to enable contaminant release or adsorption and providing a food source for invertebrates are well established for marine environments (Decho, 1990; Passow, 2002; Bhaskar and Bhosle, 2006; Paterson et al., 2008) but remain less well understood for freshwater systems (Gerbersdorf et al., 2011). The ability of biofilms to stabilise sediment and protect sedimentary surfaces against erosion is often referred to as “biostabilisation” (Paterson, 1989). Biostabilisation may result from coverage by microbial mats which protects underlying sediments from fluid forces (Noffke and Paterson, 2007) or from micro- to macroscopically thin biofilms that coat, bridge or permeate single grains and pore spaces with their EPSs (Gerbersdorf and Wieprecht, 2015) which increases sediment cohesion and increases the entrainment threshold. Note that the terms “microbial mats” and “biofilms” are often used interchangeably; the former is not exclusively used to denote a covering of underlying sediments, and the latter is not exclusively used to denote coatings of single grains.
Many studies have attempted to quantify biostabilisation in a variety of environments (Paterson, 1989; Dade et al., 1990; Amos et al., 1998; Tolhurst et al., 1999, 2003; Friend et al., 2003a; Droppo et al., 2007; Righetti and Lucarelli, 2007; Vignaga et al., 2012; Graba et al., 2013; Thom et al., 2015). These studies generally show a positive correlation between EPS content and sediment stability measured as the threshold for erosion, although variations in space and time (Friend et al., 2003b; Thom et al., 2015) and between cohesive and non-cohesive sandy environments are large. There are, however, also examples of buoyant biofilms, which reduce the threshold for erosion of sediments (Sutherland et al., 1998; Tolhurst et al., 2008). Biostabilisation of coarse sand and gravel may increase the threshold for erosion by up to almost 3 times compared to abiotic sediment (Vignaga et al., 2012) while a 10-fold increase in the threshold for erosion compared to abiotic sediment has been reported for fine sands and cohesive sediments (Paterson, 1997; Dade et al., 1990). EPSs are known to add biostability in two ways: (1) by physically binding both cohesive and non-cohesive sediment grains together (see Tolhurst et al., 2002) for low-temperature scanning electron microscopy images of biofilm-secreted EPS strands binding sediment particles together and (2) by molecular electrochemical interaction with cohesive clay particles (Chenu and Guérif, 1991).
Biofilm formation affects sediment erosion, transport, deposition and consolidation (Righetti and Lucarelli, 2007; Gerbersdorf and Wieprecht, 2015). There is, for example, evidence that diatom blooms alter sediment dynamics at the scale of entire estuaries (Kornman and De Deckere, 1998), illustrating the potential effects micro-organisms can have on system-wide sediment fluxes. At a smaller scale, evidence is growing that biofilms alter their local environment by affecting hydrodynamics (Vignaga et al., 2013), since the biofilm surface changes the bed roughness to either dampen or increase turbulence production (Gerbersdorf and Wieprecht, 2015), and sometimes their protruding structures create a buffer layer between the flow and the bed that can enhance sediment settling rates (e.g. Augspurger and Küsel, 2010).
The introduction of the extracted EPS xanthan gum in flume experiments investigating bedform dynamics has been shown to change bedform morphology and behaviour (Malarkey et al., 2015; Parsons et al., 2016). Changes in delta morphology and behaviour were also observed in flume experiments where extracted EPSs were added to the sediment mixture (Hoyal and Sheets, 2009; Kleinhans et al., 2014). Extracted EPSs are here defined as polysaccharides with a variety of uses (e.g. food additives) that can be extracted from simple sugars using a fermentation process. Extracted EPSs are generally available as a powder and are in this study employed to systematically introduce biological cohesion into physical models.
The corollary of the evidence showing the impact of biofilms on sediment stability and flow behaviour is that the inclusion of biological processes and responses is critical to modelling sediment dynamics because micro-organisms are an integral component of the functioning of water and sediment transfer systems. Predicting the potential impacts of climate change on aquatic environments and applying bioengineering adaptation strategies like “building with nature” for coastal defence (de Vriend et al., 2015) or flood resilience (Temmerman et al., 2013) requires an understanding of (i) the response of micro-organisms to changes in climate-induced hydrodynamic forcing and (ii) the role of micro-organisms in water and sediment transfer systems. To date, quantification of biostabilisation effects in space and time remains scarce however. A controlled physical model experiment is therefore employed to systematically investigate and provide further quantification of natural biostabilisation effects. Additionally, the extracted EPS xanthan gum has proven useful for modelling biological interactions with sediment dynamics (e.g. Hoyal and Sheets, 2009; Kleinhans et al., 2014; Malarkey et al., 2015; Parsons et al., 2016), even though it has been demonstrated that xanthan gum is not a perfect analogue for natural biofilms (Perkins et al., 2004). Extracted EPSs generally also have the potential advantages over growing natural biofilms that preparation time and experiment duration in physical models can be reduced and biostabilisation effects can be controlled. In assessing the potential of four extracted EPSs to mimic natural biostabilisation, the natural biofilm physical experiment is compared to the complementary experiments on extracted EPSs.
The objective of this study is therefore to evaluate biostabilisation effects of existing extracted EPSs for a range of conditions commonly used in physical modelling experiments. Two sets of experiments are being reported: the first set of experiments focuses on biostabilisation resulting from colonisation of sandy substrate by natural biofilms (“natural beds”). The second set of experiment focuses on biostabilisation resulting from the systematic addition of extracted EPSs to the same sandy substrate (“engineered beds”). In doing so, the study solely focuses on the sediment stabilising aspect of biofilms and does not explicitly intend to replicate and evaluate natural biofilm behaviour. The novel outcome of this study is the development of a robust methodology and protocol for the application and resultant impacts of extracted EPSs, which can be applied to future experimental studies that require the representation of biological cohesion in a rapid and controlled manner. A sandy substrate was used in this study because this grain size range is most commonly used in physical models of coastal and fluvial systems to date. The specific aims of this study are to
-
quantify biostabilisation effects (i.e. threshold for erosion) of natural diatom biofilm-secreted EPSs on sandy substrates in a physical model experiment (“natural beds”; first set of experiments);
-
quantify the biostabilisation effects of four extracted EPSs using the same sandy substrate (“engineered beds”; second set of experiments);
-
assess the sensitivity of the biostabilisation effects of the four extracted EPSs to
- a.
the preparation procedure,
- b.
the time after application and
- c.
environmental factors that may differ between flume facilities such as salinity, pH and temperature; and
- a.
-
summarise the key steps and findings into a protocol informing future work on usage and expected biostabilisation effects.
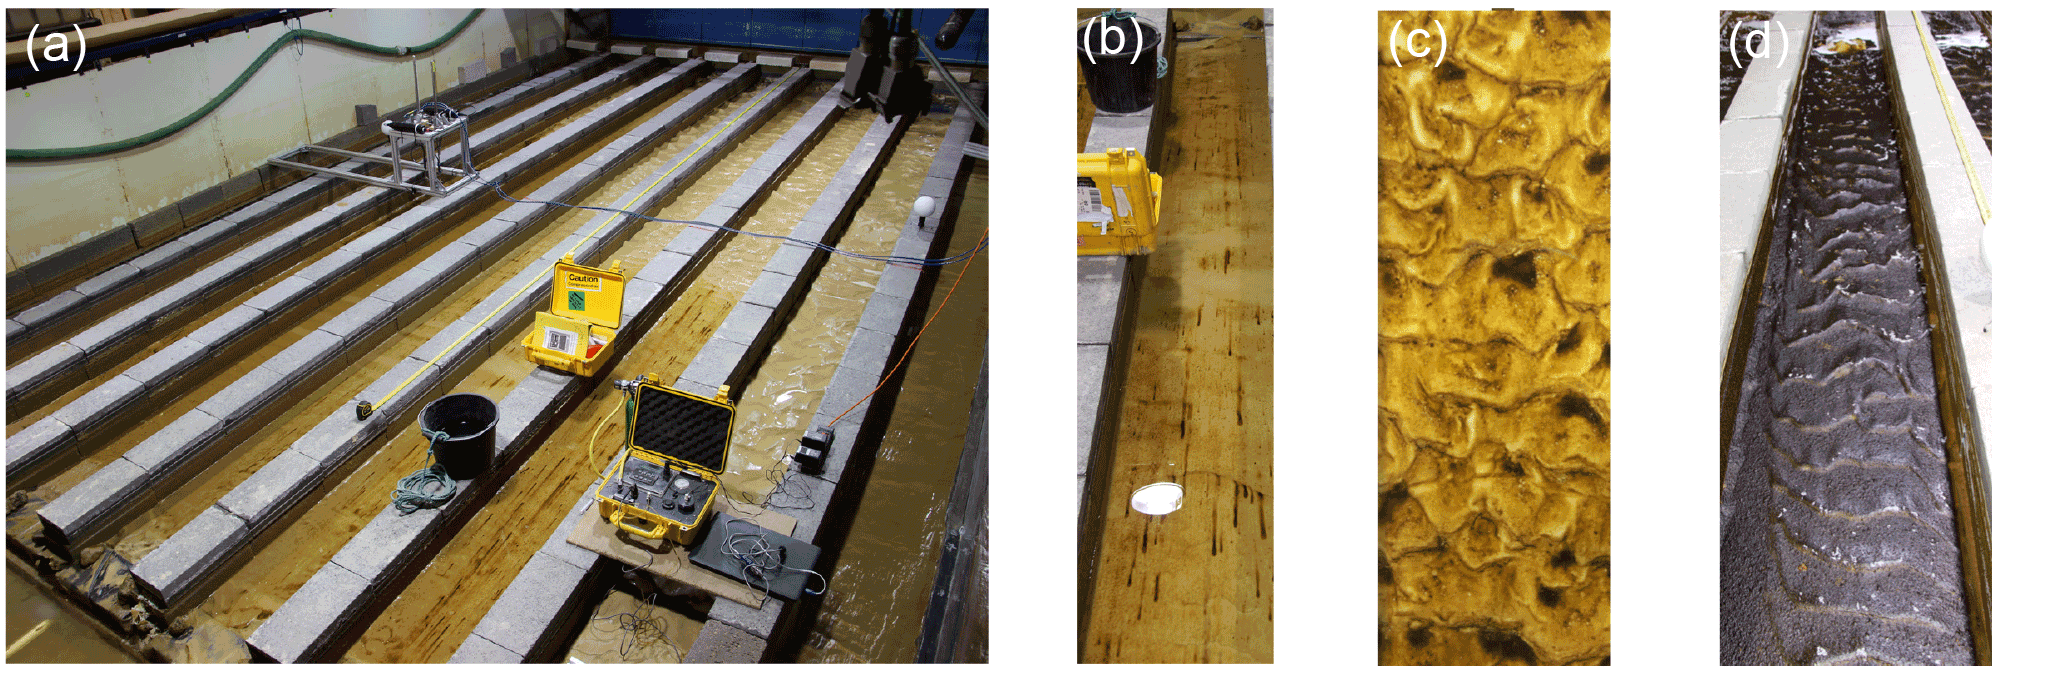
Figure 1Biofilm experiment in Total Environment Simulator flume facility. (a) Overview of experimental setup showing nine (9) parallel channels for biofilm colonisation. Channels are 9 m long and 0.48 m wide, and contain a 0.1 m thick substrate layer consisting of uniform 110 µm sandy sediment. Also visible in the yellow cases is the Cohesive Strength Meter (CSM) erosion device. Panels (b)–(d) show colonisation and development of a diatomaceous biofilm on the sandy substrate from early onset in panel (b) to a mature and dark biofilm after 6 weeks. Flow in panels (a), (c) and (d) is towards viewer, and away from viewer in panel (b).
This study reports on a flume experiment in which a natural biofilm is allowed to colonise a sandy substrate. The observations made on spatial and temporal dynamics of the sediment stabilising capacity of the natural biofilm provide a reference for auxiliary tests, using the same sandy substrate, on the sediment stabilising capacity of extracted EPSs. The aim of the auxiliary tests was to quantify the ability of extracted EPSs to replicate the sediment stabilising capacity of natural biofilms in a fast and controlled manner. Below, we describe the materials and methods used in both experiments.
2.1 Biofilm experiment
2.1.1 Experimental setup and conditions
The biofilm experiment was set up in the Total Environment Simulator flume facility at the University of Hull (Fig. 1). Nine parallel channels without an initial gradient were constructed for colonisation. Each channel was 9 m long and 0.48 m wide, and contained a 0.1 m thick substrate layer. With a typical flow depth of 0.1 m, the width-to-depth ratio of the channels was about 5. For five channels, the substrate consisted of 110 µm sand. The other four channels contained other substrates and are not included in this study. Here, we will focus on the five channels with the 110 µm sandy substrate that allowed us to investigate the temporal dynamics involved in biofilm colonisation and stabilisation. Importantly, the same 110 µm sand was also used in the second set of experiments with extracted EPSs.
Brackish water (∼ 30 g of salt per litre) representative of estuarine, mangrove and deltaic settings was recirculated at a constant rate. Typical flow velocities were 0.01–0.05 m s−1, with higher flow velocities for the central channels due to the inlet conditions. The Reynolds number was generally between 5000 and 10 000, indicating turbulent flow conditions. Lighting consisted of 10 grow lamps, positioned in two parallel lines of five light sources. Illuminance tests showed that the central channels received the highest light intensity (∼ 3000 lux) with lower intensities towards marginal channels (∼ 1500 lux). Such light intensities correspond to an overcast day. The grow lamps were alternately switched on and off for 12 h, although the experiment was never completely dark because fluorescent lighting around the flume remained switched on during the night for safety purposes.
The total experimental duration was 7 weeks. During the first 2 weeks, the biofilm community was allowed to establish and no measurements were made. In this 2-week period, the flume was inoculated using eutrophic waste water from the local aquarium and by placing rocks with a biofilm sampled from the local Humber estuary in the flume. Then, weekly measurements of EPS content and sediment entrainment were made over a 5-week period. The measurements required partial draining of the flume, and therefore about 20 % of the water volume was replaced weekly with new waste water from the aquarium. This also ensured that high nutrient levels were maintained during the entire experimental duration. When the bed was dry, sediment samples from the top 0.01 m in the vertical of every channel were taken to determine the EPS content from (see Sect. 2.1.2 for details on methodology to determine EPSs from sediment samples). Sampling sites were identified based on the visible presence of a biofilm. In total, 80 sediment samples were collected in this way. Similarly, two sediment entrainment measurements for each channel were collected using the Cohesive Strength Meter (CSM) erosion device (see Sect. 2.2 for details on the CSM erosion device). In total, 61 successful CSM measurements were made. The sediment entrainment measurements were destructive and sediment samples for determination of the EPS content could therefore not be taken from the same location. Sediment sample collection and sediment entrainment measurements took place in the most downstream located metre of the flume channels.
2.1.2 Determination of EPS content
EPS content was calculated using the phenol–sulfuric acid method, employing colour differences to determine the amount of carbohydrates (Dubois et al., 1956). The methodology can be subdivided into two main steps. First, 1.5 g of each sediment sample were weighed and placed into 15 mL centrifuge tubes. A total of 5 mL of 0.5 Mm ethylenediaminetetraacetic acid (EDTA) solution was added to each tube. The sediment–EDTA solution was then centrifuged at 5000 rpm. Following centrifuging, the supernatants were pooled and a placed in a 50 mL centrifuge tube. This was repeated two more times. Then, 35 mL of ethanol were added to the 15 mL of supernatant and left overnight.
The second step started with a 30 min centrifuge at 5000 rpm of the ethanol–supernatant solution. Then, the precipitate was dissolved in 1 mL of Milli-Q water from which the amount of carbohydrates was measured using the phenol–sulfuric acid method. This method uses a set of standards to produce a calibration curve. In this study, the standards had glucose concentrations ranging between 0 and 40 µg mL−1. Standards were produced by mixing 200 µL of the respective glucose solution with 200 µL of phenol solution and 1 mL of concentrated sulfuric acid. The samples were prepared according to the same procedure but by replacing the glucose solution with the aqueous solution. Finally, the absorbance was measured using a spectrophotometer at 490 nm. Using the glucose calibration curve, the measured absorbance was converted to a carbohydrate amount that was assumed equal to the amount of EPS. Dry weight of the sediment sample was used to calculate the EPS content.
2.2 CSM erosion device
The CSM is an erosion device (https://partrac-csm.com/) that allows for quantification of sediment entrainment thresholds and erosion rates in the laboratory as well as in the field across a variety of environments (Paterson, 1989; Tolhurst et al., 1999, 2002). The CSM uses a vertical jet of water that impinges on the sediment surface generating a normal and tangential stress at the interface. These stresses were converted to a critical horizontal shear stress (τc) according to the calibrated formulation (Tolhurst et al., 2002):
where C is the CSM-measured vertical threshold stress (kPa).
The CSM allows 39 different test routines, making it possible to vary the jet pulse duration, the pressure increments and the maximum applied pressure. For all data reported in this study, CSM test routine S7 was used as it strikes a balance between fine pressure increments while reaching a high maximum pressure, thus covering a large erosional range within the same setting. Another motivation for selection of CSM test routine S7 is that it was used in Tolhurst et al. (2002) as well, enabling a direct comparison between the data. The CSM test routine S7 starts at 0 kPa, incrementing by 2.068 kPa per step up to 82.74 kPa with a jet being fired for 1 s. A drop in transmission in the measurement chamber is indicative of an erosion event. The erosion profile usually has three different components (Tolhurst et al., 1999):
-
an initial horizontal line where the transmission is close to 100 %,
-
a slope representing the drop in transmission of light across the measurement chamber as erosion occurs and sediment is being suspended and
-
an asymptotic part where the transmission approaches 0 when the air pressure increases.
These profiles vary depending on the sediment properties. Following Tolhurst et al. (1999), the critical erosion threshold was defined as the pressure step at which the transmission drops below 90 %.
We calculated the theoretical entrainment threshold τc for our sediment according to
where θc is the Shields number (N m−2), ρs is density of sediment (kg m−3), ρ is the density of water (kg m−3), and D50 is the median grain size (m). The Shields number θc is calculated following Zanke (2003):
where Rep is the Reynolds particle number calculated by
where Δ is the relative sediment density (–) and ν is the kinematic viscosity (m2 s−1).
2.3 Petri dish sediment sample tests with extracted EPSs
In the second set of experiments, the effect of varying amounts of four different types of extracted EPSs on the sediment entrainment threshold and erosion behaviour was tested. The four different EPSs (xanthan gum, alginic acid, carrageenan and agar) were selected for their ease of availability, differences in chemical properties and absence of safety issues ensuring the potential for wide usage in future work. Xanthan gum (C35H49O29) is a polysaccharide commonly used as a food additive and has also been included in earlier laboratory tests (Tolhurst et al., 2002; Parsons et al., 2016). Alginic acid (C6H8O6)n, also known as alginate, is a carbohydrate produced by brown algae and also widely used in food. Carrageenan is a sulfate polysaccharide extracted from red seaweed and also widely used as a food additive. We used the iota variety that has two sulfate groups per disaccharide (C24H36O25S2). Agar is used as a gelling agent and is obtained from the polysaccharide agarose found in some species of red algae.
A protocol similar to the one used in Tolhurst et al. (2002) was applied to prepare the petri dish sediment samples for CSM testing. A control test with no EPSs, and four tests with increasing EPS contents of 1.25, 2.5, 5 and 10 g kg−1 of sediment were performed for the four different EPSs. The applied concentrations of the extracted EPSs were based on reported values in the literature (Taylor et al., 1999; Tolhurst et al., 2002) and were also compared to the EPS content measured in the natural biofilm experiment. The required EPS amount was added to 330 mL of distilled water and mixed thoroughly by a magnetic stirrer. The EPS solution was then added to 650 g of dry 110 µm sand and mixed with an electric stirrer to distribute the EPS solution throughout the sand. The sand–EPS mixture was then poured into plastic petri dishes (5 cm diameter) to a depth of 1 cm. Irregularities on the sediment surface increase the bed roughness and stress (Tolhurst et al., 2002); therefore, care was taken to create a level surface by tapping the side of the petri dishes before testing. All test conditions were repeated five times, and all tests were performed under fully saturated conditions.
2.3.1 Preparation procedure
Protocol development on the application and effects of different extracted EPSs required an assessment of the impact of the preparation procedure on the sediment entrainment threshold. To this end, the preparation procedure described above, referred to as “wet mixing”, was complemented by a preparation procedure referred to as “dry mixing”. Both procedures used the same sand, EPSs and amounts, but the order in which they were combined and mixed was changed. In contrast to the wet mixing procedure, in the dry mixing procedure, the required amount of EPSs was first added to the sand and mixed with an electric stirrer. Then, 330 mL of distilled water was added to the dry sand–EPS mixture and a further mixing with the electrical stirrer was performed. Note that the risk of dust formation and associated loss of EPS powder was greater in the dry mixing procedure.
2.3.2 Environmental conditions
Protocol development on the application and effects of different EPSs also required an assessment of the impact of the different environmental conditions on the sediment entrainment threshold. Temperature, salinity and pH commonly vary between flume facilities. Therefore, a sensitivity analysis on the effects of these environmental conditions on the sediment entrainment threshold for the four extracted EPSs was performed. For temperature, tests were performed at 10 and 40 ∘C in addition to the control tests at room temperature of 20 ∘C. For pH, tests were performed with a pH of 4 and a pH of 10 in addition to the control tests of a pH of 7. Standard and commercially available buffer solutions were used to obtain liquids with these pH values. For salinity, tests with a salinity of 30 ppm corresponding to brackish conditions were performed in addition to the control tests with distilled freshwater.
2.4 Biostabilisation index
A biostabilisation index (Manzenrieder, 1983; Tolhurst et al., 1999; Friend et al., 2003a; Thom et al., 2015) was calculated to quantify and compare the degree of biostabilisation in the natural biofilm and extracted EPS experiments. The biostabilisation index was calculated from the ratio of the critical erosion shear stress (τc) of the relevant experiment to the τc for the uncolonised sand. Since the same sand was used in both experiments, a direct comparison between biostabilisation indices from the natural biofilm experiment and the extracted EPSs can be made. For the natural biofilm experiment, the mean, median and maximum critical erosion shear stresses from 61 measurements were used in calculating the biostabilisation index. For the extracted EPS experiment, the mean critical erosion shear stress was used in calculating the biostabilisation index.
3.1 Biofilm colonisation and species ecology of the natural biofilm experiment
The eutrophic water used in the experiment resulted in rapid colonisation and growth of a diatomaceous biofilm on the substrate materials (Fig. 1a). After 2 weeks, biofilm colonisation and growth was localised and organised into darker stripes running parallel to the main flow (Fig. 1b). Colonisation and development of the biofilm continued over the next 5 weeks, resulting in a more widespread biofilm coverage (Fig. 1c). At the end of the experiment, after 7 weeks, the sandy substrate in the channels was covered by a few millimetres' thickness of black biofilm crust (Fig. 1d). At this stage, mortality of the biofilm had set in locally, which was illustrated by greyish patches within the black healthy biofilm that were sometimes eroded. This observation ensured that we observed the full life cycle of a diatomaceous biofilm from early colonisation to mortality and subsequent crust erosion.
Microscope investigations of the species ecology confirmed a saline environment that was dominated by halophilous diatoms, which are common in coastal zones (Pan et al., 2004). The diverse flora was dominated by five main species: (a) Nitzschia pellucida, (b) Nitzschia sigma, (c) Mastogloia sp., (d) Navicula perminuta and (e) Amphora pediculus. The Nitzschia species are considered early colonisers (Ledger et al., 2008; Ros et al., 2009) and were indeed found primarily in the samples of the early stages of the experiment. Furthermore, all taxa were benthic rather than planktonic, as expected in lotic conditions (Passy, 2001; Schmidt et al., 2016). Some diatoms were attached to the sediment grains while others were motile and unattached to the substrate. Also, ciliates were present and presumably eating the diatoms. Importantly, many of the species observed were obligate and cannot tolerate freshwater, in agreement with the designed experimental conditions.
3.2 Sediment stability from biofilm-secreted EPSs
Figure 2 shows a cumulative probability distribution of the CSM sediment stability measurements made during the flume experiment. The average shear stress entrainment threshold was 0.69 N m−2 with a standard deviation of 0.82 N m−2. The distribution is highly skewed towards lower shear stresses, as evidenced by a median shear stress entrainment threshold of 0.23 N m−2. This median value was just above the CSM-measured entrainment threshold for the uncolonised sand of 0.18 N m−2, which is in close agreement with the theoretical entrainment threshold for the 110 µm sand of 0.15 N m−2 (Eq. 2). Notably, 42 % of the measurements were smaller than the entrainment threshold for the uncolonised sand, even though a biofilm was clearly visible at the substrate surface for all measurements. A maximum entrainment threshold of 3.84 N m−2 was measured, which represents a more than 21 times higher erodibility threshold compared to the uncolonised sand. Entrainment thresholds were higher in the first 3 weeks (week 1: 0.93 N m−2 (mean value); week 2: 0.84 N m−2; week 3: 1.01 N m−2) in comparison to the last two weeks (week 4: 0.29 N m−2; week 5: 0.34 N m−2). The standard deviations of the erodibility thresholds (week 1: 0.66 N m−2; week 2: 0.94 N m−2; week 3: 1.15 N m−2; week 4: 0.53 N m−2; week 5: 0.40 N m−2) are of similar magnitude as or larger magnitude than the mean values and indicative of the large spatial variation in and between flumes at any given time.
The average carbohydrate content, here equated to EPS content, was 7.8 µg g−1 of sand with a standard deviation of 7.8 µg g−1 (Fig. 3). The measurements were best described by an exponential fit with a mean parameter μ of 7.88, highlighting the skewed character of the data with many lower content observations and fewer towards higher EPS contents. The maximum measured EPS content was 34.6 µg g−1 of sand. In contrast to the sediment entrainment threshold (Fig. 2), the average EPS content increased on a weekly basis from 5.6 µg g−1 of sand in the first week to 11.6 µg g−1 of sand in the final week.
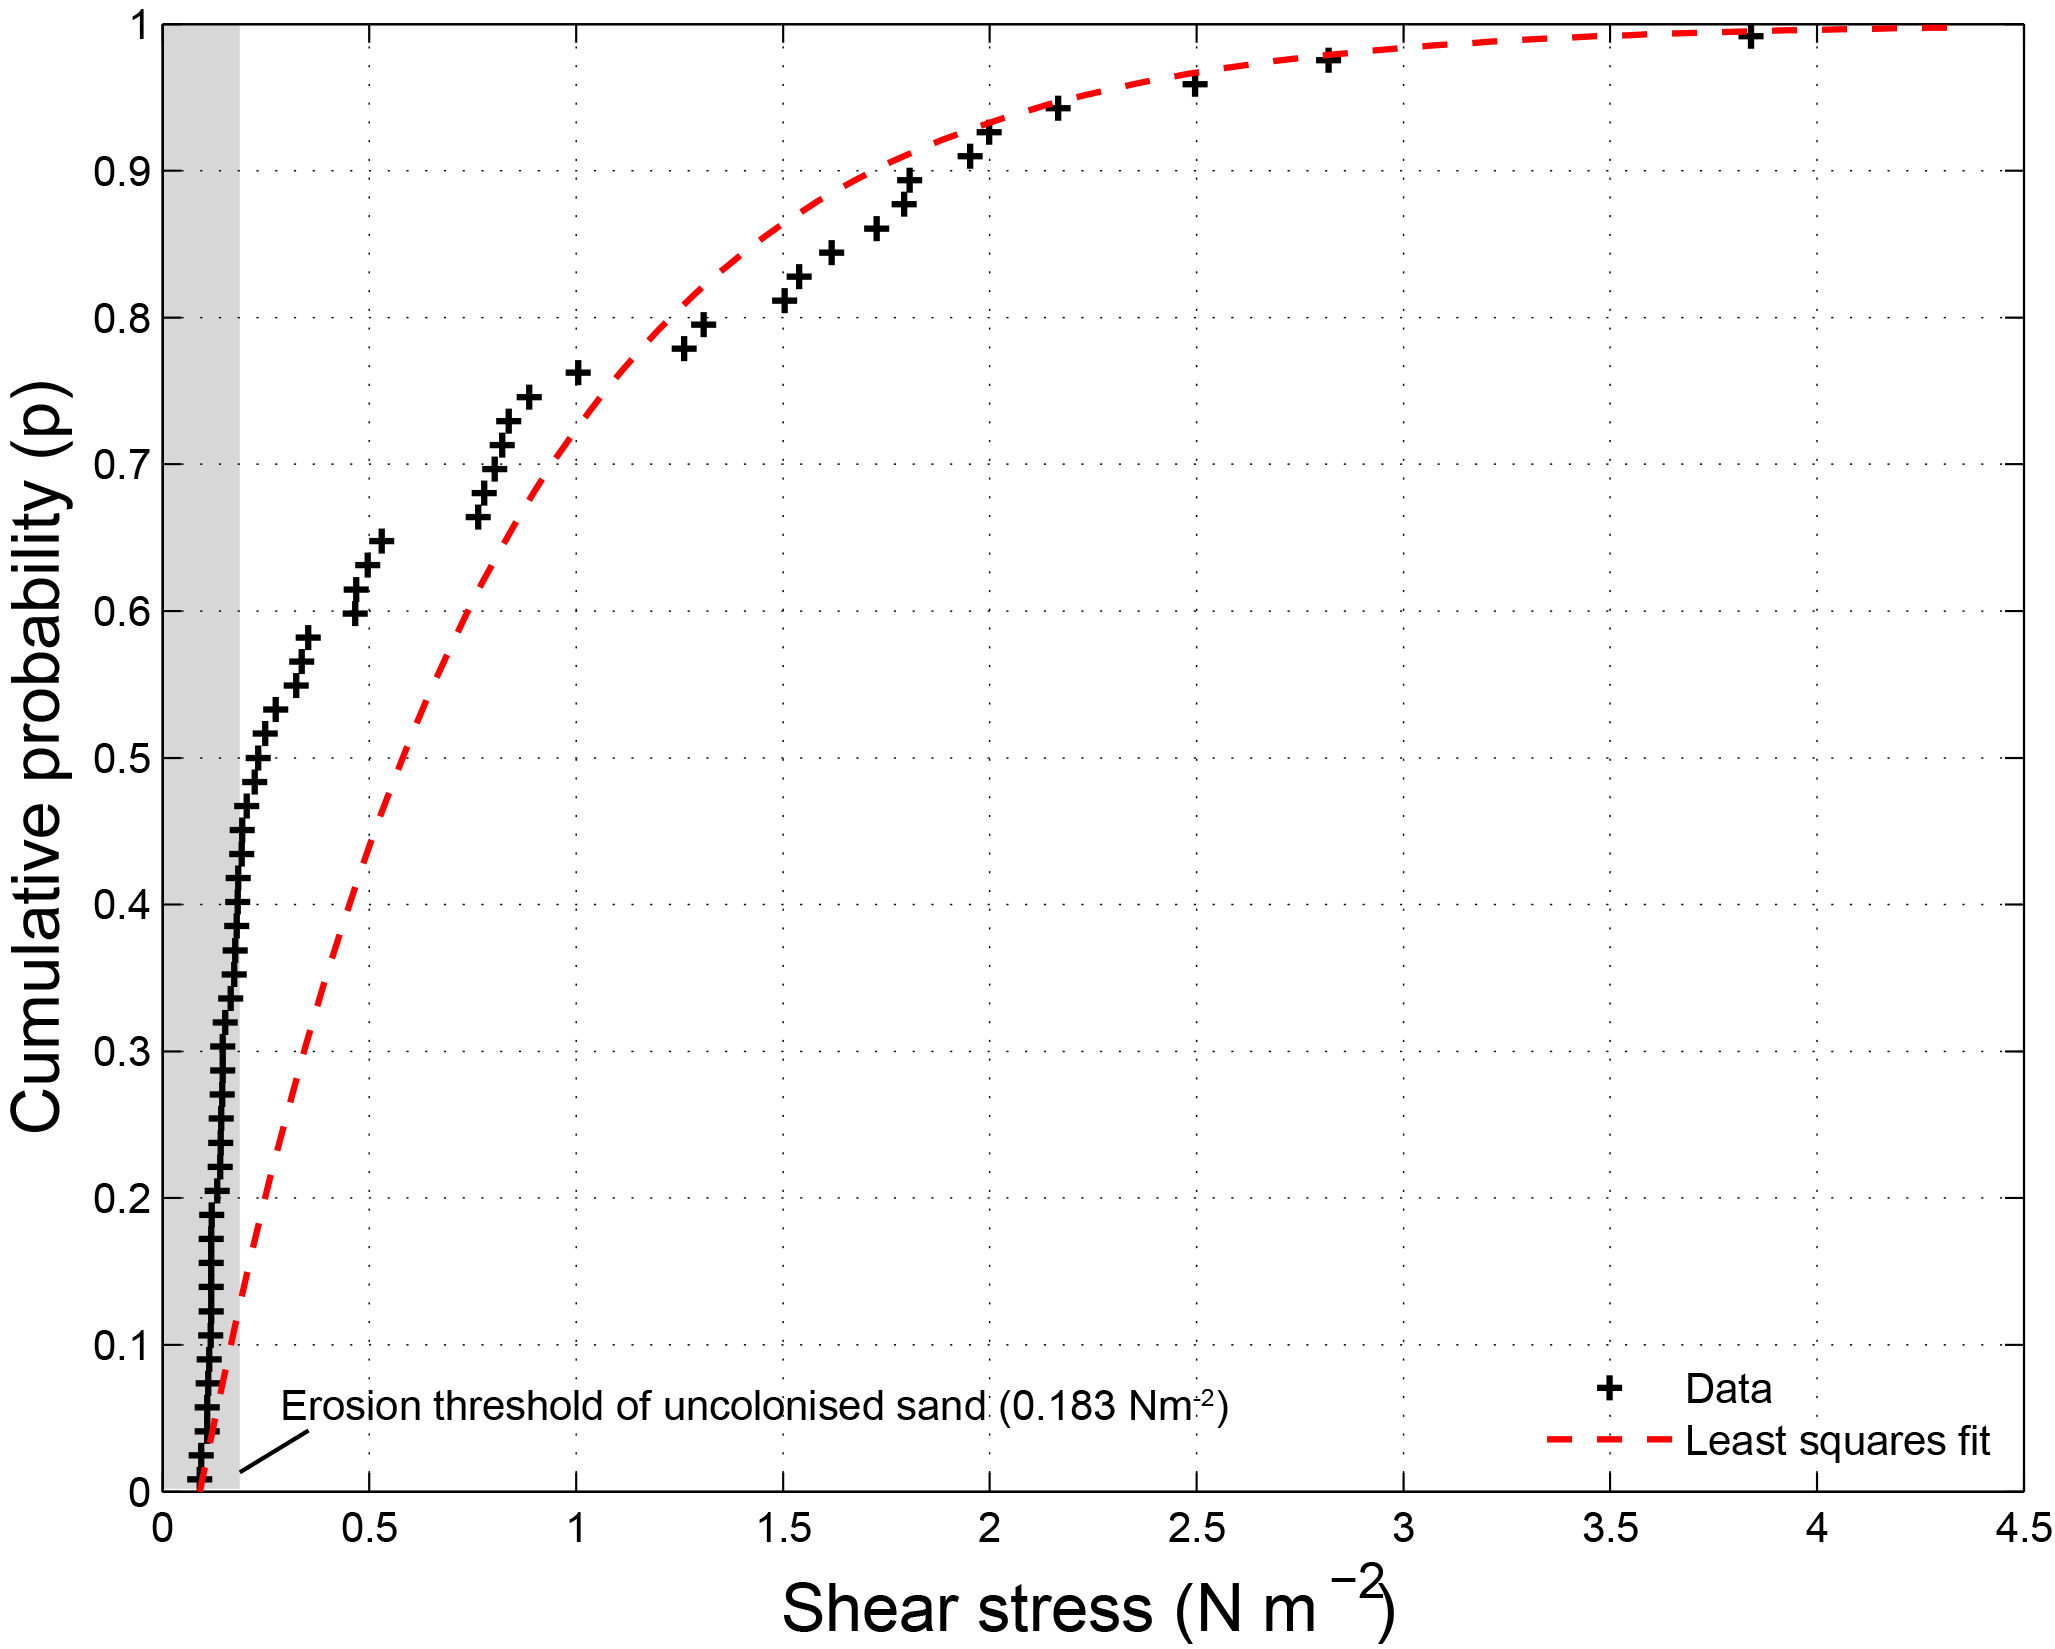
Figure 2Shear stress measurements made with CSM erosion device during natural biofilm growth experiment. The measurements (n = 61) are best described by a least squares exponential fit with a mean parameter μ of 0.71.
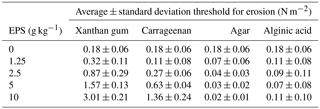
Table 1Threshold for erosion of four extracted EPSs measured with the CSM erosion device. Statistics calculated from n = 5 repeat measurements.
3.3 Sediment stability from extracted EPS
Section 3.2 above illustrated that experiments involving natural biofilms typically take multiple weeks to capture the complete life cycle. As these flume experiments are costly, extracted EPSs have the potential to provide an effective alternative to reproduce the sediment stabilising effects on natural biofilms in a fast and controlled manner. Below, the second set of experiments focusing on extracted EPSs is described.
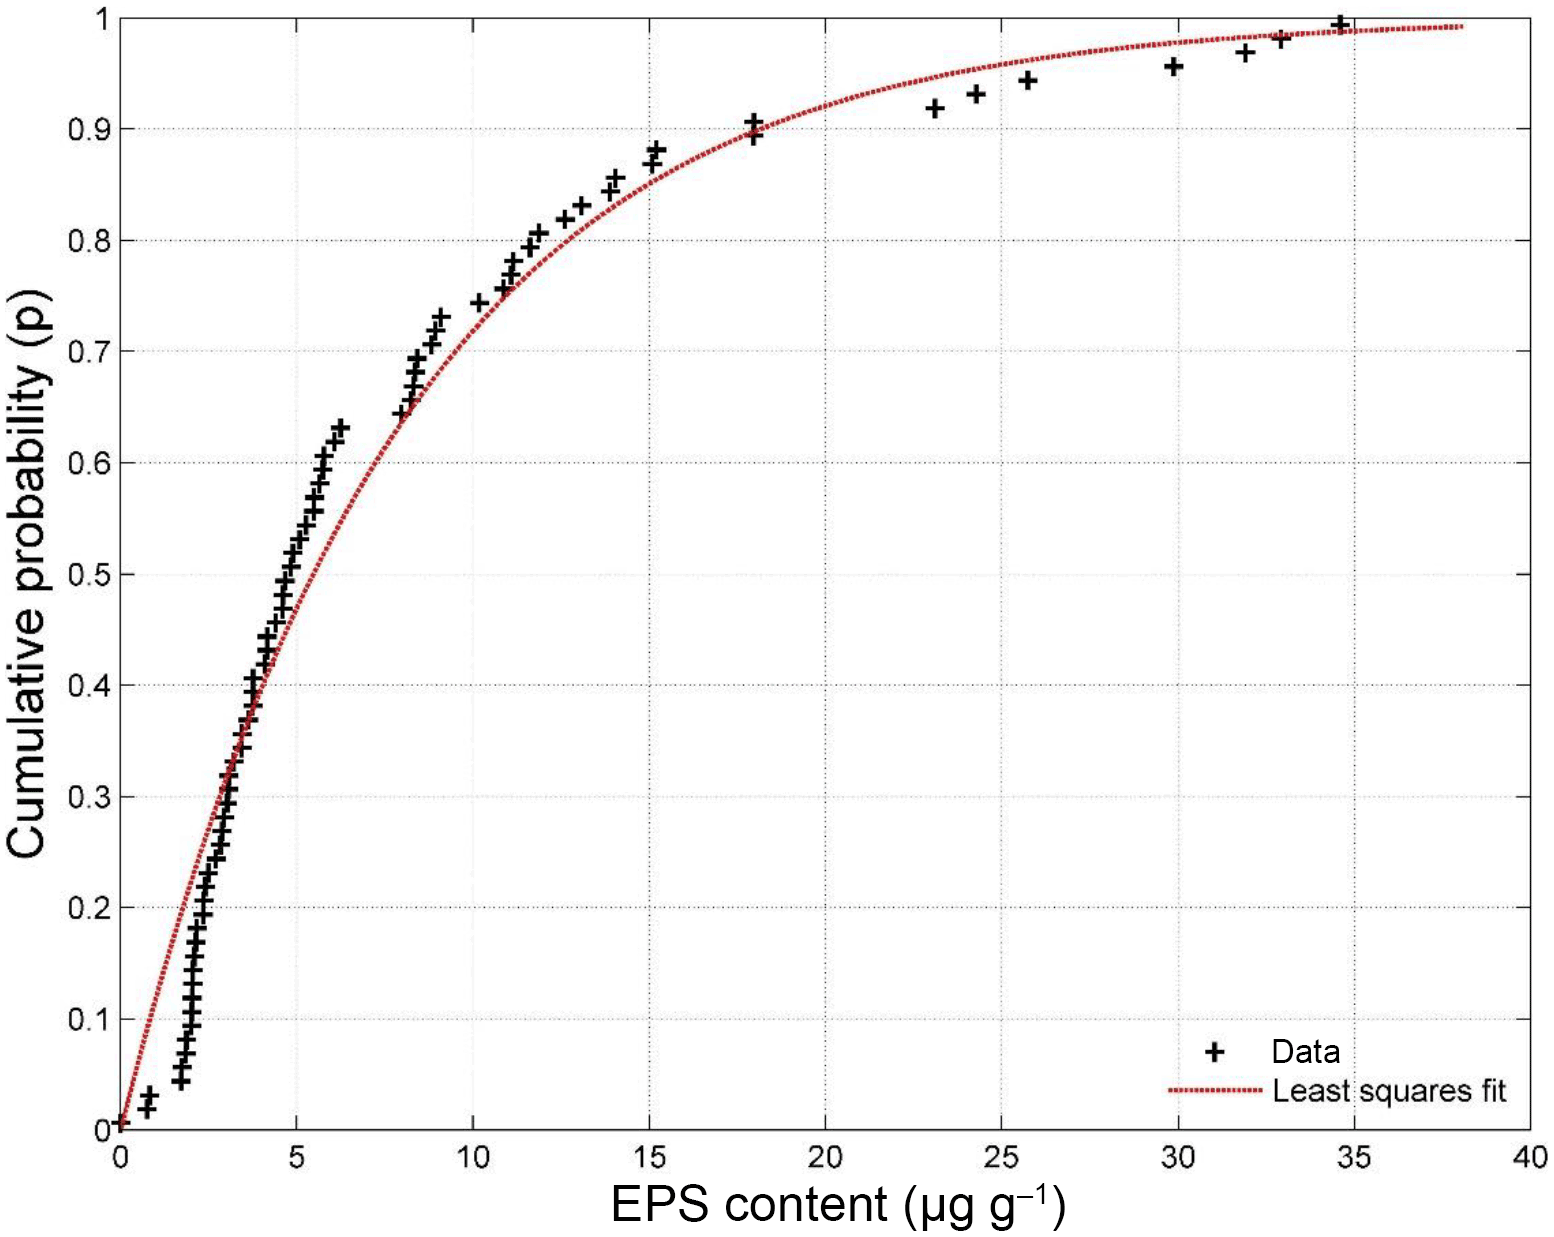
Figure 3EPS content measurements made during natural biofilm growth experiment. The measurements (n = 80) are best described by a least squares exponential fit with a mean parameter μ of 7.88.
3.3.1 Effects of extracted EPS content on sediment stability
The four extracted EPSs had different effects on sediment stability (Fig. 4). Alginic acid and agar did not increase the sediment stability above the threshold for erosion of the sand without EPSs, for all applied concentrations. For xanthan gum and carrageenan, the threshold for erosion generally increased with increasing EPS content (Table 1). For these EPSs, the relationship between the critical shear stress for erosion and EPS content was best described using linear models (Fig. 4), where the slope of the linear model for xanthan gum (0.28) was more than double the slope of the linear model for carrageenan (0.11).
3.3.2 Effects of preparation procedure on sediment stability
The preparation procedure adopted for adding the extracted compounds to the sediment material had an impact on the resultant threshold for erosion (Fig. 5). Dry mixing the extracted EPS powder with the sediment prior to adding water resulted in a higher threshold for erosion than wet mixing the EPS powder with sediment in water for all tested EPSs. The difference was greatest for xanthan gum with a 67 % higher threshold for erosion for the dry mixing procedure compared to the wet mixing procedure.
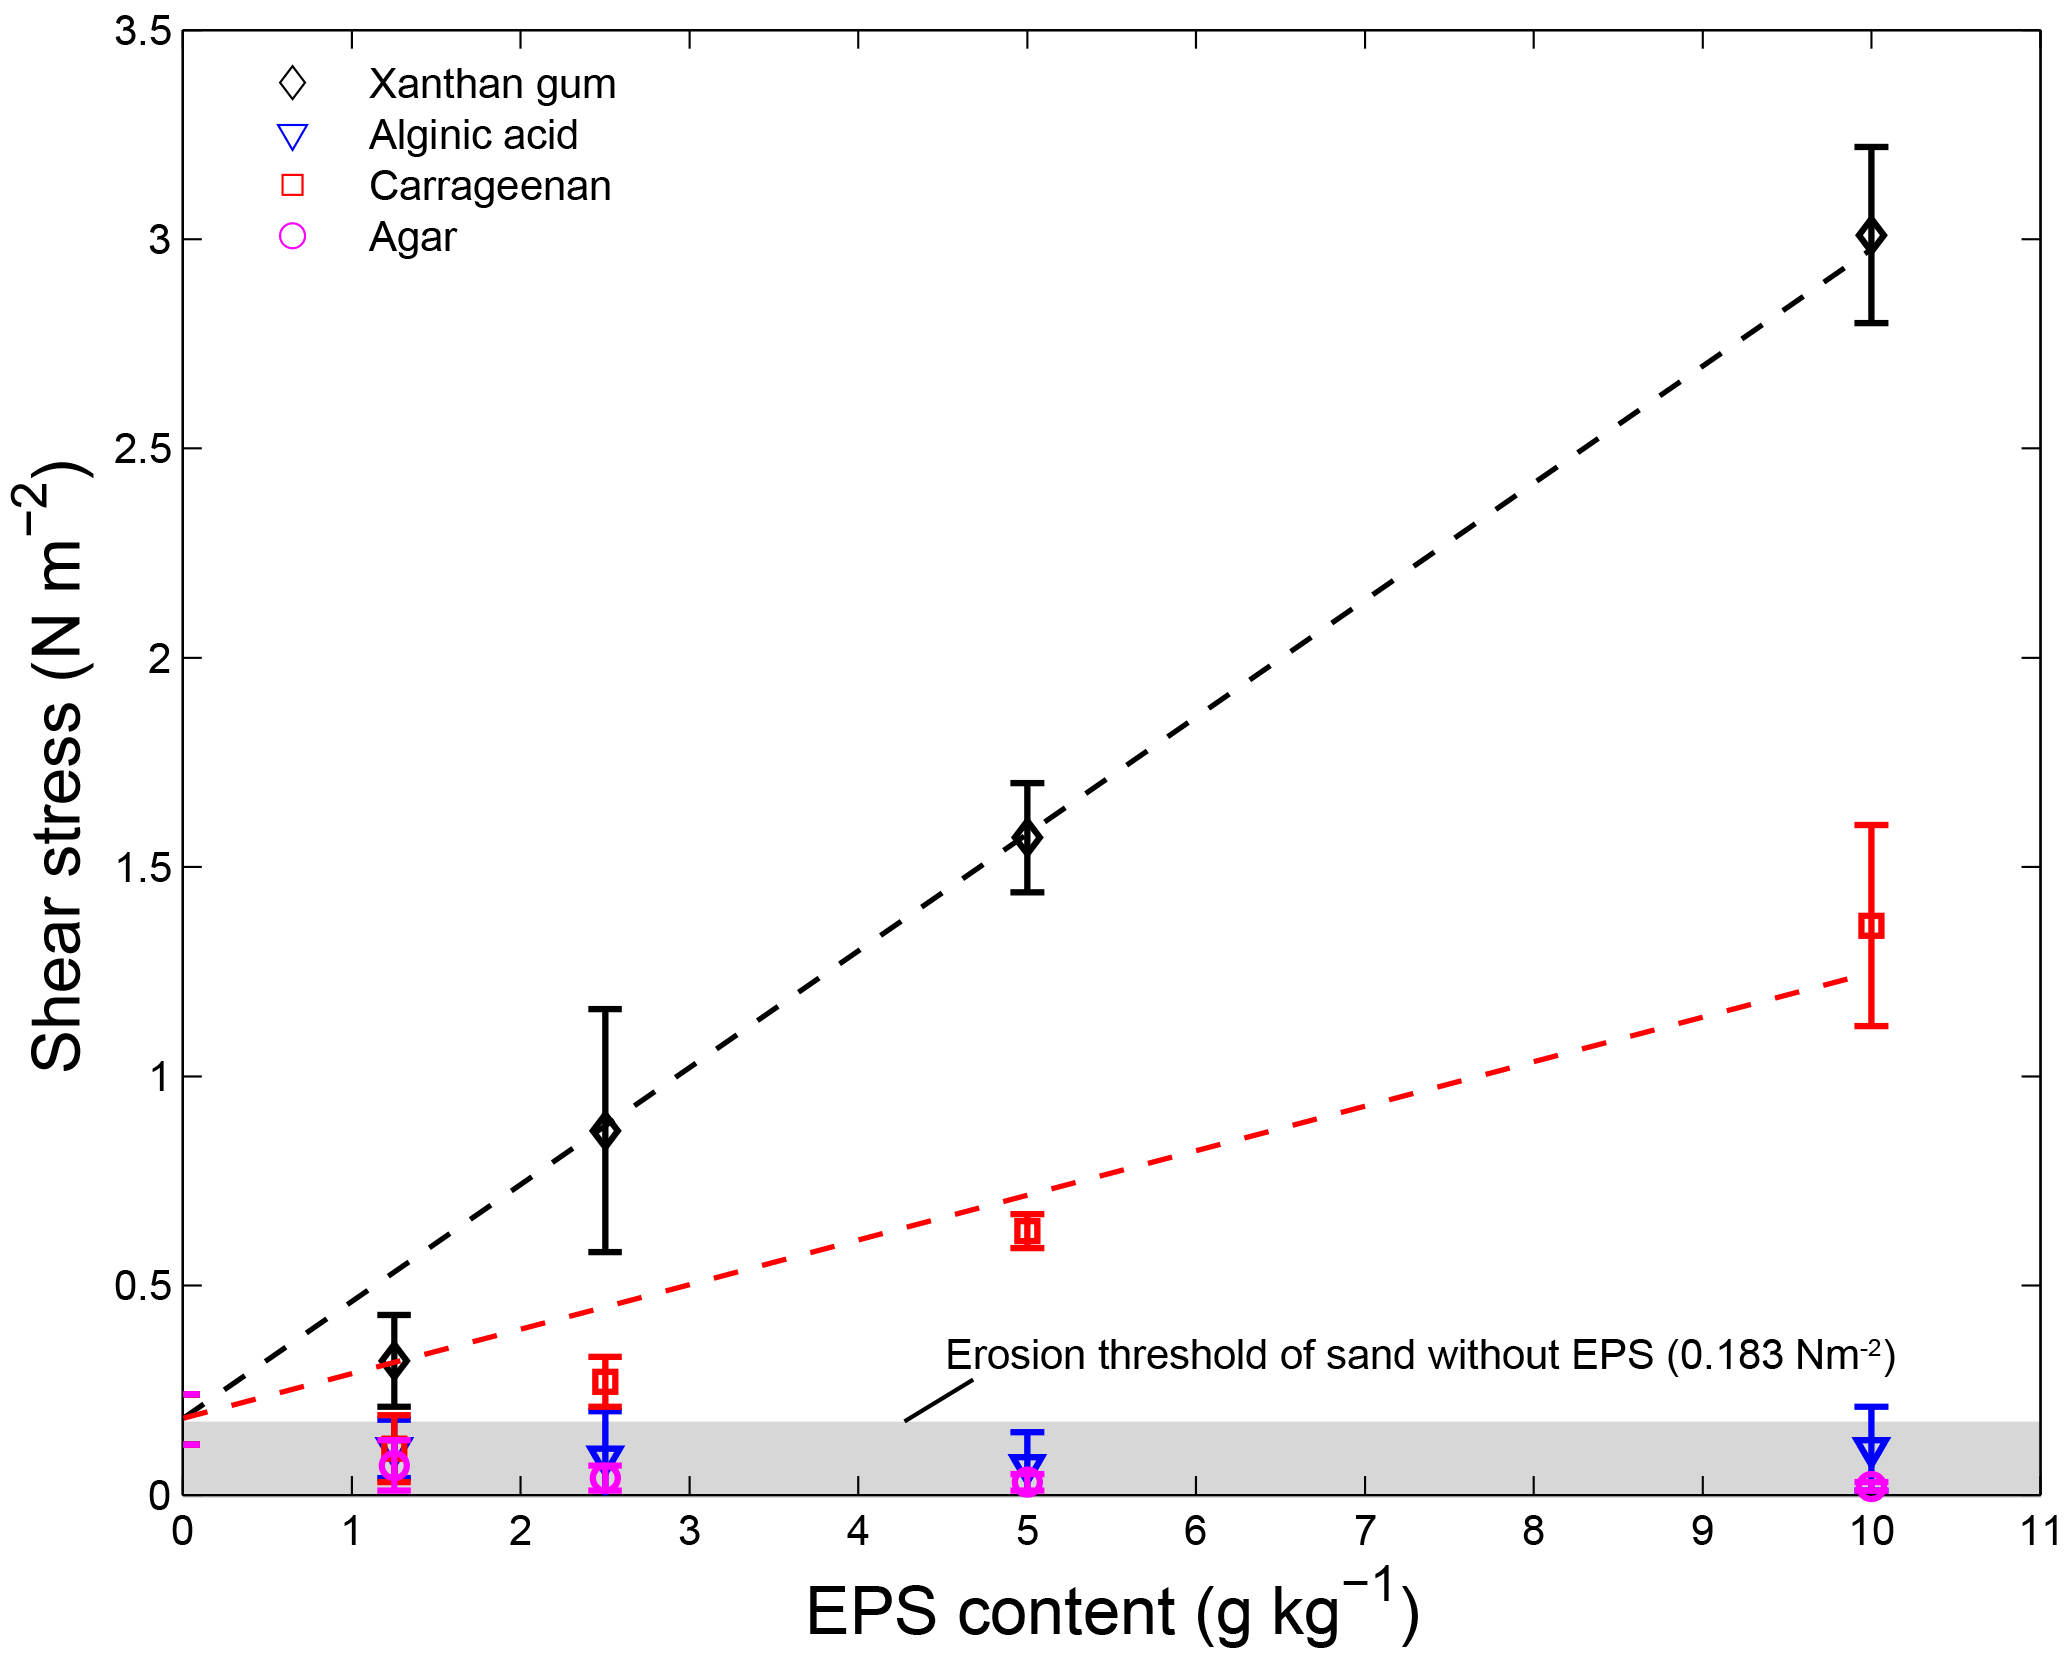
Figure 4The threshold for erosion of 110 µm sandy substrate with different contents for four extracted EPSs as measured with the CSM erosion device. Best-fit curves were fitted using linear models for xanthan gum (shear stress threshold of 0.28; EPS content of + 0.18) and carrageenan (shear stress threshold of 0.11; EPS content of + 0.18). Error bars are standard deviations from n = 5 repeat measurements.
3.3.3 Temporal effects on sediment stability
Time elapsed from initial mixing also affected the sediment stabilising capacity of extracted EPSs (Fig. 6). Repeat measurements after 1 day, 7 days and 15 days demonstrated that the thresholds for erosion remained constant throughout the first week. However, the repeat measurements after 15 days showed a decrease in the threshold for erosion below the threshold for erosion of sand without EPSs. This effectively meant that after about 2 weeks of initial application of EPSs the impact on the threshold for erosion of the sediment ceased to exist.
3.3.4 Effects of salinity on sediment stability
Salinity had a limited effect on the threshold for erosion (Fig. 7). Saline water tended to decrease the threshold for erosion compared to freshwater conditions, though the differences are statistically insignificant for all four EPSs. The threshold for erosion of alginic acid and agar remained below the threshold for erosion of sand without EPSs independent of the salinity of the water. These findings imply that the results of the extracted EPS experiments, which were mostly obtained for freshwater conditions, can be extrapolated to saline conditions.
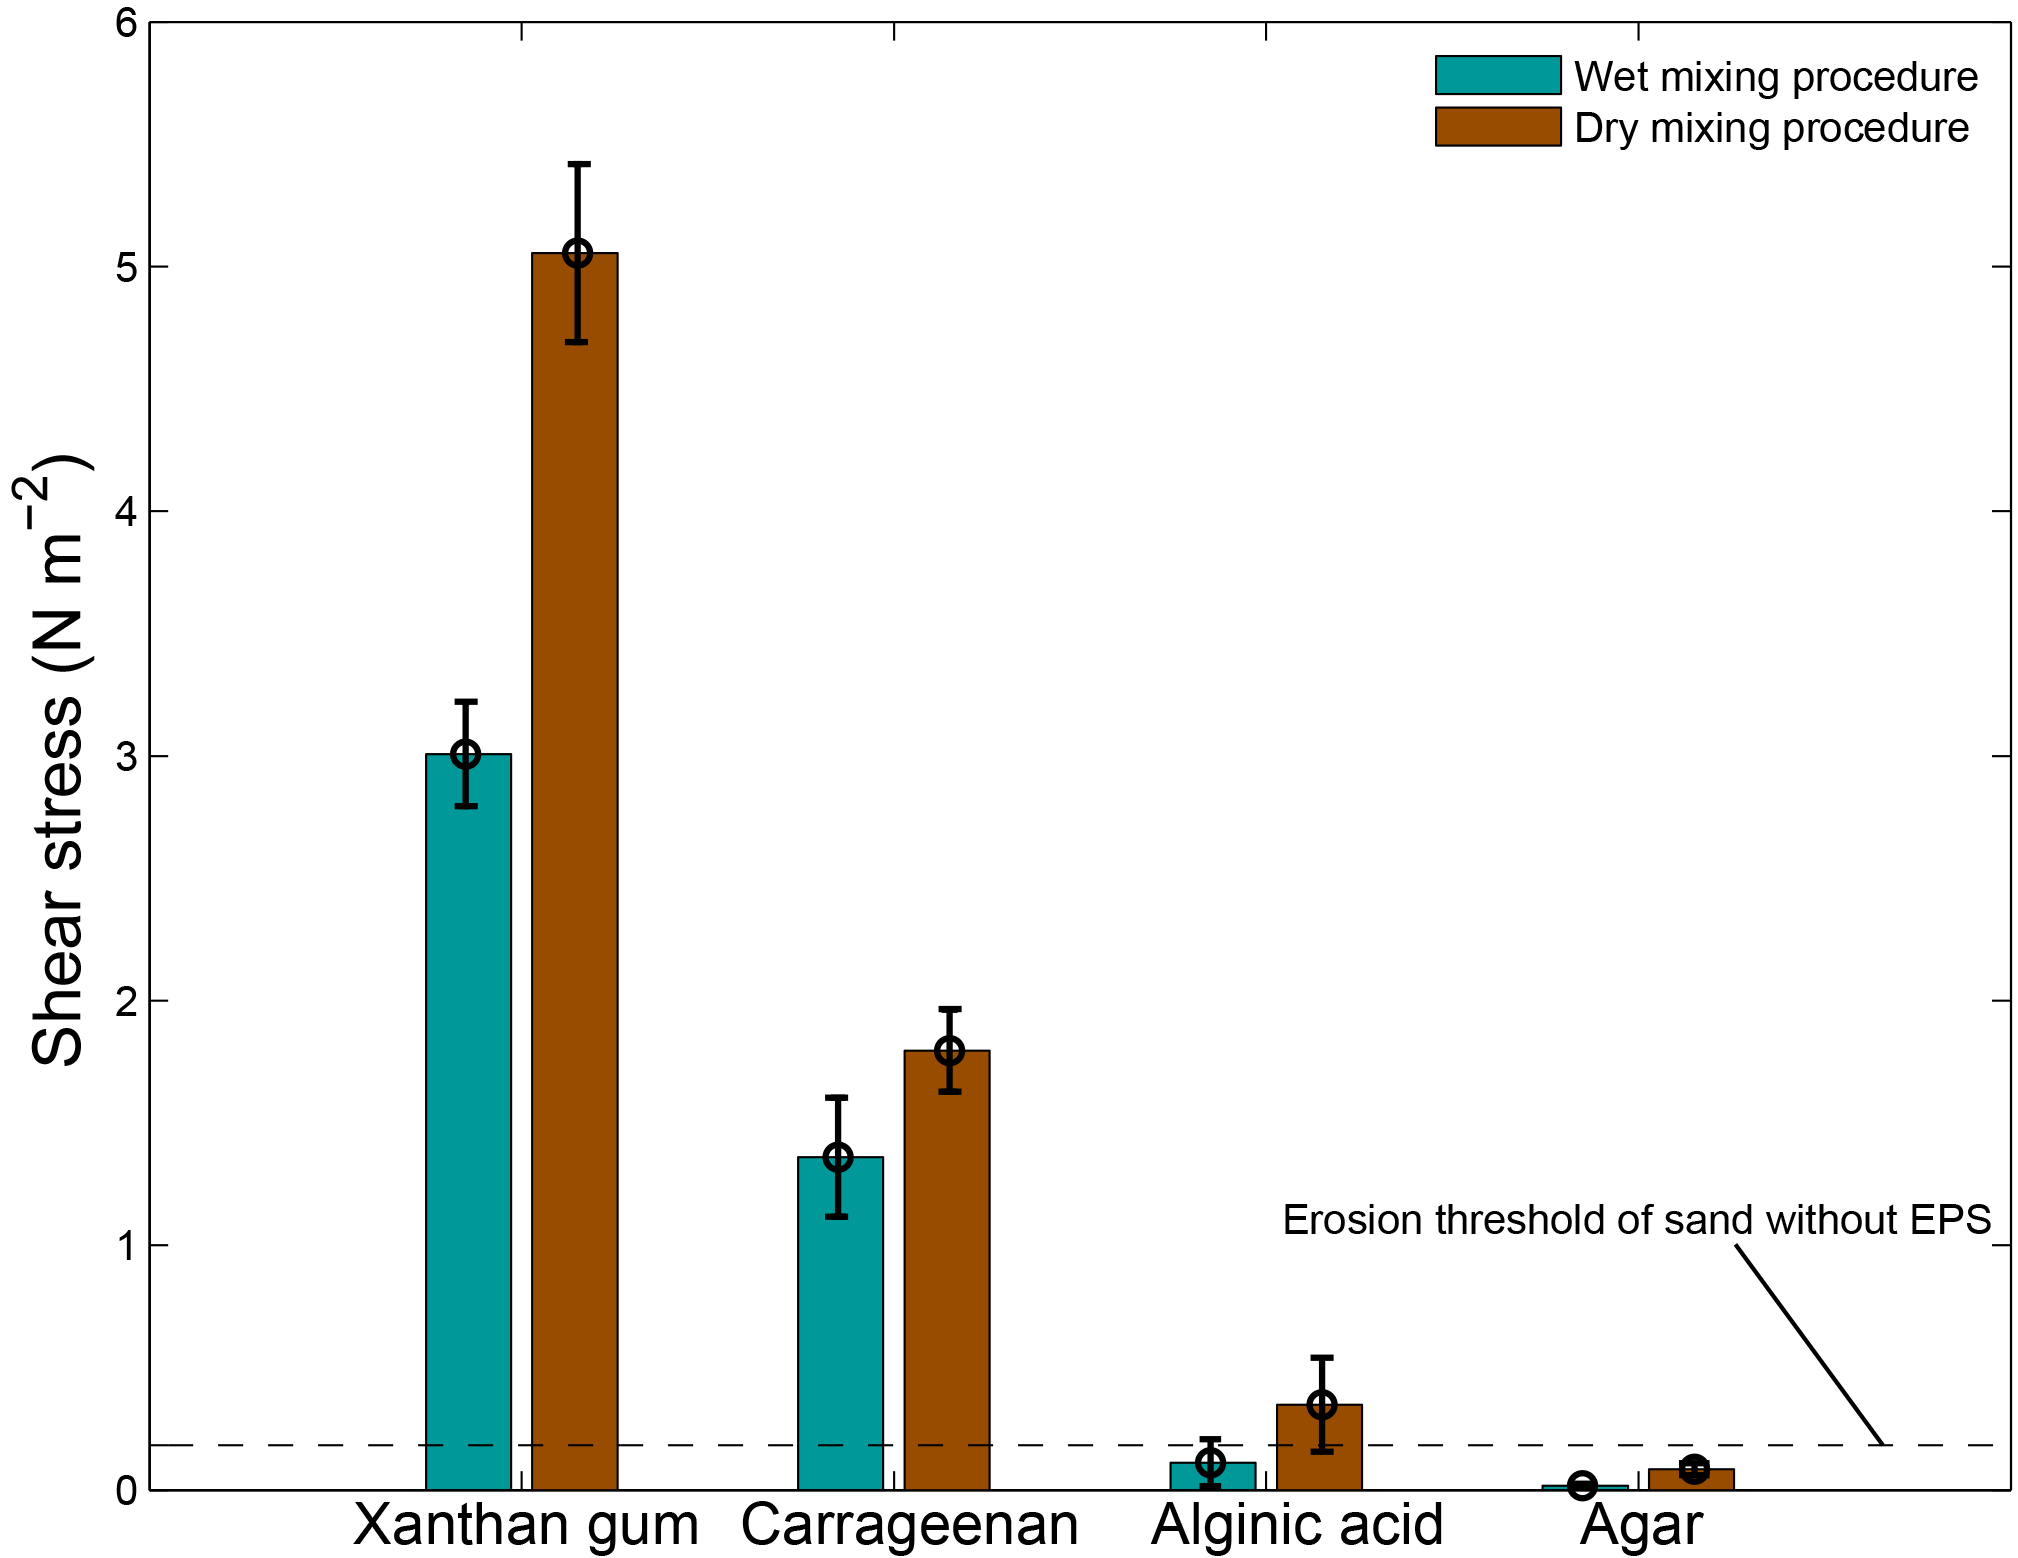
Figure 5The erosion thresholds as a function of the preparation procedure for four surrogates as measured with the CSM erosion device. Error bars are standard deviations from n = 5 repeat measurements.
3.3.5 Effects of pH on sediment stability
The pH of the applied solution had variable effects on the threshold for erosion (Fig. 8). An acid solution with a pH of 4 resulted in a higher threshold for erosion of xanthan gum but in a lower threshold for carrageenan. An alkaline solution with a pH of 10 resulted in a lower threshold for erosion of xanthan gum as well as carrageenan. The threshold for erosion of alginic acid and agar remained below the threshold for erosion of sand without EPSs, independent of the pH of the solution.
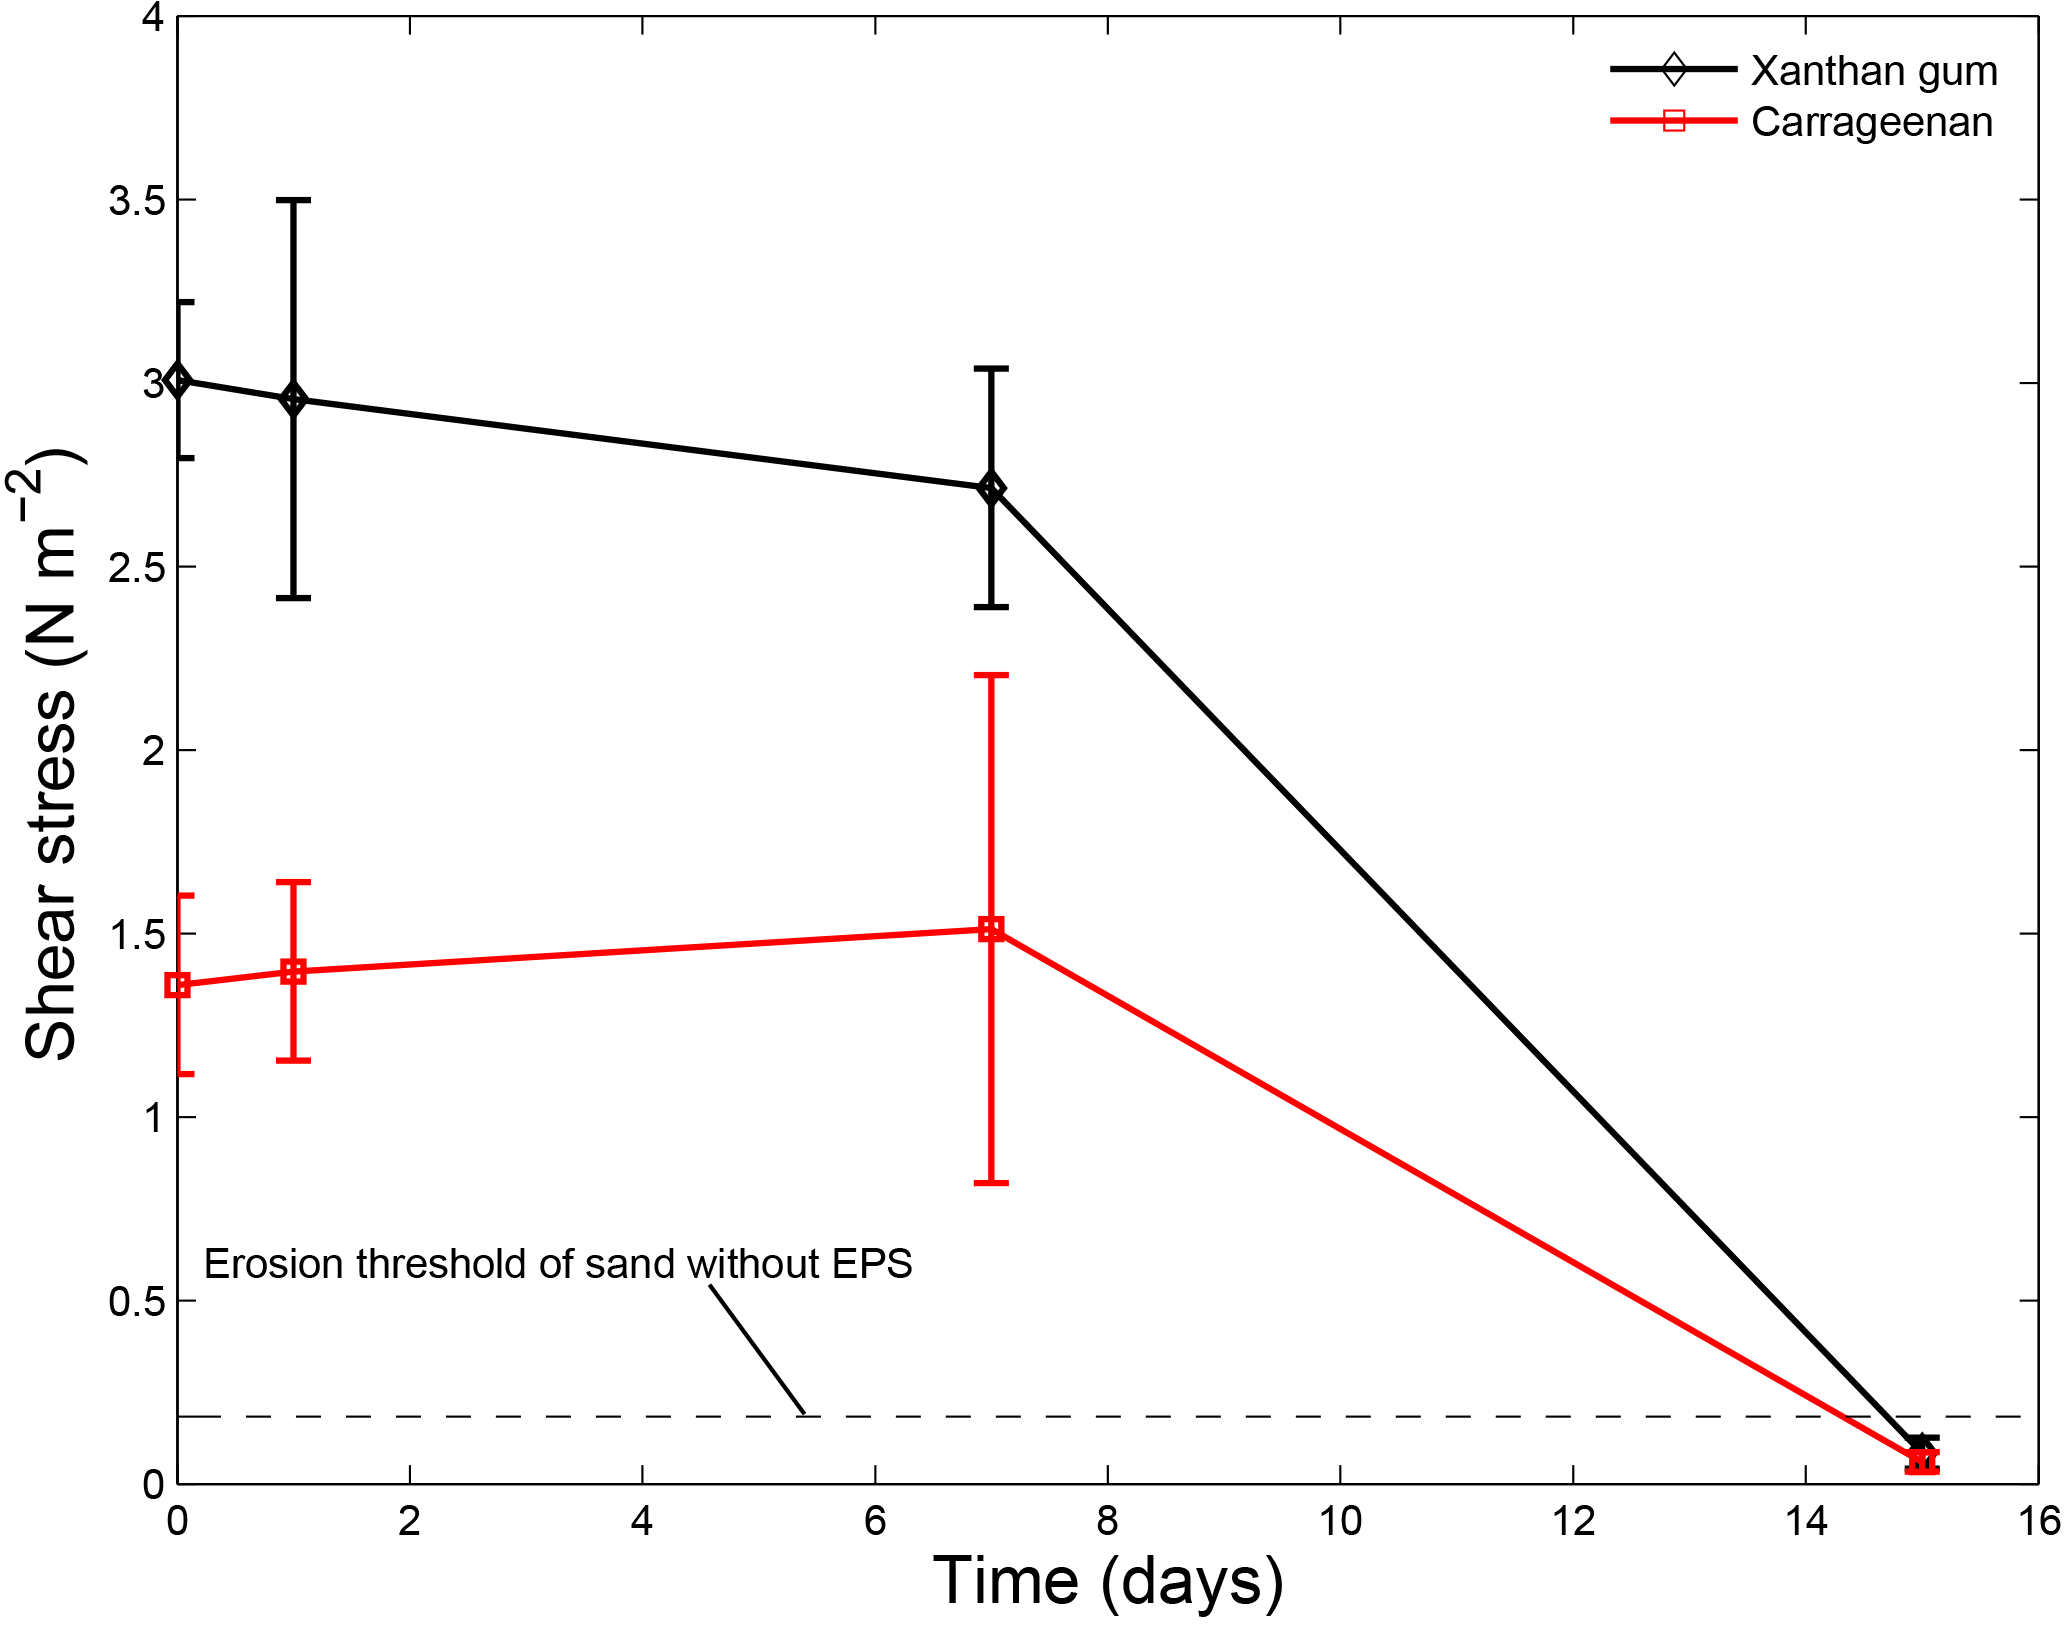
Figure 6The threshold for erosion as a function of time for xanthan gum and carrageenan as measured with the CSM erosion device. Error bars are standard deviations from n = 3 repeat measurements.
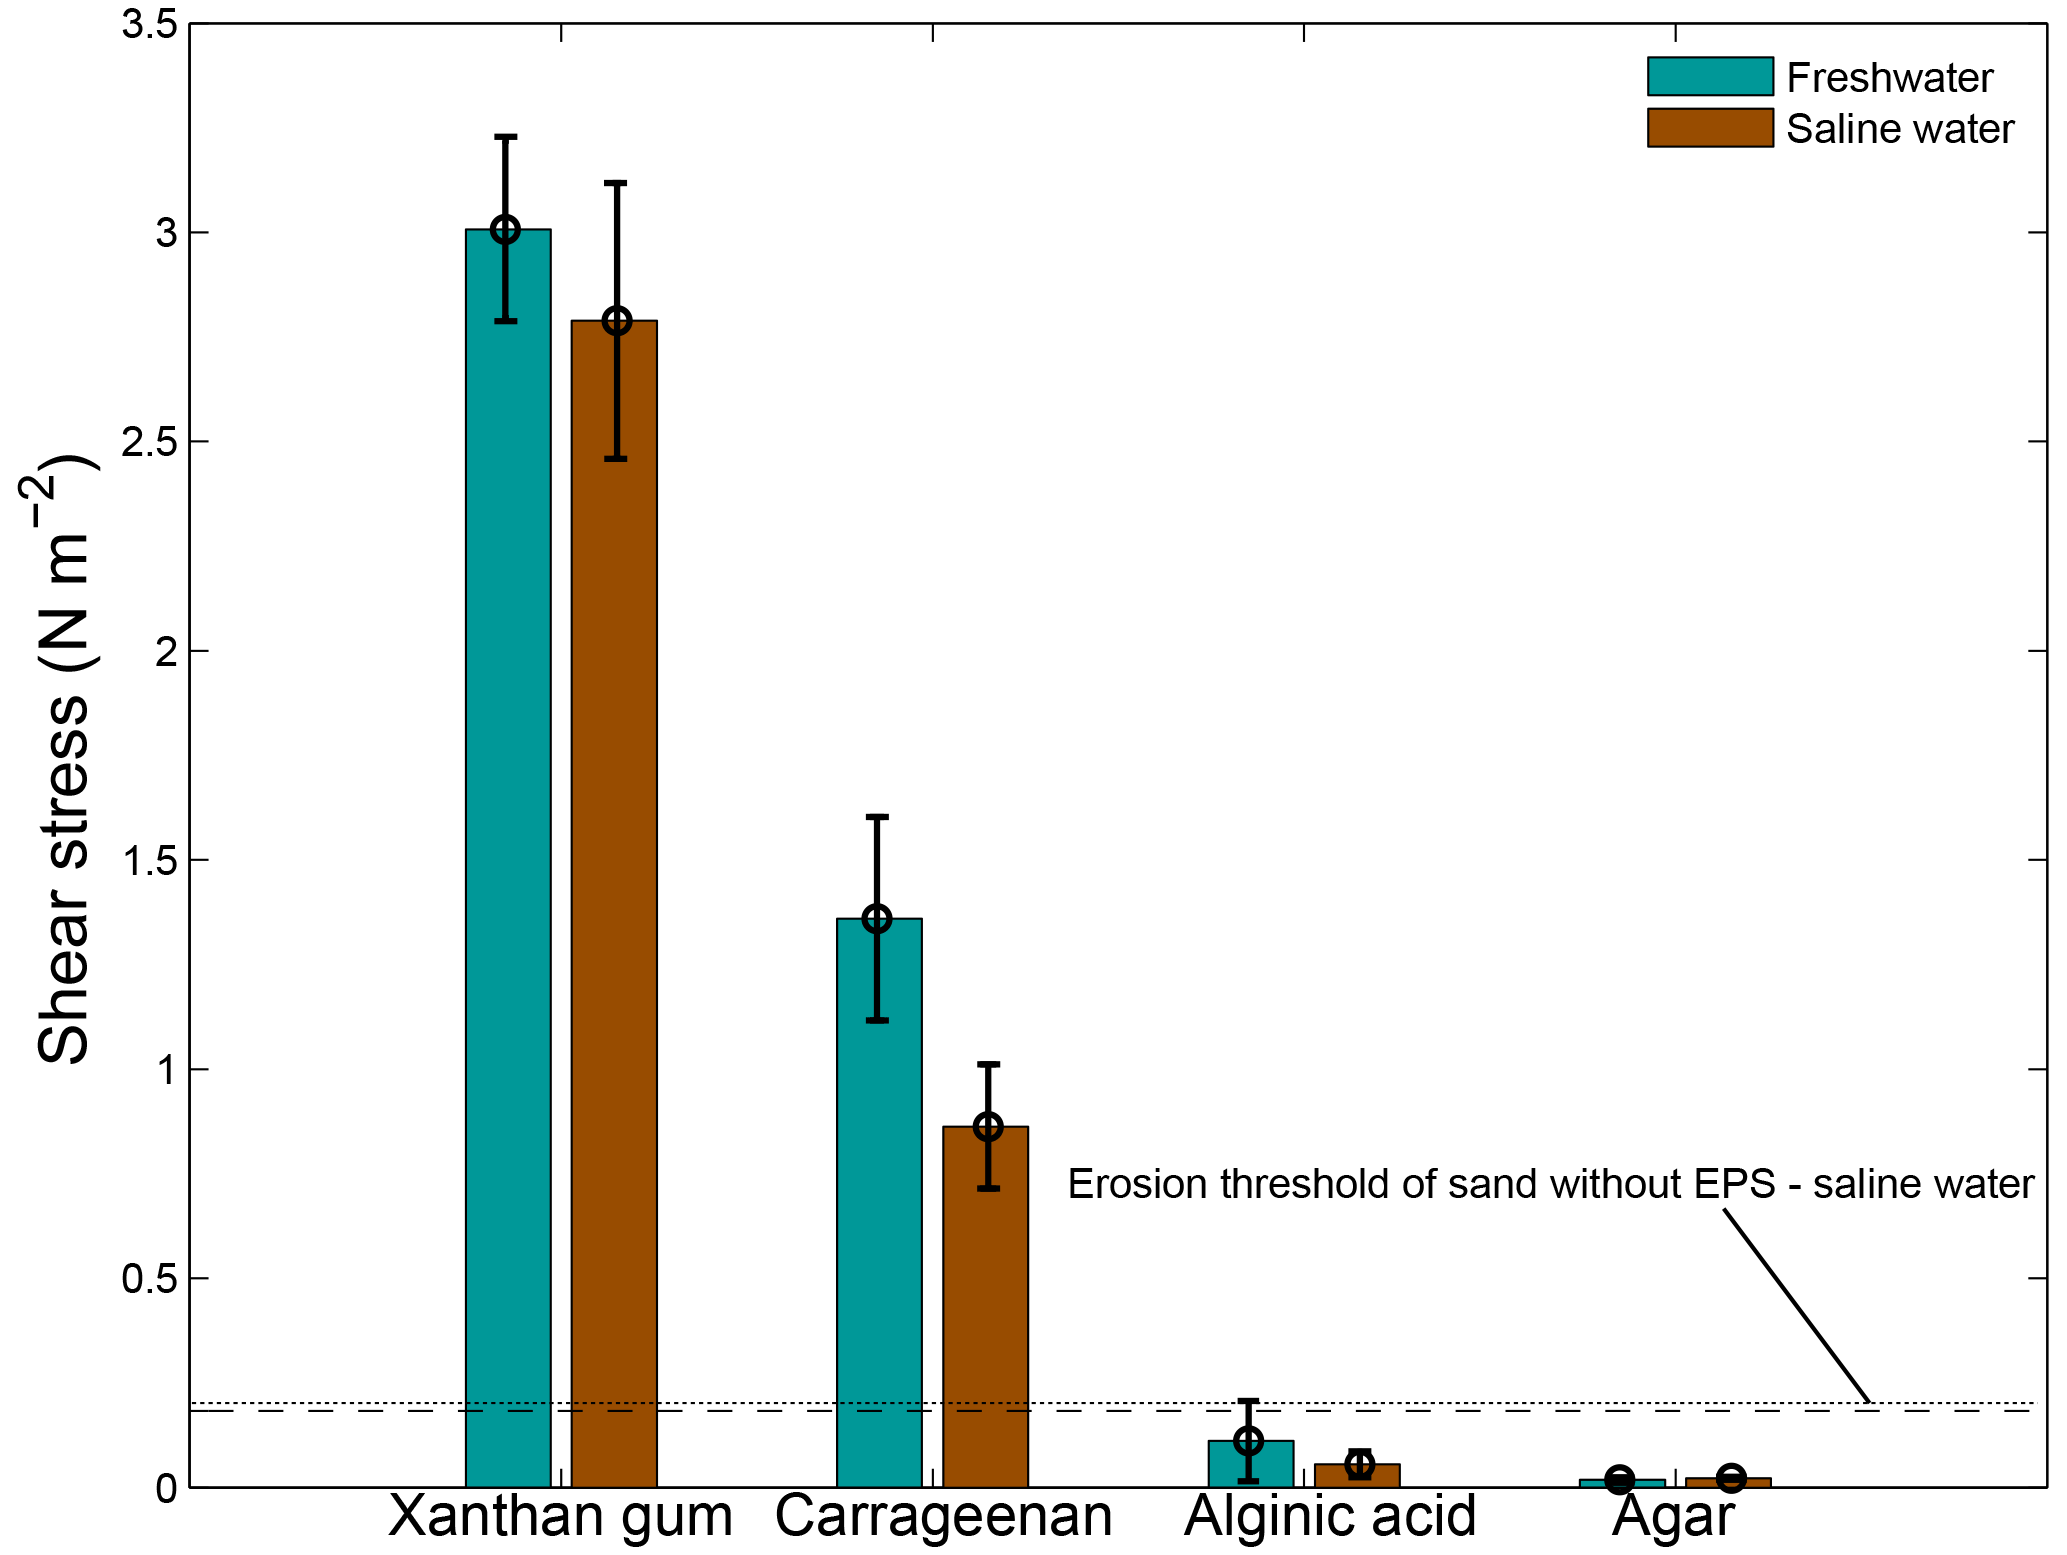
Figure 7The threshold for erosion as a function of salinity for four extracted EPSs as measured with the CSM erosion device. Distilled water was used for the freshwater tests and a salinity of 30 ppt was used for the saline water tests. The horizontal lines correspond to the threshold for erosion of sand without EPSs for freshwater (dashed) and saline water (dotted). Error bars are standard deviations from n = 3 repeat measurements.
3.3.6 Effects of temperature on sediment stability
A lower temperature of 10 ∘C as well as a higher temperature of 40 ∘C resulted in a lower threshold for erosion (Fig. 9). For xanthan gum as well as carrageenan, the threshold for erosion was about halved during 10 and 40 ∘C test conditions compared with 20 ∘C test conditions. The threshold for erosion of alginic acid and agar remained below the threshold for erosion of sand without EPSs independent of the temperature.
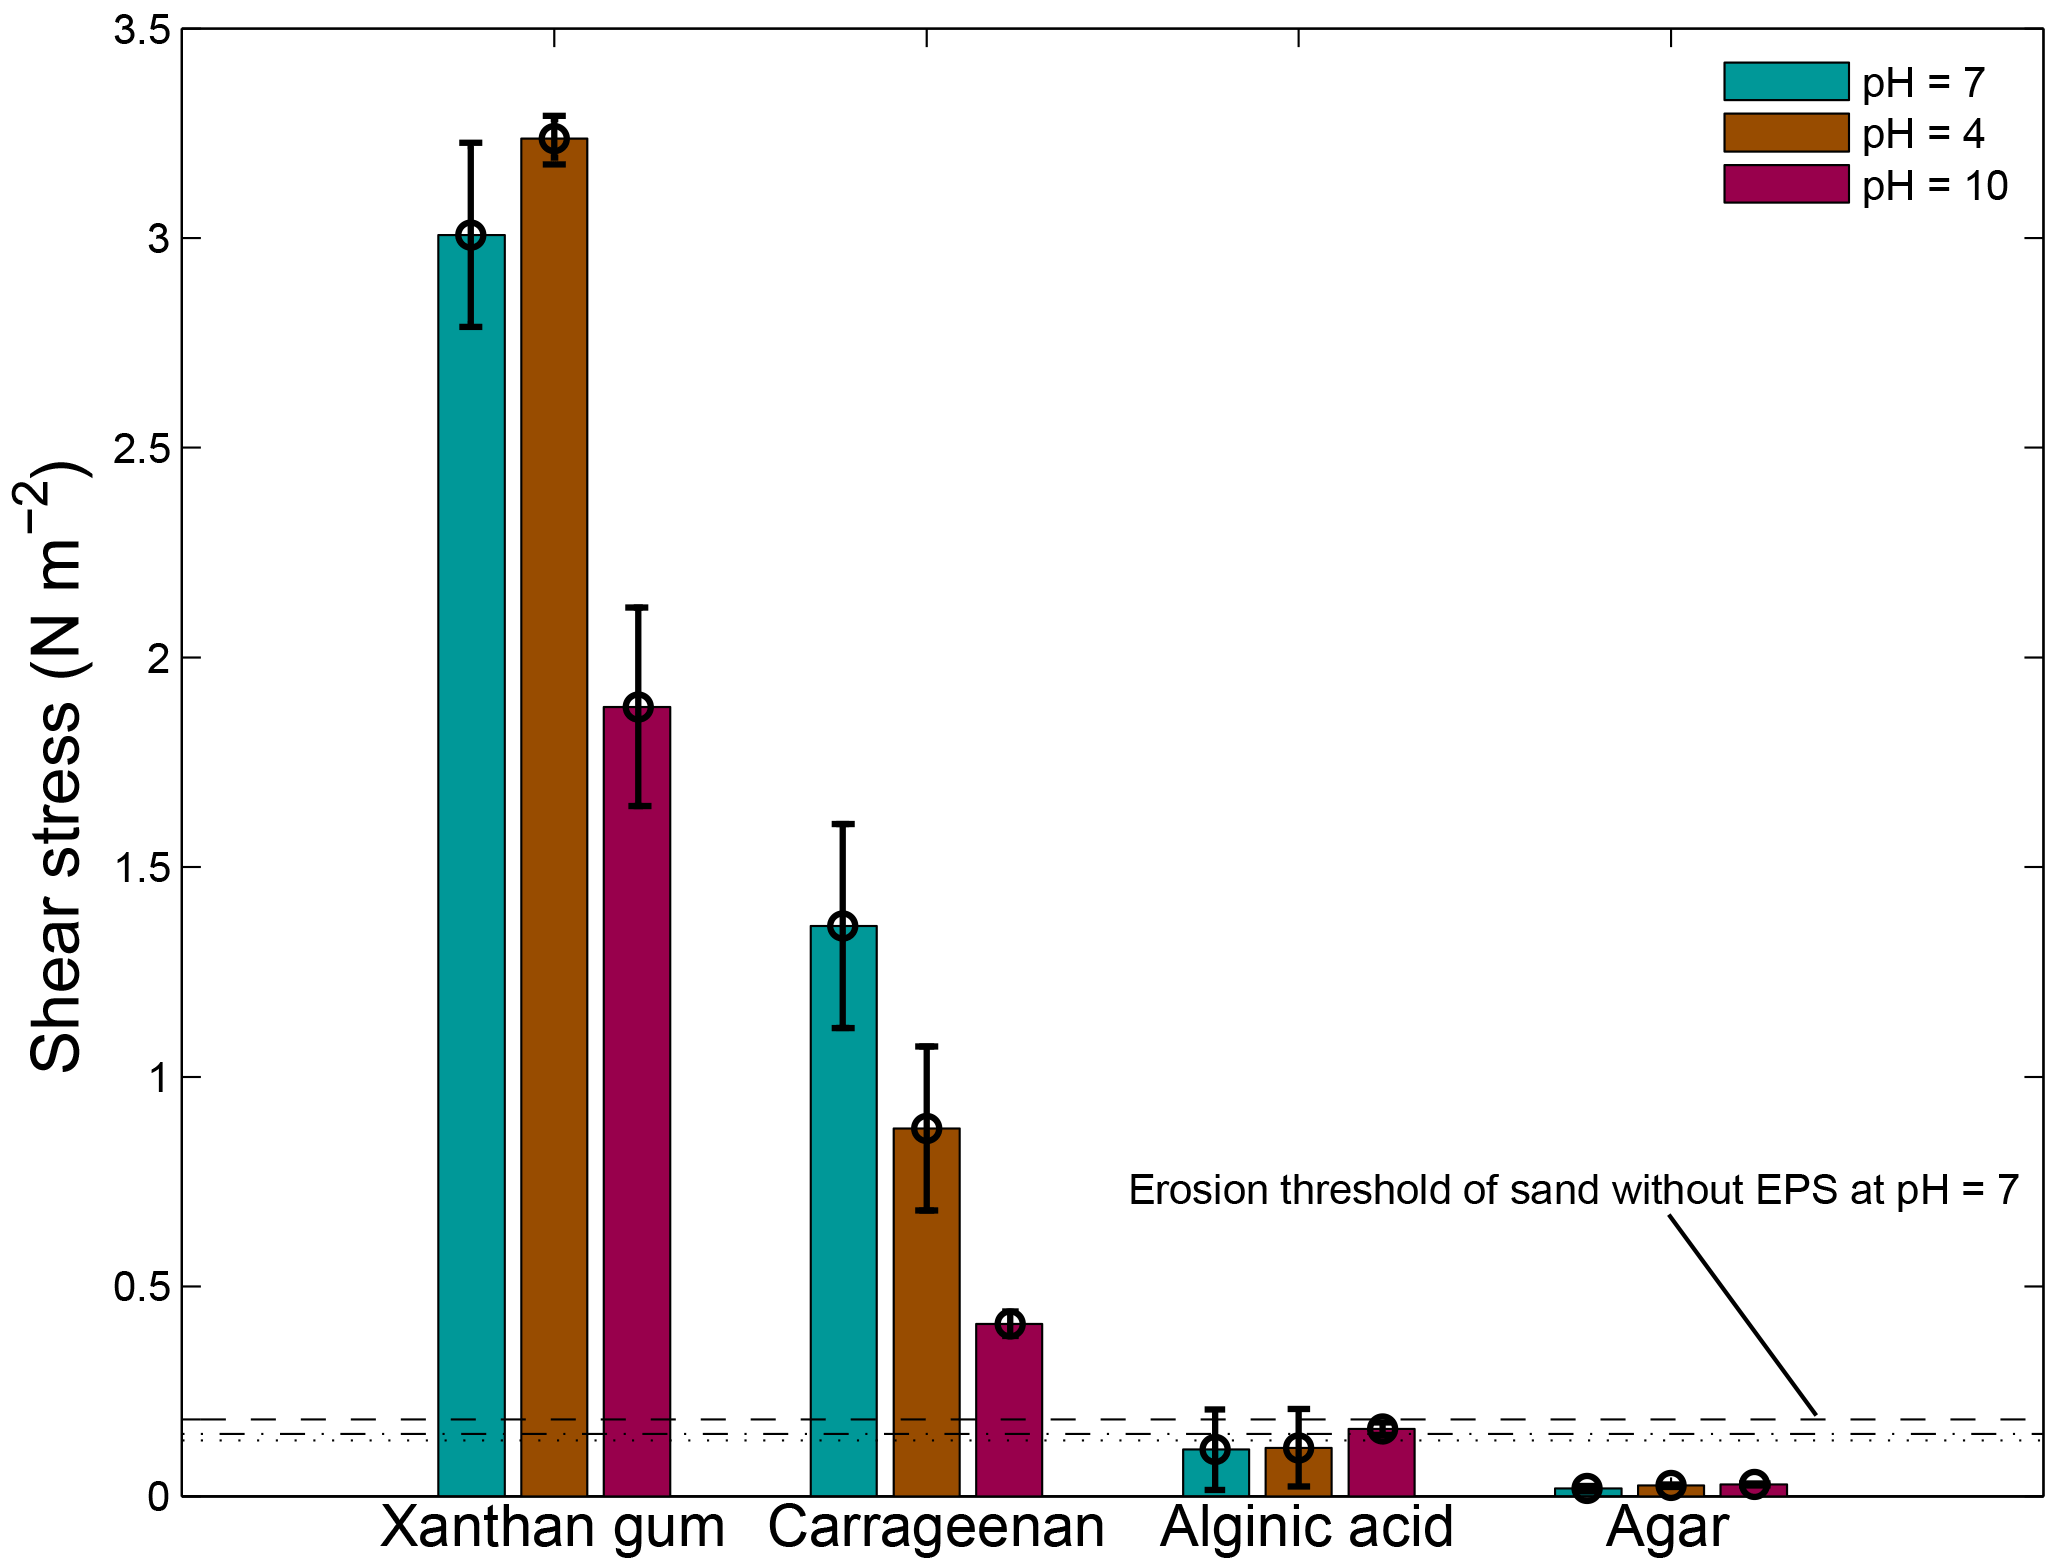
Figure 8The threshold for erosion as a function of pH for four extracted EPSs as measured with the CSM erosion device. The horizontal lines correspond to the threshold for erosion of sand without EPSs for water with a pH of 7 (dashed), a pH of 4 (dotted) and a pH of 10 (dash dotted). Error bars are standard deviations from n = 3 repeat measurements.
3.3.7 Synthesis of the effects of extracted EPSs on sediment stability
In summary, extracted EPSs xanthan gum and carrageenan increased the threshold for erosion with higher EPS content (Table 1). For these two EPSs, the relationship between threshold for erosion and EPS content was linearly and predictable (Fig. 4). In contrast, the extracted EPSs alginic acid and agar did not increase the threshold for erosion (Table 1), independent of the applied concentration (Fig. 4), preparation procedure (Fig. 5) or environmental condition such as salinity, pH and temperature. Yet, this study demonstrated that the preparation procedure, environmental conditions and time impacted on the resultant threshold for erosion of the EPSs xanthan gum and carrageenan. A dry mixing procedure increased the threshold for erosion while saline water, alkaline solutions and non-room-temperature test conditions of 10 and 40 ∘C decreased the threshold for erosion. The tests also showed that the effects of adding xanthan gum and carrageenan on the threshold for erosion ceased to exist after about 2 weeks following initial application (Fig. 6). These findings indicate that the effectiveness of extracted EPSs to stabilise sediment is sensitive to the applied concentration, the preparation procedure, time and environmental conditions.
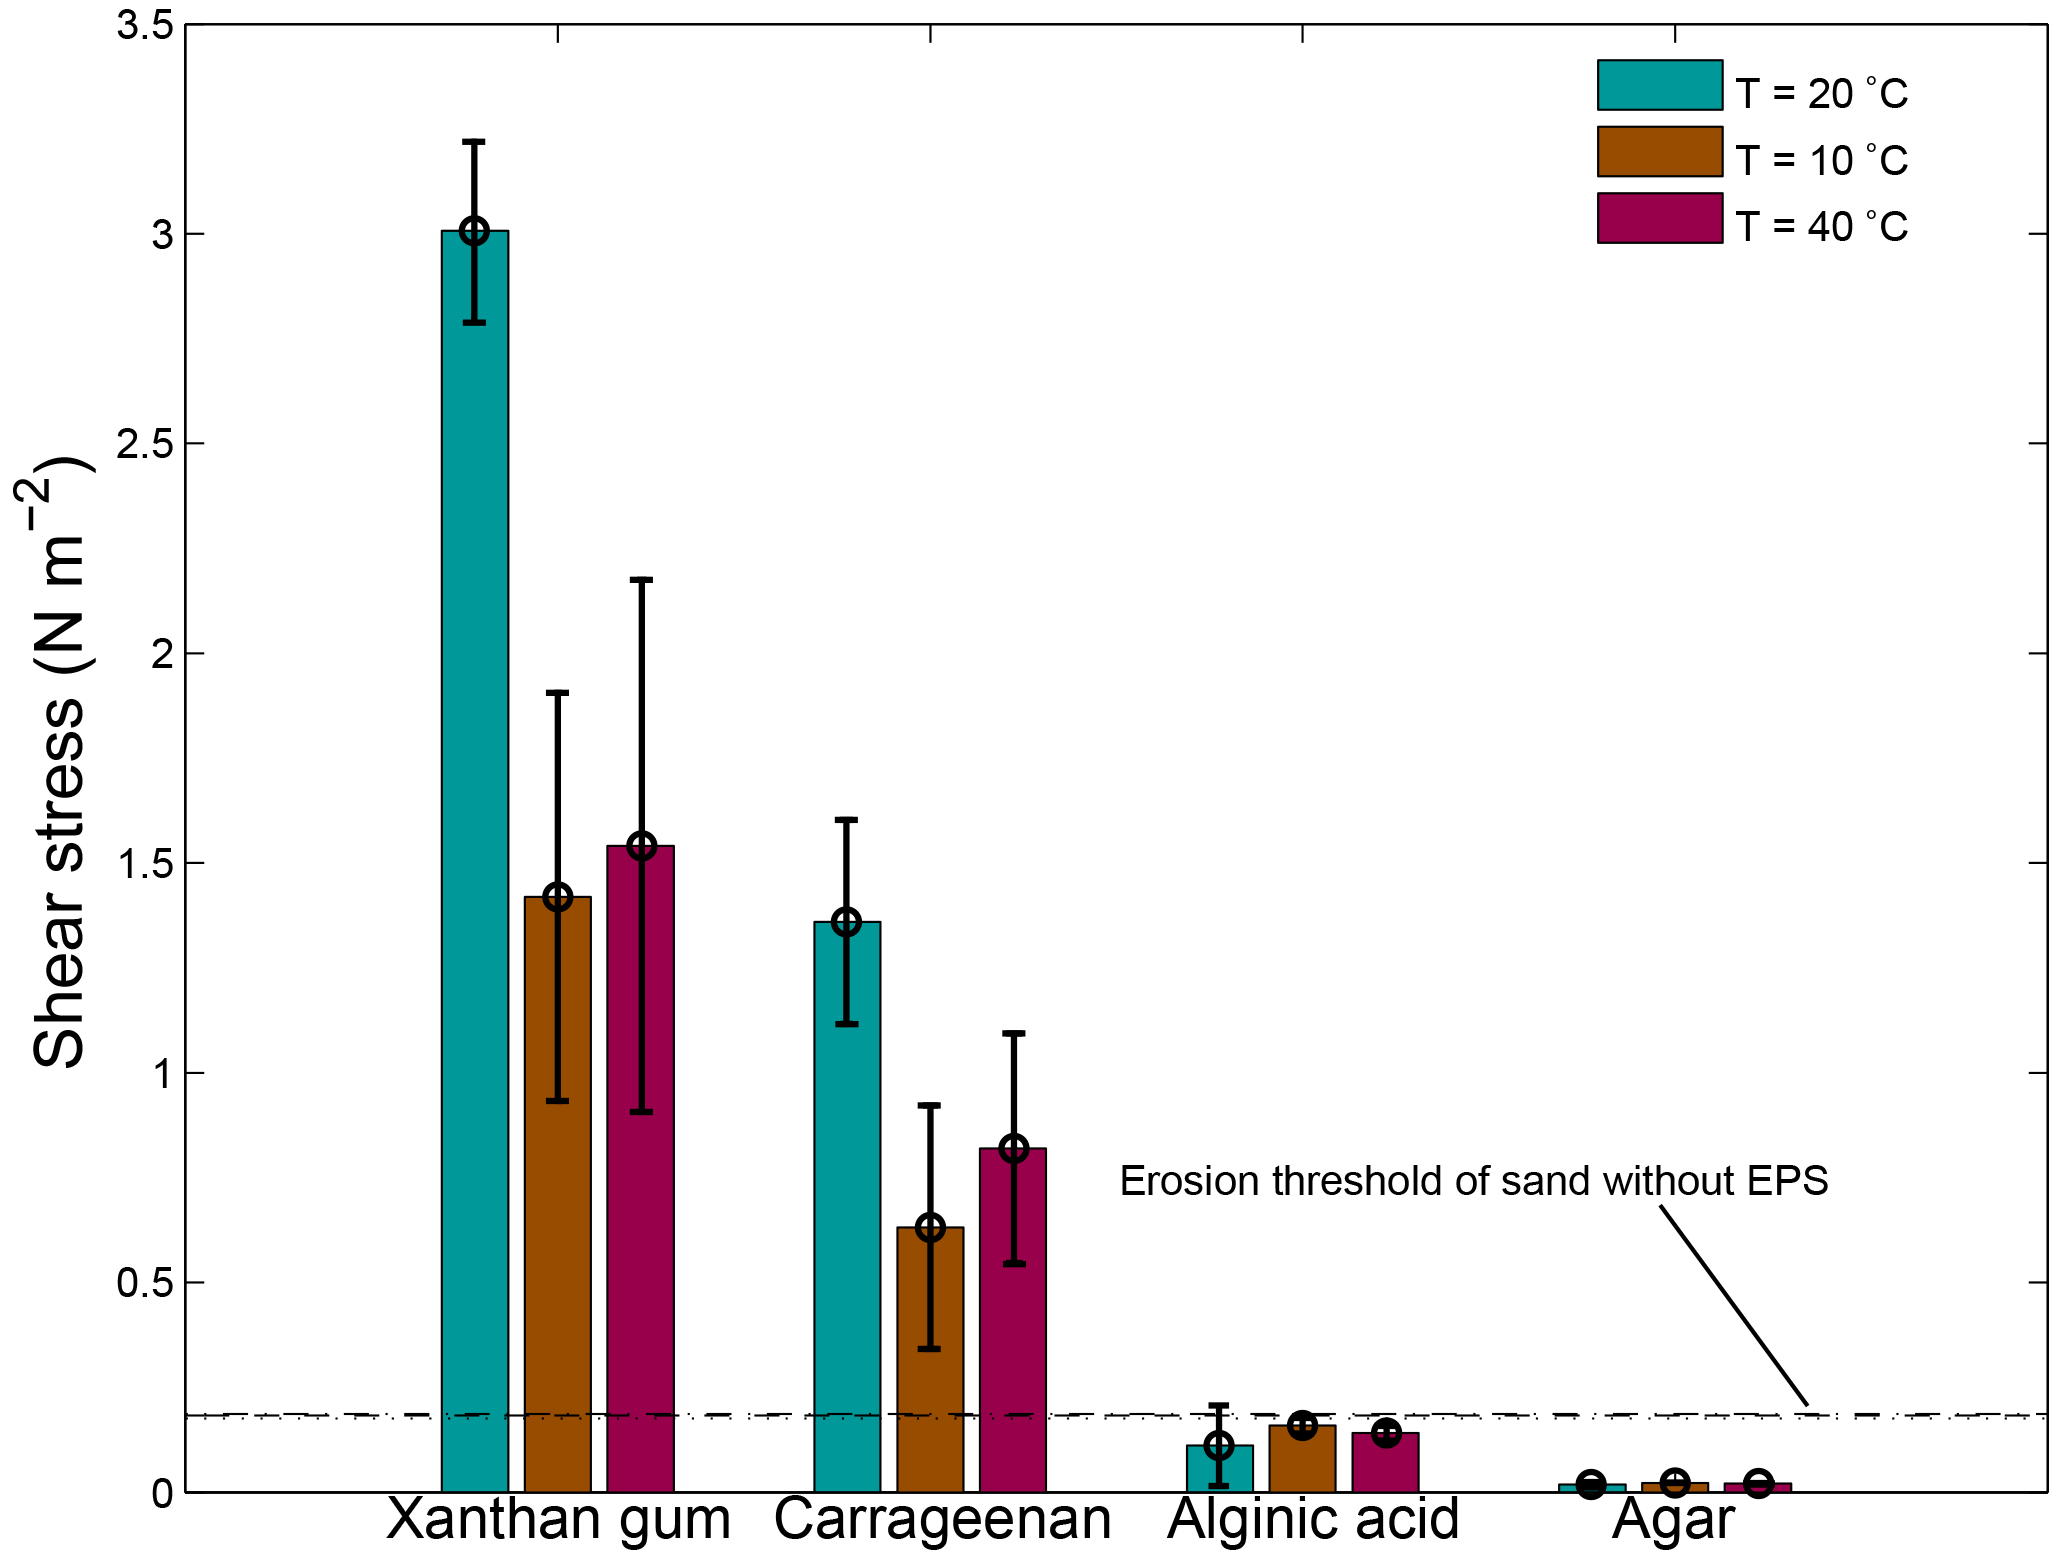
Figure 9The threshold for erosion as a function of temperature for four extracted EPSs as measured with the CSM erosion device. The horizontal lines correspond to threshold for erosion of sand without EPSs for a temperature of 20 ∘C (dashed), a temperature of 10 ∘C (dotted) and a temperature of 40 ∘C (dash dotted). Error bars are standard deviations from n = 3 repeat measurements.
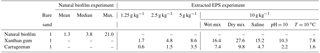
Table 2Biostabilisation index resulting from natural biofilm colonisation and the addition of extracted EPSs xanthan gum and carrageenan to sand.
The CSM data show that addition of extracted EPSs xanthan gum and carrageenan increases the critical threshold for erosion, even at low EPS concentrations (Fig. 4 and Table 1). The observation that the threshold for erosion increased approximately linear with EPS content for xanthan gum is in agreement with the findings reported in Tolhurst et al. (2002). We find a similar linear increase in threshold for erosion with EPS content for carrageenan, though the rate of increase is smaller compared to xanthan gum. The approximately linear relationship between EPS content and threshold for erosion across the measured range for xanthan gum and carrageenan simplifies the prediction of biostabilisation effects due to extracted EPSs. Two other extracted EPSs, alginic acid and agar, were also tested and showed negligible biostabilisation for any of the test conditions investigated.
Biostabilisation of the same sandy substrate due to natural biofilm colonisation and due to addition of extracted EPSs xanthan gum and carrageenan compares well (Table 2). We find a mean biostabilisation index due to natural biofilm colonisation of almost 4 times that of the uncolonised sand. Such a biostabilisation index is within the reported range for fine sand (Dade et al., 1990; Vignaga et al., 2013). More specifically, 42 % of the tested samples did not show biostabilisation compared to uncolonised sand while 10 % of the measurements showed a 10-fold biostabilisation relative to uncolonised sand (Fig. 2). The presented cumulative probability distribution of critical threshold for erosion reflects the large spatial and temporal variations generally seen in natural biostabilised environments (Paterson, 1989; Amos et al., 1998; Tolhurst et al., 1999, 2003; Friend et al., 2003a). For the second set of experiments focusing on extracted EPSs, we find similar biostabilisation indices as observed in the first set of experiments on natural biofilms (Table 2). For xanthan gum, the biostabilisation index of 1.7 for the lowest concentration of 1.25 g kg−1 compares well to the median biostabilisation index of 1.3 in the natural biofilm experiment. The biostabilisation index of 16.4 for the highest concentration of 10 g kg−1 represents the 97th percentile of the biostabilisation index of the natural biofilm experiment and is close to the maximum biostabilisation index of 21. For Carrageen, the biostabilisation indices are generally lower, and the biostabilisation index of 1.5 for the concentration of 2.5 g kg−1 compares well to the median biostabilisation index of 1.3 in the natural biofilm experiment. The biostabilisation index of 3.5 for the concentration of 5 g kg−1 is close to the mean biostabilisation index of 3.8 in the natural biofilm experiment. Xanthan gum may be more suited for replicating the higher biostabilisation observations of natural biofilms due to the higher threshold for erosion of the highest applied concentration of 10 g kg−1. Application of carrageenan may be more appropriate to replicate the lower biostabilisation observations of natural biofilms due to the small effect on the threshold for erosion of low concentrations.
The concentrations of the EPSs derived from the natural biofilm experiment (Fig. 3, ∼ 8 µg g−1) are about 3 orders of magnitude lower than the applied extracted EPS concentrations (2.5–10 mg g−1) to achieve the same biostabilisation effect (Table 2). Two reasons may explain these differences. First, the applied phenol–sulfuric acid assay only measures a carbohydrate fraction of the total EPSs as well as some low-weight sugars that are extracted with the polymeric material (Underwood et al., 1995). As a result, this technique may not measure all of the EPSs present in the sample and is also known to be sensitive to a host of conditions (Perkins et al., 2004). Second, sediment sampling for EPS concentration analysis typically involved scraping off the top centimetre of the substrate. However, it has been shown that EPS content in nature is highest at the sediment surface (top 200 µm) and decreases with depth (Taylor and Paterson, 1998). Our sediment sampling strategy is likely to have diluted the EPS concentration, which may offer another explanation for the lower EPS concentrations in the natural biofilm samples.
Erosion profiles for low concentrations of extracted xanthan gum and carrageenan are similar to those measured from the natural biostabilised sediments (Fig. 10). For higher concentrations of carrageenan and particularly xanthan gum, the erosion rate is reduced relative to the natural biostabilised samples. In contrast to the natural samples where EPS concentration decreases with depth (Taylor and Paterson, 1998), the extracted EPSs were mixed homogenously with depth in this study. As a consequence, the erosion rate for high concentrations of extracted EPSs has been reduced more than would be found under natural conditions. To overcome this, and to better replicate natural biofilm-mediated erosion behaviour, it may be more appropriate to apply extracted EPSs only on the surface in future studies. This will result in the highest EPS concentrations at the sediment surface that decrease with depth depending on the porosity and saturation of the substrate.
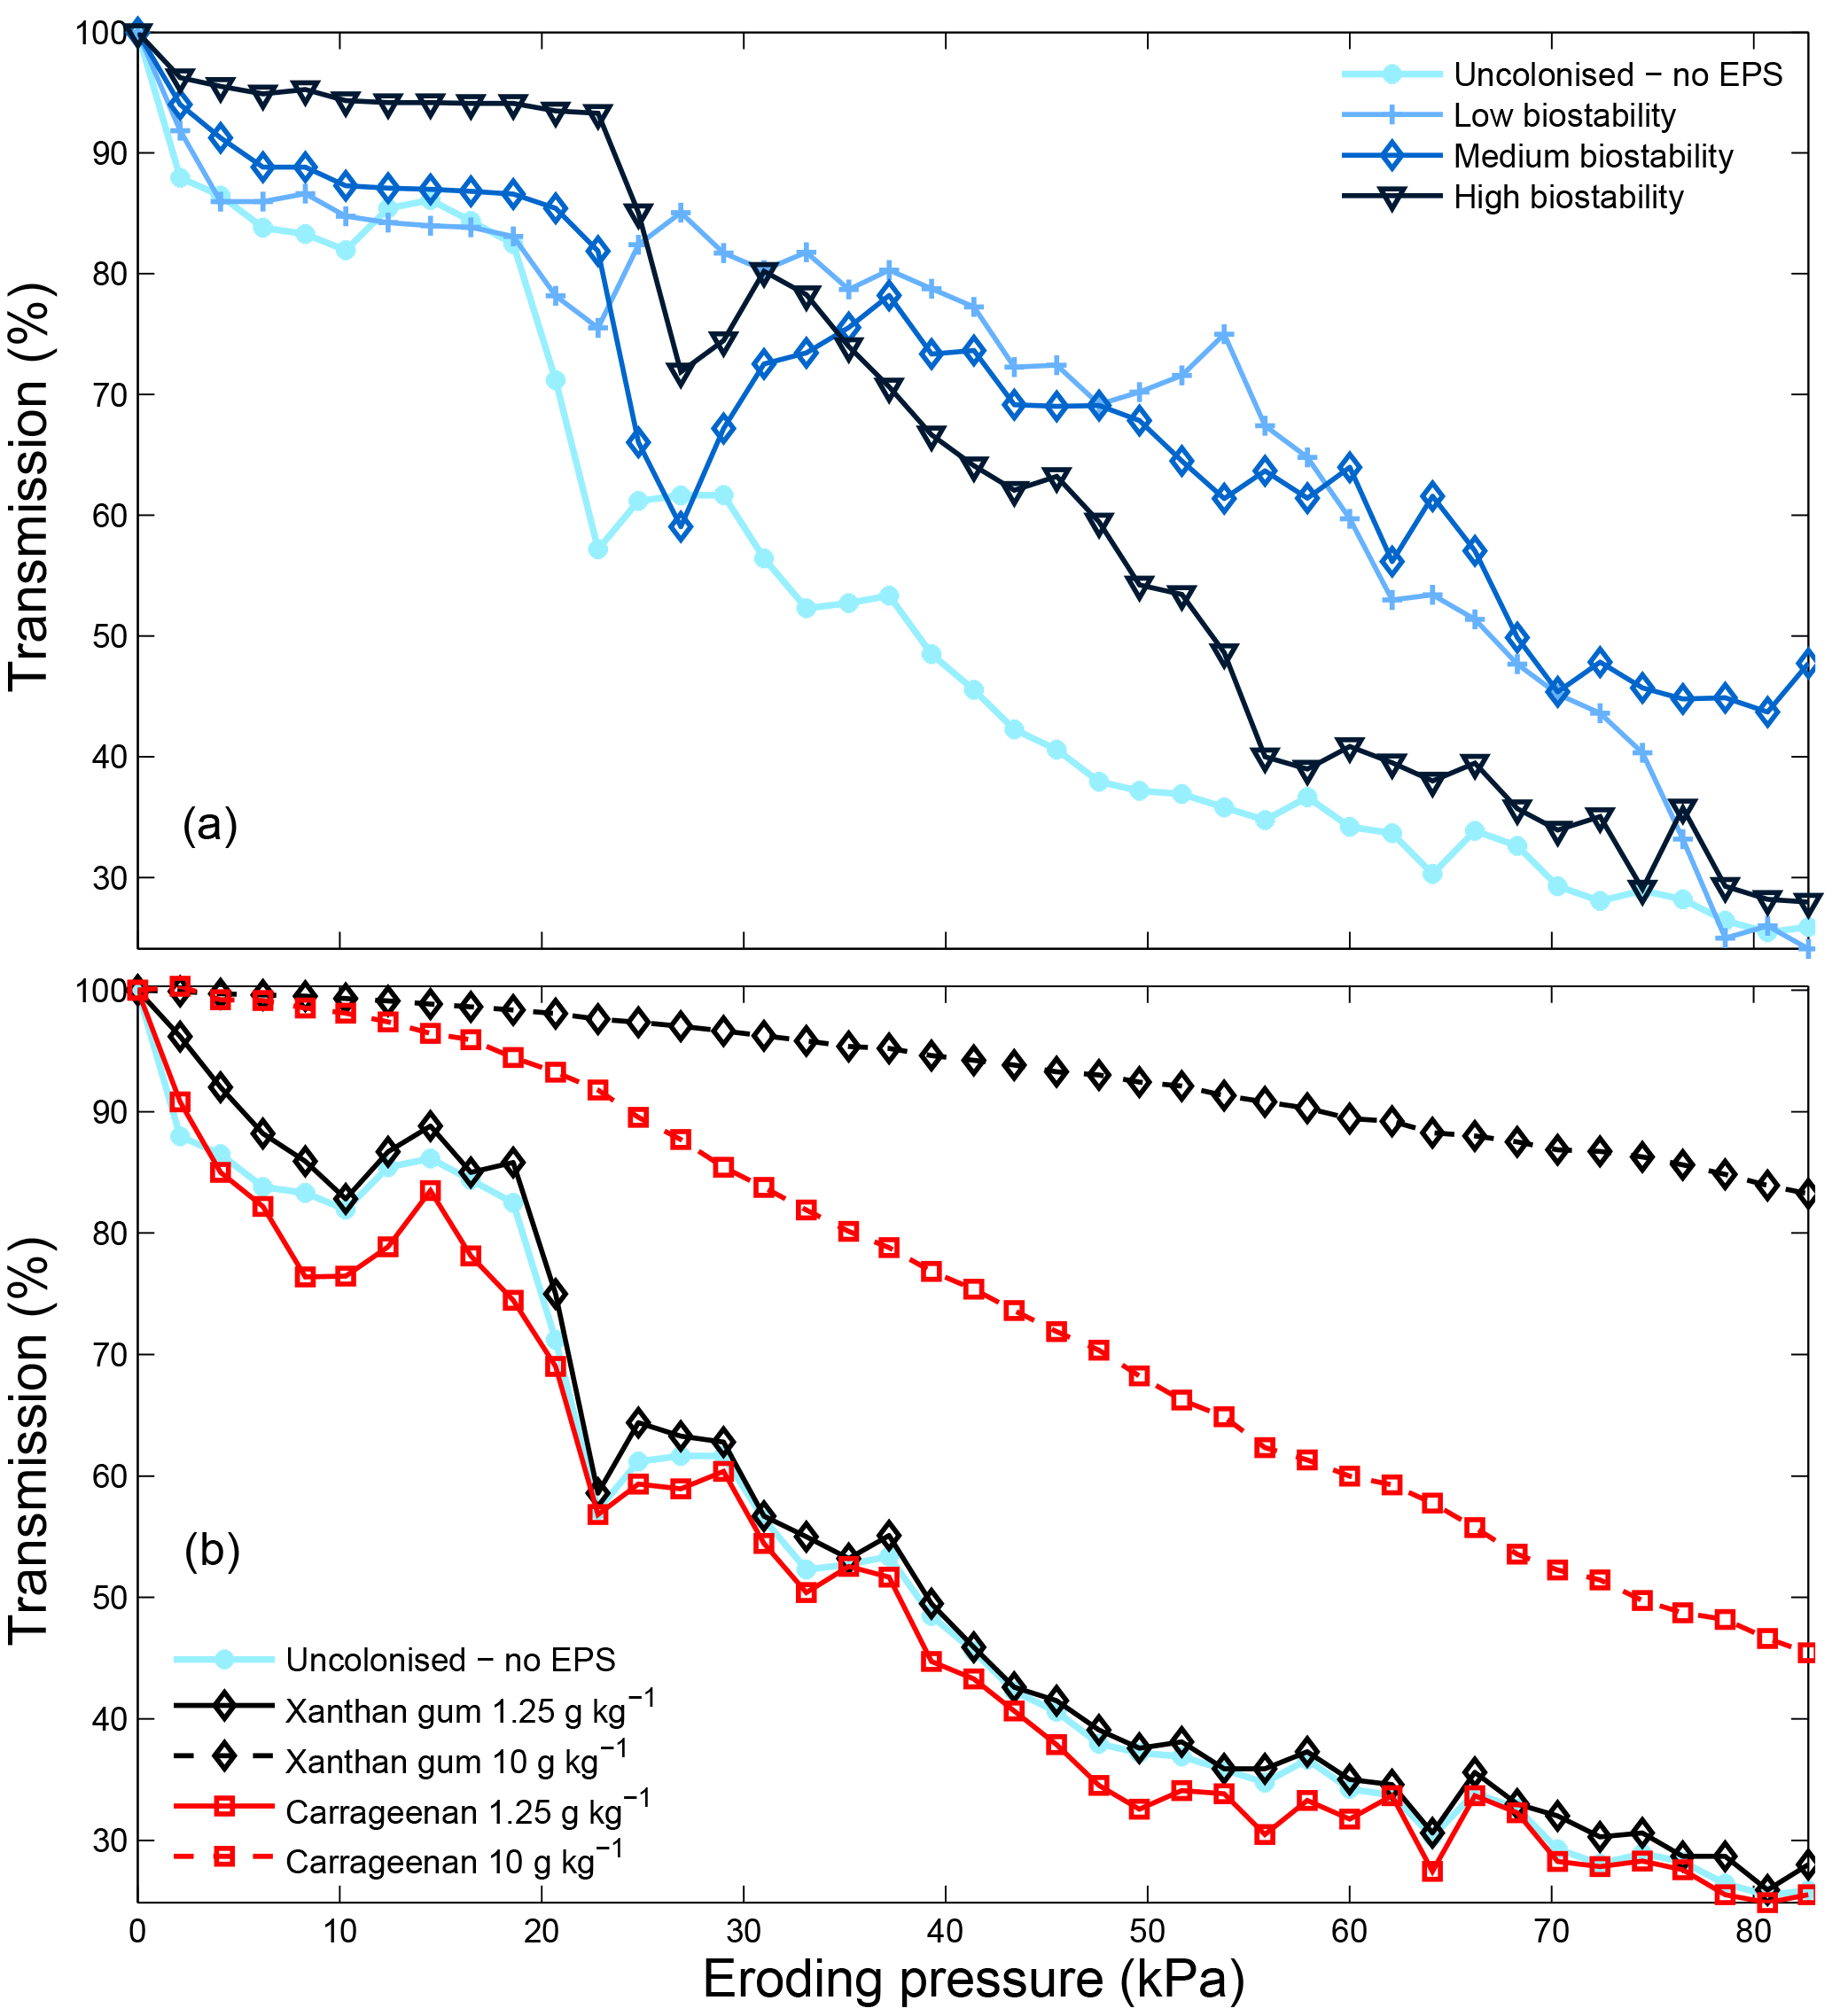
Figure 10CSM erosion profiles for sediment with different degrees of biostability due to natural biofilm colonisation (a) and due to different extracted EPS xanthan gum and carrageenan contents (b). Following Tolhurst et al. (1999), the eroding pressure corresponding to a 90 % transmission is defined as the erosion event.
The methodologies described herein for preparing engineered sediments and the resultant biostabilisation may serve as protocols to guide the design of future studies that aim to represent biological cohesion. In essence, biostabilisation effects of extracted EPSs xanthan gum and carrageenan behave linearly (Fig. 4) and are therefore predictable. Different concentrations of these extracted EPSs may be used to replicate the temporal and spatial variations generally seen in biostabilisation due to natural biofilm colonisation. Other than biostabilisation, no differences in application or behaviour between xanthan gum and carrageen were observed in this study. Furthermore, the sensitivity analysis performed in this study showed that the effectiveness of xanthan gum and carrageenan for the stabilisation of sediment not only depends on the applied concentration but is also is sensitive to the preparation procedure, time after application and environmental conditions. The results for the time elapsed after initial application tests were obtained for samples that dried out between measurements. Temporal behaviour of extracted EPSs may be different when the engineered sediments remain wet for the duration of the test, which requires further research. The sensitivity of engineered sediments to salinity, pH and temperature found in this study indicates that a high level of control of these environmental variables is required for reliable application of extracted EPSs in flume facilities.
Physical modelling of the complex flow, sediment transport and ecological interactions within aquatic ecosystems is key to bridge the divide between field observations and numerical models (Thomas et al., 2014; Gerbersdorf and Wieprecht, 2015). The implementation of biological processes into sediment transport equations that have traditionally been modelled as abiotic systems is expected to result in better predictions of sediment dynamics (Black et al., 2002; Righetti and Lucarelli, 2007; Gerbersdorf et al., 2011; Parsons et al., 2016). Our study confirms that extracted EPSs xanthan gum and carrageenan are not perfect analogues of natural biofilms (Perkins et al., 2004), but they are capable of introducing realistic biological cohesion into flume facilities in a fast and controlled manner for a range of commonly used conditions. The reduction in experimental time here is significant since the maximum biostabilisation effects of natural biofilm can easily take 5 weeks or more to achieve, whereas extracted EPSs can be introduced at the same time as the sediment minimising time to set up an experiment. Similarly growth patterns, particularly the effect of increasing biostabilisation, can easily be reproduced in a stepwise manner by introducing greater concentrations of the extracted EPSs. Although this study has focused on replicating one aspect of natural biofilm behaviour only, future physical modelling studies employing extracted EPSs may provide important insights into the role of biological cohesion in sediment dynamics and how these may be altered in a changing climate.
This study aimed to evaluate biostabilisation effects of existing extracted EPSs for a range of conditions commonly used in physical modelling experiments. Four extracted EPSs were tested, and addition of xanthan gum and carrageenan increased the threshold for erosion, while the addition of alginic acid and agar did not increase the threshold for erosion for all test conditions. Changes in threshold for erosion produced by the addition of extracted EPSs xanthan gum and carrageenan compared well to measured threshold for erosion resulting from natural biofilm colonisation of the same sandy substrate. The increase of the threshold for erosion with EPS content is linear and predictable for xanthan gum and carrageenan, albeit with a lower rate of increase for carrageenan. Furthermore, the effectiveness of xanthan gum and carrageenan to stabilise sediment is sensitive to the preparation procedure, time after application and environmental conditions such as salinity, pH and temperature. The methodologies for preparing engineered sediments described in this paper can provide quantifiable biostabilisation effects and may be used as protocols for designing future biophysical experimental models that seek to represent biological cohesion. This approach will bring the significant advantages of being fast, replicable and controllable, which will improve experimental efficiency and enable experiments that explore a larger parameter space to be undertaken at lower cost.
The data for this publication are available via the Zenodo Hydralab+ digital repository at https://doi.org/10.5281/zenodo.1198991 (van de Lageweg et al., 2018). The data contain (1) CSM measurements of natural biofilm samples, (2) CSM measurements of extracted EPS samples, (3) EPS content measurements of natural biofilms samples and (4) photos of the natural biofilm experiment.
The authors contributed in the following proportions to conception and design, data collection, analysis and conclusions, and manuscript preparation: WIvdL (40, 80, 70, 70 %), SJM (40, 20, 20, 20 %) and DRP (20, 0, 10, 10 %).
The authors declare that they have no conflict of interest.
Wietse I. van de Lageweg, Stuart J. McLelland and Daniel R. Parsons were supported by the European
Community's Horizon 2020 Programme through the grant to the budget of the
Integrated Infrastructure Initiative HYDRALAB+, contract no. 654110. We
thank Steve Darby and Chris Hackney from the University of Southampton for
the generous loan of the CSM; Jane Reed for species ecology determination;
Laura Jordan, Bas Bodewes and Robert Houseago for their help with laboratory
work; and Brendan Murphy and Mark Anderson for technical support.
Edited by: Rebecca Hodge
Reviewed by: Trevor Tolhurst and one anonymous referee
Amos, C. L., Brylinsky, M., Sutherland, T. F., O'Brien, D., Lee, S., and Cramp, A.: The Stability of a Mudflat in the Humber Estuary, South Yorkshire, UK, Geological Society, London, Special Publications, 139, 25–43, https://doi.org/10.1144/GSL.SP.1998.139.01.03, 1998.
Augspurger, C. and Küsel, K.: Flow Velocity and Primary Production Influences Carbon Utilization in Nascent Epilithic Stream Biofilms, Aquat. Sci., 72, 237–243, https://doi.org/10.1007/s00027-009-0126-y, 2010.
Bhaskar, P. V. and Bhosle, N. B.: Bacterial Extracellular Polymeric Substance
(EPS): A Carrier of Heavy Metals in the Marine Food-Chain, Environ. Int., 32,
191–98,
doi10.1016/j.envint.2005.08.010, 2006.
Black, K. S., Tolhurst, T. J., Paterson, D. M., and Hagerthey, S. E.: Working with Natural Cohesive Sediments, J. Hydraul. Eng., 128, 2–8, https://doi.org/10.1061/(ASCE)0733-9429(2002)128:1(1), 2002.
Chenu, C. and Guérif, J.: Mechanical Strength of Clay Minerals as Influenced by an Adsorbed Polysaccharide, Soil Sci. Soc. Am. J., 55, 1076, https://doi.org/10.2136/sssaj1991.03615995005500040030x, 1991.
Dade, W. B., Davis, J. D., Nichols, P. D., Nowell, A. R. M., Thistle, D., Trexler, M. B., and White, D. C.: Effects of Bacterial Exopolymer Adhesion on the Entrainment of Sand, Geomicrobiol. J., 8, 1–16, https://doi.org/10.1080/01490459009377874, 1990.
Decho, A. W.: Microbial Exopolymer Secretions in Ocean Environments: Their Role (S) in Food Webs and Marine Processes, Oceanogr. Mar. Biol. Annu. Rev., 28, 73–153, 1990.
de Vriend, H. J., van Koningsveld, M., Aarninkhof, S. G. J., de Vries, M. B., and Baptist, M. J.: Sustainable Hydraulic Engineering through Building with Nature, J. Hydro-Environ. Res., 9, 159–171, https://doi.org/10.1016/j.jher.2014.06.004, 2015.
Droppo, I. G., Ross, N., Skafel, M., and Liss. S. N.: Biostabilization of Cohesive Sediment Beds in a Freshwater Wave-Dominated Environment, Limnol. Oceanogr., 52, 577–89, 2007.
Dubois, M., Gilles, K. A., Rebers, P. A., and Smith, F.: Colorimetric Method for Determination of Sugars and Related Substances., Anal. Chem., 28, 350–356, 1956.
Flemming, H.: The Perfect Slime, Colloid. Surface. B, 86, 251–59, https://doi.org/10.1016/j.colsurfb.2011.04.025, 2011.
Flemming, H. and Wingender, J.: The Biofilm Matrix, Nat. Rev. Microbiol., 8, 623–633, https://doi.org/10.1038/nrmicro2415, 2010.
Friend, P. L., Ciavola, P., Cappucci, S., and Santos, R.: Bio-Dependent Bed Parameters as a Proxy Tool for Sediment Stability in Mixed Habitat Intertidal Areas, Cont. Shelf Res., 23, 1899–1917, https://doi.org/10.1016/j.csr.2002.12.001, 2003a.
Friend, P. L., Collins, M. B., and Holligan, P. M.: Day–night Variation of Intertidal Flat Sediment Properties in Relation to Sediment Stability, Estuarine, Coast. Shelf Sci., 58, 663–675, https://doi.org/10.1016/S0272-7714(03)00178-1, 2003b.
Gerbersdorf, S. U. and Wieprecht, S.: Biostabilization of Cohesive Sediments: Revisiting the Role of Abiotic Conditions, Physiology and Diversity of Microbes, Polymeric Secretion, and Biofilm Architecture, Geobiology, 13, 68–97, https://doi.org/10.1111/gbi.12115, 2015.
Gerbersdorf, S. U., Hollert, H., Brinkmann, M., Wieprecht, S., Schüttrumpf, H., and Manz, W.: Anthropogenic Pollutants Affect Ecosystem Services of Freshwater Sediments: The Need for a `triad plus X' Approach, J. Soil. Sediment., 11, 1099–1114, https://doi.org/10.1007/s11368-011-0373-0, 2011.
Graba, M., Sauvage, S., Moulin, F. Y., Urrea, G., Sabater, S., and Sanchez-Pérez, J. M.: Interaction between Local Hydrodynamics and Algal Community in Epilithic Biofilm, Water Res., 47, 2153–2163, https://doi.org/10.1016/j.watres.2013.01.011, 2013.
Hoyal, D. C. J. D. and Sheets, B. A.: Morphodynamic Evolution of Experimental Cohesive Deltas, J. Geophys. Res., 114, F02009, https://doi.org/10.1029/2007JF000882, 2009.
Kleinhans, M. G., van Dijk, W. M., van de Lageweg, W. I., Hoyal, D. C. J. D., Markies, H., van Maarseveen, M., Roosendaal, C., van Weesep, W., van Breemen, D., Hoendervoogt, R., and Cheshier, N.: Quantifiable Effectiveness of Experimental Scaling of River- and Delta Morphodynamics and Stratigraphy, Earth Sci. Rev., 133, 43–61, https://doi.org/10.1016/j.earscirev.2014.03.001, 2014.
Kornman, B. A. and De Deckere, E. M. G. T.: Temporal Variation in Sediment Erodibility and Suspended Sediment Dynamics in the Dollard Estuary, Geological Society, London, Special Publications, 139, 231–241, https://doi.org/10.1144/GSL.SP.1998.139.01.19, 1998.
Ledger, M. E., Harris, R. M. L., Armitage, P. D., and Milner, A. M.: Disturbance Frequency Influences Patch Dynamics in Stream Benthic Algal Communities, Oecologia, 155, 809–819, https://doi.org/10.1007/s00442-007-0950-5, 2008.
Malarkey, J., Baas, J. H., Hope, J. A., Aspden, R. J., Parsons, D. R., Peakall, J., Paterson, D. M., Schindler, R. J., Ye, L., Lichtman, I. D., and Bass, S. J.: The Pervasive Role of Biological Cohesion in Bedform Development, Nat. Commun., 6, 6257, https://doi.org/10.1038/ncomms7257, 2015.
Manzenrieder, H.: Retardation of initial erosion under biological effects in sandy tidal flats, Leichtweiss, Inst. Tech. Univ., Braunschweig, Germany, 469–479, 1983.
Noffke, N. and Paterson, D. M.: Microbial Interactions with Physical Sediment Dynamics, and Their Significance for the Interpretation of Earth's Biological History, Geobiology, 6 , 1–4, https://doi.org/10.1111/j.1472-4669.2007.00132.x, 2007.
Pan, Y., Herlihy, A., Kaufmann, P., Wigington, J., van Sickle, J., and Moser, T.: Linkages among Land-Use, Water Quality, Physical Habitat Conditions and Lotic Diatom Assemblages: A Multi-Spatial Scale Assessment, Hydrobiologia, 515, 59–73, https://doi.org/10.1023/B:HYDR.0000027318.11417.e7, 2004.
Parsons, D. R., Schindler, R. J., Hope, J. A., Malarkey, J., Baas, J. H., Peakall, J., Manning, A. J., Ye, L., Simmons, S., Paterson, D. M., and Aspden, R. J.: The Role of Biophysical Cohesion on Subaqueous Bed Form Size, Geophys. Res. Lett., 43, 1566–1573, https://doi.org/10.1002/2016GL067667, 2016.
Passow, U.: Transparent Exopolymer Particles (TEP) in Aquatic Environments, Prog. Oceanogr., 55, 287–333, https://doi.org/10.1016/S0079-6611(02)00138-6, 2002.
Passy, S. I.: Spatial Paradigms of Lotic Diatom Distribution: A Landscape Ecology Perspective, J. Phycol., 37, 370–78, https://doi.org/10.1046/j.1529-8817.2001.037003370.x, 2001.
Paterson, D. M.: Short-Term Changes in the Erodibility of Intertidal Cohesive Sediments Related to the Migratory Behavior of Epipelic Diatoms, Limnol. Oceanogr., 34, 223–234, https://doi.org/10.4319/lo.1989.34.1.0223, 1989.
Paterson, D. M.: Biological Mediation of Sediment Erodibility: Ecology and Physical Dynamics, in: Cohesive Sediments, John Wiley, Chichester, UK, 215–229, 1997.
Paterson, D. M., Aspden, R. J., Visscher, P. T., Consalvey, M., Andres, M. S., Decho, A. W., Stolz, J., and Reid, R. P.: Light-Dependant Biostabilisation of Sediments by Stromatolite Assemblages., PLoS ONE, 3, e3176, https://doi.org/10.1371/journal.pone.0003176, 2008.
Perkins, R. G., Paterson, D. M., Sun, H., Watson, J., and Player, M. A.: Extracellular Polymeric Substances: Quantification and Use in Erosion Experiments, Cont. Shelf Res., 24, 1623–1635, https://doi.org/10.1016/j.csr.2004.06.001, 2004.
Righetti, M. and Lucarelli, C.: May the Shields Theory Be Extended to Cohesive and Adhesive Benthic Sediments?, J. Geophys. Res., 112, C05039, https://doi.org/10.1029/2006JC003669, 2007.
Ros, M. D., Marín-Murcia, J. P., and Aboal, M.: Biodiversity of Diatom Assemblages in a Mediterranean Semiarid Stream: Implications for Conservation, Mar. Freshwater Res., 60, 14–24, https://doi.org/10.1071/MF07231, 2009.
Schmidt, H., Thom, M., King, L., Wieprecht, S., and Gerbersdorf, S. U.: The Effect of Seasonality upon the Development of Lotic Biofilms and Microbial Biostabilisation, Freshwater Biol., 61, 963–978, https://doi.org/10.1111/fwb.12760, 2016.
Sutherland, T. F., Amos, C. L., and Grant, J.: The Effect of Buoyant Biofilms on the Erodibility of Sublittoral Sediments of a Temperate Microtidal Estuary, Limnol. Oceanogr., 43, 225–235, https://doi.org/10.4319/lo.1998.43.2.0225, 1998.
Taylor, I. S. and Paterson, D. M.: Microspatial Variation in Carbohydrate Concentrations with Depth in the Upper Millimetres of Intertidal Cohesive Sediments, Estuar. Coast. Shelf Sci., 46, 359–370, https://doi.org/10.1006/ecss.1997.0288, 1998.
Taylor, I. S., Paterson, D. M., and Mehlert, A.: The Quantitative Variability and Monosaccharide Composition of Sediment Carbohydrates Associated with Intertidal Diatom Assemblages, Biogeochemistry, 45, 303–327, https://doi.org/10.1007/BF00993005, 1999.
Temmerman, S., Meire, P., Bouma, T. J., Herman, P. M. J., Ysebaert, T., and De Vriend, H. J.: Ecosystem-Based Coastal Defence in the Face of Global Change, Nature, 504, 79–83, https://doi.org/10.1038/nature12859, 2013.
Thom, M., Schmidt, H., Gerbersdorf, S. U., and Wieprecht, S.: Seasonal Biostabilization and Erosion Behavior of Fluvial Biofilms under Different Hydrodynamic and Light Conditions, Int. J. Sediment Res., 30, 273–284, https://doi.org/10.1016/j.ijsrc.2015.03.015, 2015.
Thomas, R. E., Johnson, M. F., Frostick, L. E., Parsons, D. R., Bouma, T. J., Dijkstra, J. T., Eiff, O., Gobert, S., Henry, P. Y., Kemp, P., and Mclelland, S. J.: Physical Modelling of Water, Fauna and Flora: Knowledge Gaps, Avenues for Future Research and Infrastructural Needs, J. Hydraul. Res., 52, 311–325, https://doi.org/10.1080/00221686.2013.876453, 2014.
Tolhurst, T. J., Black, K. S., Shayler, S. A., Mather, S., Black, I., Baker, K., and Paterson, D. M.: Measuring the in Situ Erosion Shear Stress of Intertidal Sediments with the Cohesive Strength Meter (CSM), Estuar. Coast. Shelf Sci., 49, 281–294, https://doi.org/10.1006/ecss.1999.0512, 1999.
Tolhurst, T. J., Gust, G., and Paterson, D. M.: The Influence of an Extracellular Polymeric Substance (EPS) on Cohesive Sediment Stability, Proceed. Marine Sci., 5, 409–425, https://doi.org/10.1016/S1568-2692(02)80030-4, 2002.
Tolhurst, T. J., Jesus, B., Brotas, V., and Paterson, D. M.: Diatom Migration and Sediment Armouring – an Example from the Tagus Estuary, Portugal, in: Migrations and Dispersal of Marine Organisms, Springer, Dordrecht, the Netherlands, 183–193, https://doi.org/10.1007/978-94-017-2276-6_20, 2003.
Tolhurst, T. J., Consalvey, M., and Paterson, D. M.: Changes in Cohesive Sediment Properties Associated with the Growth of a Diatom Biofilm, Hydrobiologia, 596, 225–239, https://doi.org/10.1007/s10750-007-9099-9, 2008.
Underwood, G. J. C., Paterson, D. M., and Parkes, R. J.: The Measurement of Microbial Carbohydrate Exopolymers from Intertidal Sediments, Limnol. Oceanogr., 40, 1243–1253, https://doi.org/10.4319/lo.1995.40.7.1243, 1995.
van de Lageweg,W. I., McLelland, S. J., and Parsons, D. R.: Quantifying biostabilisation effects of biofilm-secreted and extracted extracellular polymeric substances (EPS) on sandy substrate, data set, Zenodo, https://doi.org/10.5281/zenodo.1198991, 2018.
Vignaga, E., Haynes, H., and Sloan, W. T.: Quantifying the Tensile Strength of Microbial Mats Grown over Noncohesive Sediments, Biotechnol. Bioeng., 109, 1155–1164, https://doi.org/10.1002/bit.24401, 2012.
Vignaga, E., Sloan, D. M., Luo, X., Haynes, H., Phoenix, V. R., and Sloan, W. T.: Erosion of Biofilm-Bound Fluvial Sediments, Nat. Geosci., 6, 770–774, https://doi.org/10.1038/ngeo1891, 2013.
Zanke, U. C. E.: On the Influence of Turbulence on the Initiation of Sediment Motion, Int. J. Sediment Res., 18, 1–15, 2003.