the Creative Commons Attribution 4.0 License.
the Creative Commons Attribution 4.0 License.
 | 09 Aug 2018
GlobR2C2 (Global Recession Rates of Coastal Cliffs): a global relational database to investigate coastal rocky cliff erosion rate variations
Mélody Prémaillon
Vincent Regard
Thomas J. B. Dewez
Yves Auda
Rocky coast erosion (i.e., cliff retreat) is caused by a complex interaction of various forcings that can be marine, subaerial or due to rock mass properties. From Sunamura's seminal work in 1992, it is known that cliff retreat rates are highly variable over at least four orders of magnitude, from 1 to 10 mm yr−1. While numerous local studies exist and explain erosion processes at specific sites, there is a lack of knowledge at the global scale. In order to quantify and rank the various parameters influencing erosion rates, we compiled existing local studies into a global database called GlobR2C2 (which stands for Global Recession Rates of Coastal Cliffs). This database reports erosion rates from publications, cliff setting and measurement specifications; it is compiled from peer-reviewed articles and national databases. In order to be homogeneous, marine and climatic forcings were recorded from global models and reanalyses. Currently, GlobR2C2 contains 58 publications that represent 1530 studied cliffs and more than 1680 estimated erosion rate. A statistical analysis was conducted on this database to explore the links between erosion rates and forcings at a global scale. Rock resistance, inferred using the criterion of Hoek and Brown (1997), is the strongest signal explaining variation in erosion rate. Median erosion rates are 2.9 cm yr−1 for hard rocks, 10 cm yr−1 for medium rocks and 23 cm yr−1 for weak rocks. Concerning climate, only the number of frost days (number of day per year below 0 ∘C) for weak rocks shows a significant, positive, trend with erosion rate. The other climatic and marine forcings do not show any clear or significant relationship with cliff retreat rate. In this first version, GlobR2C2, with its current encompassing vision, has broad implications. Critical knowledge gaps have come to light and prompt a new coastal rocky shore research agenda. Further study of these questions is paramount if we one day hope to answer questions such as what the coastal rocky shore response to sea-level rise or increased storminess may be.
- Article
(15585 KB) - Full-text XML
-
Supplement
(454 KB) - BibTeX
- EndNote


Rocky coasts are characterized by dynamically linked cliff retreat and shore platform erosion (Moses and Robinson, 2011). By comparison between continental and coastal cliffs, it is clear that the presence of the sea is a fundamental driver of cliff retreat (Fig. 1). However, as Moses and Robinson (2011) posit, “our understanding of their dynamics and our ability to predict their evolution over time remains severely limited”. Kennedy (2014) emphasizes the growing number of quantitative studies, spurred by the development of new methods such as lidar techniques. According to their analysis, a reassessment of cliff retreat rates is needed. Hence, the purpose of this paper is to take advantage of this growing corpus of data in order to quantitatively analyze cliff erosion drivers.

Figure 1Evidence of the sea driving coastal cliff erosion. The vertical shaped cliff in the foreground is similar to the cliff in the background (its smoothed shape), except that the one in the background has been protected from the sea by a sand spit. Obviously, the cliff with sea at its base then retreats more quickly (the cliff face is more or less vertical). Photo from Punta Quilla, Patagonia, Argentina.
These drivers can be divided in three groups, depending on their nature (Fig. 2). The first group of drivers concerns marine forcings. Waves attack and weaken cliff bases, sometimes carving a notch, which leads to cliff instability and subsequent collapse (Benumof et al., 2000; Caplain et al., 2011). This is a common assumption in coastal landscape evolution models and leads to the development of a shore platform below the cliff. These platforms have sometimes been described as being entirely shaped by the waves, leading to the debated term “wave cut platform” (Anderson et al., 1999). The reality is more complex (elaborated upon in the following); therefore, we prefer the term “(rock) shore platform”. Debris aprons are removed by sea action, allowing for renewed wave attack at the cliff base. Cliff base weakening, cliff collapse and debris apron removal, followed by renewed cliff-base weakening is sometimes referred to as the platform/cliff erosion cycle (Caplain et al., 2011). Wave assailing force depends on wave energy dissipation over the shore platform (Sunamura, 1992; Trenhaile, 2000). The wider and shallower the platform is, the lower the remaining wave power at the cliff foot. Hence, platforms can be regarded as natural defences against wave attack of the cliff. The shore platform evolves under marine forcing like wave agitation and associated shear stress (Sallenger Jr et al., 2002; Stephenson and Kirk, 2000; Sunamura, 1992; Trenhaile, 2008, 2009), or tide-induced wetting and drying cycles (Kanyaya and Trenhaile, 2005; Stephenson and Kirk, 2000). The second group of drivers is rock mass properties, which are believed to have a strong influence on cliff evolution (Mortimore and Duperret, 2004). Rock mass behavior depends on its lithology, structure, fracturing and weathering (Cruslock et al., 2010). The third group of drivers is a combination of subaerial processes: climate through precipitation, temperature or frost occurrences (Dewez et al., 2015) may either provoke cliff instability or prepare for it by physical and chemical weathering (Duperret et al., 2005).
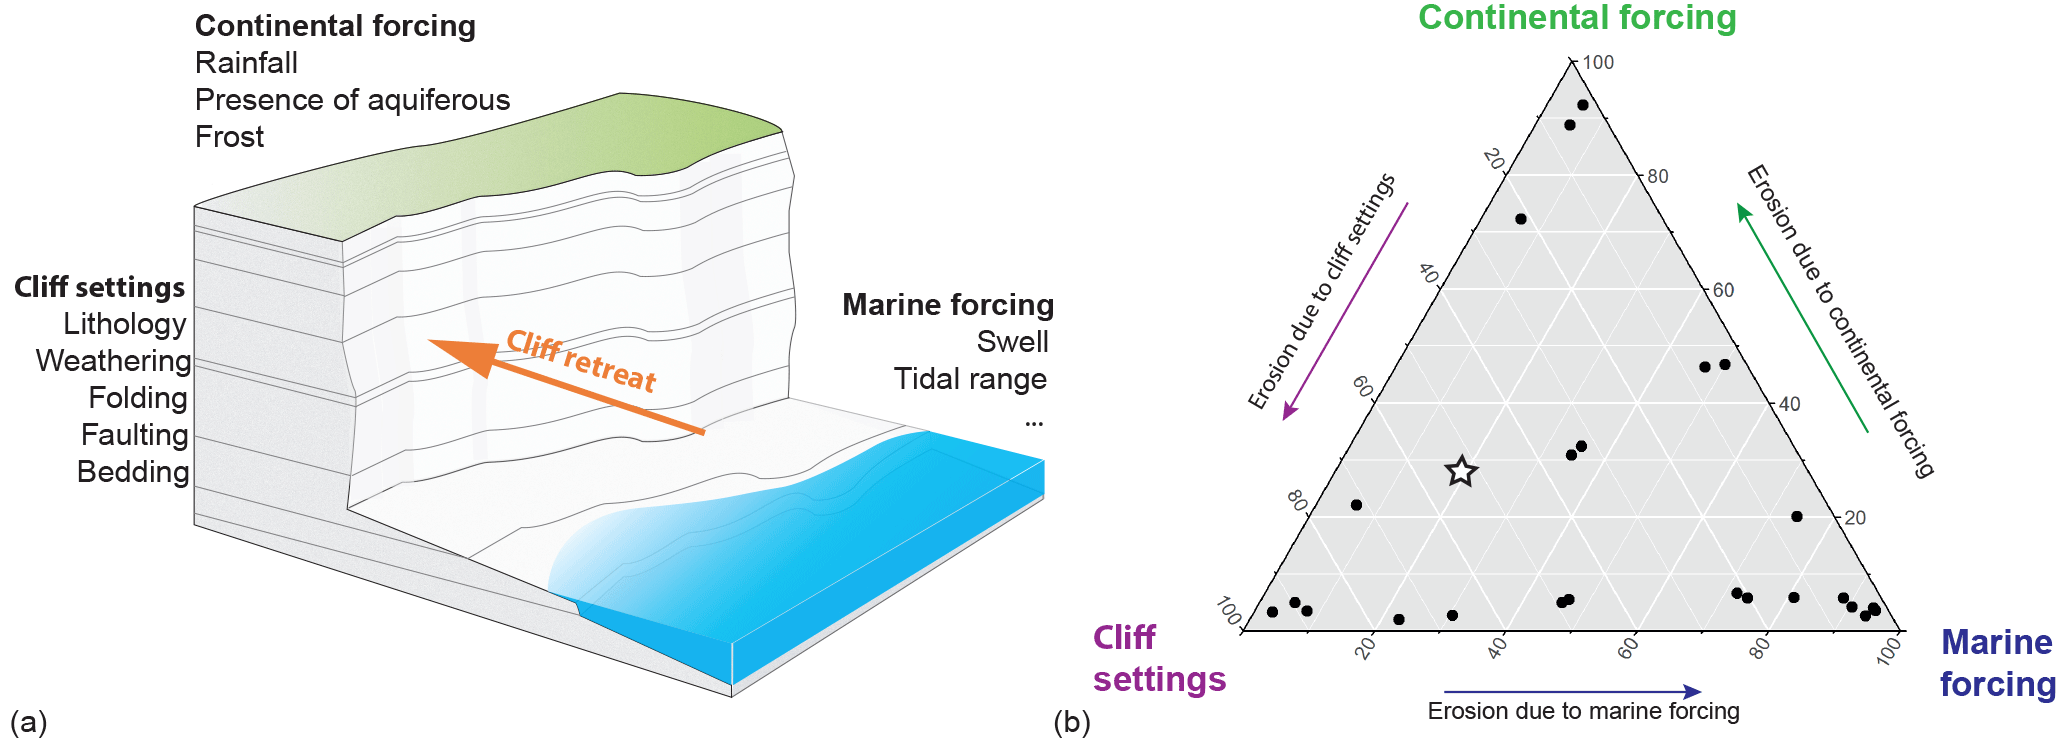
Figure 2(a) Sketch diagram of rocky cliff erosion drivers. (b) Relative cliff retreat drivers reported from published literature in GlobR2C2. Factors of influence are grouped into three main classes: (i) “marine forcing”; (ii) “continental forcing”, which encompasses weather conditions and continental groundwater; and (iii) “cliff settings”. Responsible forcings cited by authors in publications' abstracts are summarized as a percentage of those three forcing based on abstract content. The star anticipates our position given the results emerging from the GlobR2C2 data base.
Each of these have been proven to be efficient in their own way in cliff retreat phenomena, but their relative importance is perceived differently across studies (Fig. 2), which is likely due to the small spatial extent of the sites or the authors' field of expertise. Some attempts exist to rank the different drivers at the local scale (Earlie et al., 2015; Lim et al., 2010) but these hierarchies can not really be upscaled.
Some studies aim at quantifying cliff retreat rates at the regional scale, i.e., coastal sections of several tens to hundreds of kilometers. These studies often pertain to risk management (Gibb, 1978; Hapke et al., 2009) or are focused on a certain type of rock in order to understand its impact on cliff dynamics (Moses and Robinson, 2011). This implies that these studies cannot be used to describe global retreat drivers because (i) they do not analyze the contribution of each driver, and (ii) they remain too local and characterize a narrow range of forcings (e.g., climate, homogeneous lithology and so on)
In order to overcome biases inherent to individual approaches, studies have been conducted at global scale. They are often based on morphometry; for example, the classic study by Emery and Kuhn (1982) interprets cliff profile morphology as a function of cliff top and toe composition and marine and subaerial relative process efficiency. The only global, quantitative, dataset was produced by Sunamura (1992), and was based on quantitative studies published prior to that date. Sunamura's database was only used by Woodroffe (2002) to evaluate ranges of erosion rates for different lithological types. Up until this point, those rates have never been related to environmental factors.
Since Sunamura's 1992 compilation, 26 years ago, many new quantitative studies have been published. These studies have taken advantage of several technological changes in that time interval. National mapping agencies have released their aerial photography archives online, allowing researchers to record cliff top retreat over decades. These provide contemporary surveys with historical context. Airborne and terrestrial lidar and structure from motion (SfM) methods have revolutionized ad hoc surveys in the geosciences, making precise geometric information available when and where required. These methods enable the documentation of rockfalls from cliff faces and the assessment of their volumes. Software developments afforded massive 3-D processing capabilities, even to non-specialists. Therefore, quantitative site studies are now addressing cliff face erosion style at the centimeter-scale (Dewez et al., 2013; Earlie et al., 2015; Gulayev and Buckeridge, 2004; Letortu et al., 2015; Rosser et al., 2007; Young and Ashford, 2006). This contemporary high spatial accuracy is then combined with high time resolution (up to 20 min) with the detection of decimetric fragments from cliff faces (Williams et al., 2018). Cliff recession phenomena have never been so well defined in space and time. It is now time to sort through the possible processes generating cliff responses.
We updated the dataset from Sunamura (1992) into the new GlobR2C2 (Global Recession Rates of Coastal Cliffs) database by taking advantage of all the existing site and regional studies, and built a worldwide cliff recession database. This database is used in a new approach to link documented erosion rates and external forcings. It also allows researchers to look at the relative efficiency of forcings in relation to one another, in order to explain erosion rate variations at the global scale. The benefits of this global approach are that it erases local specificity and seeks to define global trends. The links between cliff retreat and environmental parameters were explored statistically. However, the synthetic database approach is limited in that it compiles the information available for all studies at once. In that sense, it reduces information to the largest common denominator. Therefore, the main goals of this paper are as follows: (i) to compile a review of online literature in English, French or Spanish from peer-reviewed publications or national databases providing cliff retreat rates; and (ii) to link a dependent variable (erosion rate) to independent variables (cliff and meteo-marine settings). This analysis demonstrates the predominance of factors leading to cliff retreat. The GlobR2C2 data are available in the Supplement.
2.1 Study design
The main goal of this study is to link cliff retreat rate to external forcings at global scale. Those data exist in peer-reviewed journal articles and national databases. Peer-reviewed articles were chosen as the source of cliff descriptions and erosion rate values and settings. However, marine and continental forcings conditions are often reported in a very heterogeneous fashion. This information can either be completely lacking, incomplete or described in inconsistent ways. To overcome this issue, external global databases were used to harmonize forcings (i.e., tidal range, swell height, rainfall and so on; see Sect. 2.3.6 to 2.3.9). They provide standardized and reputable information for cliff height, sea condition and atmospheric climate.
The different steps of the study described in subsequent paragraphs are as follows: (i) the design and filling of a relational database with raw data, (ii) post-processing on database fields in order to tidy up the data and (iii) statistical exploration of links between erosion and forcings.
2.2 Database design
To organize the disparate knowledge reported in the literature, a rigorous analytical framework is an absolute necessity upstream of any data capture. We opted for a relational data base framework where the architecture was designed according to the Merise method (Tardieu et al., 1985). Merise provides a formal methodology to describe entity–relationship data models. Each entity corresponds to a group of data framed into a table and containing different fields called attributes. The different entities are related to each other by well-defined relations. As an example, the “cliff” entity contains information about cliff settings (Fig. 3). Each cliff description corresponds to a line in the “cliff” table and contains a unique primary key to identify this line/record. The “measure” entity contains information about cliff erosion. “Cliff” and “measure” are related through cliff erosion. The relation between an erosion record and its corresponding cliff is made by typing the cliff primary key. This conceptual exercise allows for optimized data capture and redundancy, the flagging of possible information duplicates and the limitation of ill-conceived relationships. The database structure was implemented in OpenOffice.org Base, which can be addressed by the statistical software R via SQL queries. Only the geographic fields (cliff location) were digitized in Google Earth and exported into shapefile with a key code or primary key linked to the relational database (in the sense of data science analysis).
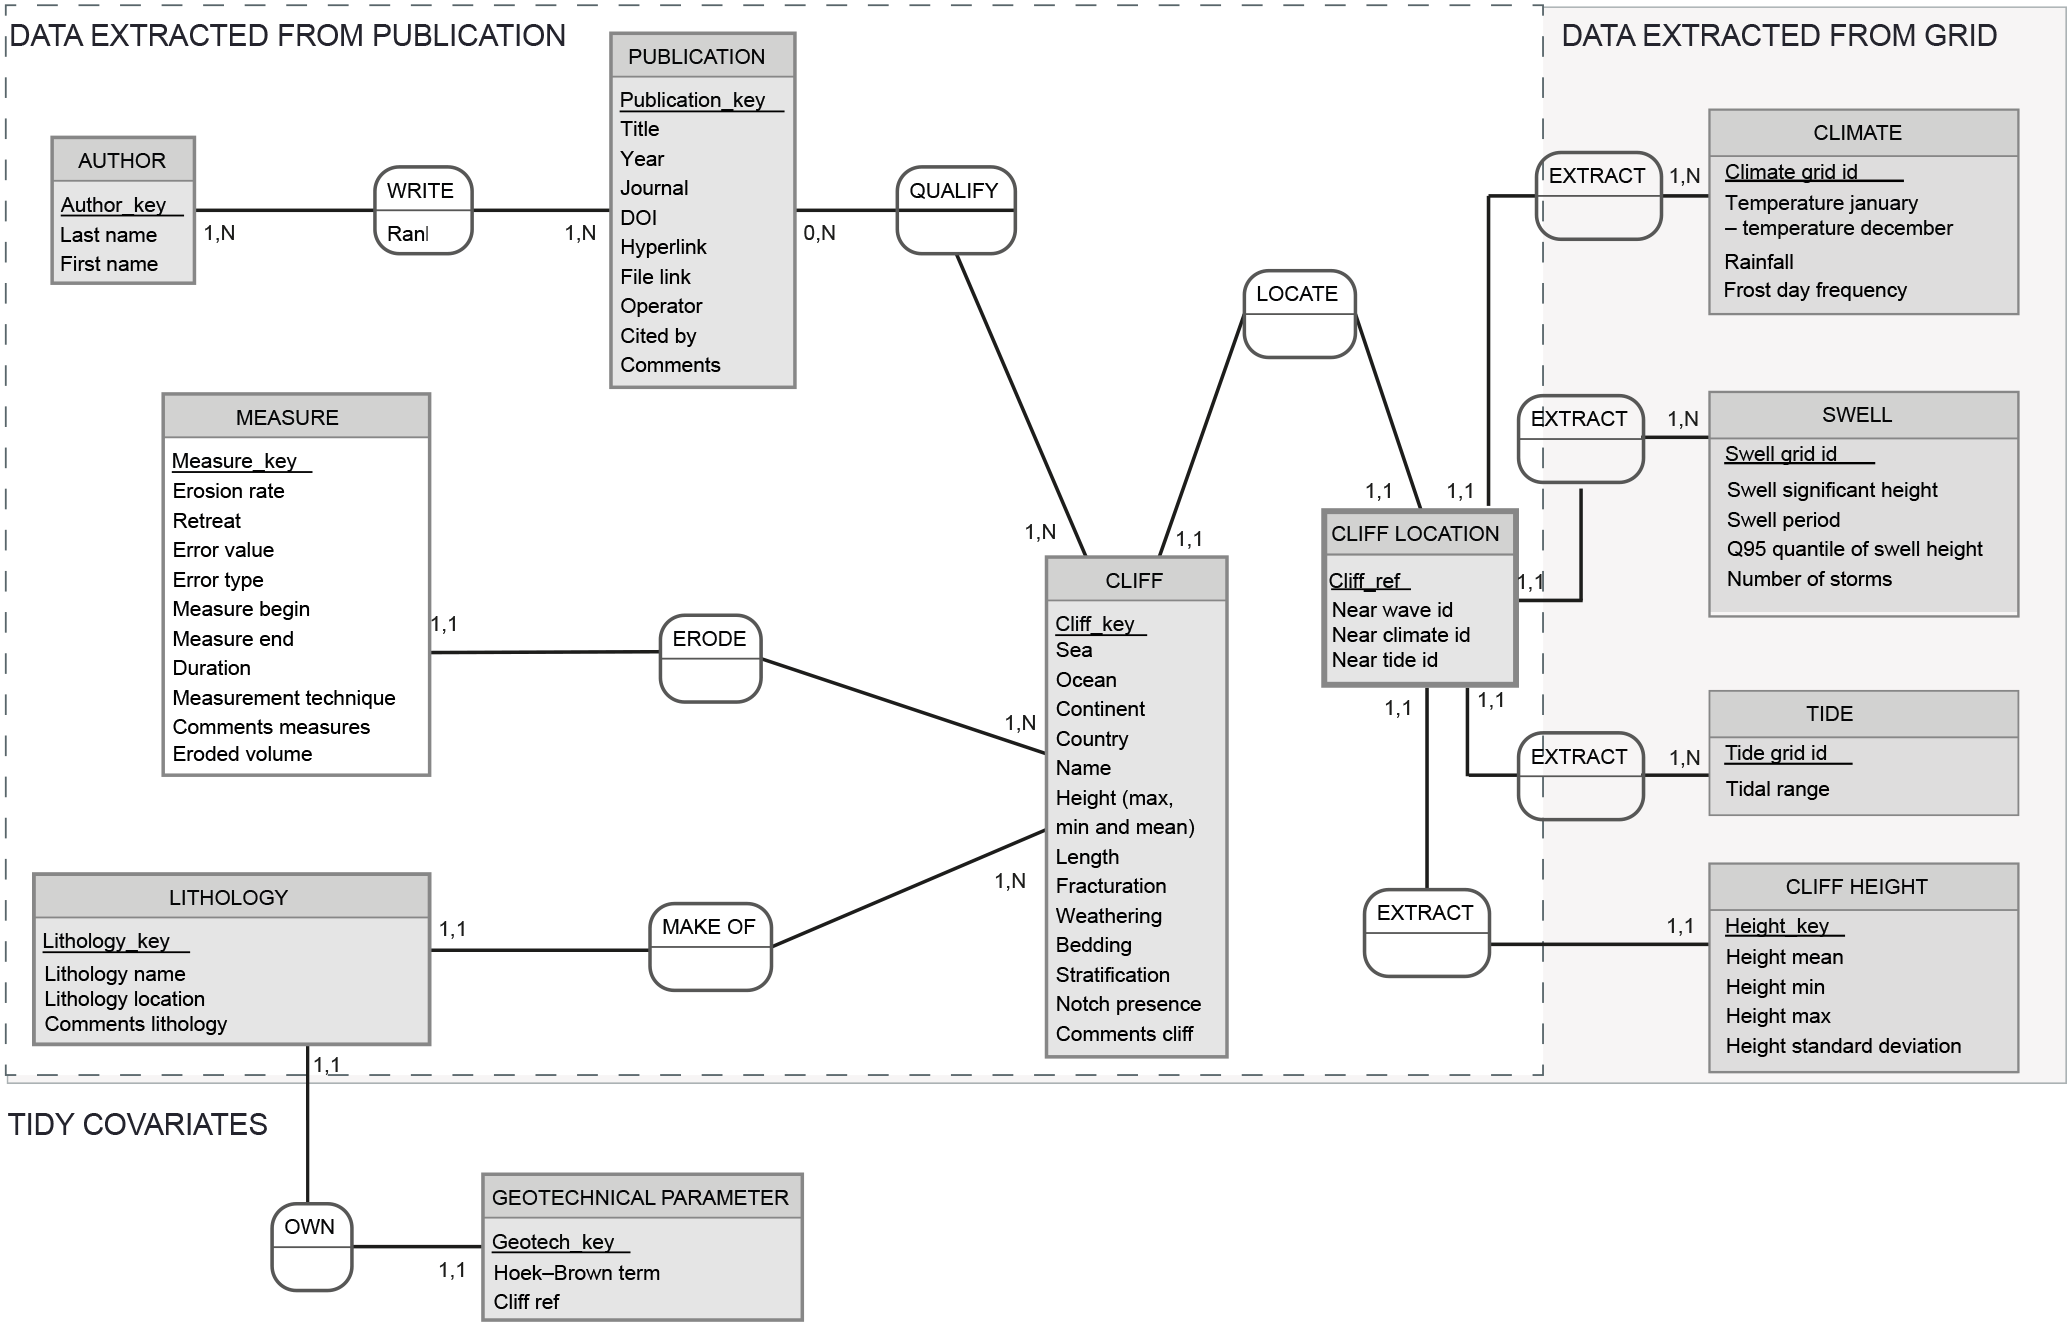
Figure 3Conceptual data model of the GlobR2C2 cliff erosion database. Primary keys are underlined and numbers are cardinalities.
Here, GlobR2C2 was structured with two objectives in mind: (i) compiling original information and faithfully tracing publication sources, and (ii) anticipating analytic queries of the database designed to answer geomorphological questions. The database is structured to keep track of information relative to publications, sites, measurements and contextual information of the cliffs, or their environment. Specific care was taken to separate original data from information derived by us, and to distinguish between article information from auxiliary datasets (Fig. 3). The database contains entities from three type of sources: raw data from publications, raw data from gridded data (global reanalysis) and tidy covariates (derived from raw data).
The final conceptual data model contains 11 entities and 76 attributes. A conceptual model is given in Fig. 3. Entities refer to publications (“Publication and Author”), cliffs (“Cliff, Lithology, Geotechnical parameters, Cliff height”); erosion rate measurement (“Measure”) and forcing (“Climate, Swell, Tide”). Information contained in each entity came from publication except entities concerning forcings and “Geotechnical parameters” which came from external sources (Fig. 3). The relation between the different entities are explicitly described by the action verbs and the numbers represent the cardinality of the relation (e.g., 1 cliff can correspond to 1 or N erosion rate measurements, cardinality 1,N).
2.3 Database information fields
2.3.1 Raw data extraction: from publications and national databases
GlobR2C2 (Global Recession Rates of Coastal Cliffs) database v1.0 was populated with data from two main types of published sources: published peer-reviewed English journal articles, and official but non-peer-reviewed studies arising from official organizations (e.g., the CEREMA French risk survey) in English, French or Spanish. Journal articles were selected when they reported quantified values of cliff recession rates and described the quantification method. The search was initiated with bibliographic web search engines (Web of Science, Google Scholar) and expanded using citations therein. We recognize that some references may have escaped our attention. We are keen to expand the database further with the contribution of the community. The version presented in this article is version 1.0. compiling references up to 2016.
2.3.2 Cliff and lithology description
The “cliff” and “lithology” entities contain information related to cliff morphology (i.e., height, length) and rock property (i.e., lithology, fracturing, weathering, folding, bedding).
Cliff geology may exhibit a very complex set of lithologic types, contact relationships, inherited tectonic structures and overprinted weathering. Authors often do not systematically report on these characteristics. Confronted with the heterogeneity of parameter presentation, we synthesized information in the following manner. A lithological name fills the “lithology” entity and a position field records rock position along the cliff (numbered from cliff toe to cliff top). Additional descriptions were copy/pasted in comment fields in order to preserve the original description. By comparison, rock state (weathering, folding, faulting, bedding etc.), is rarely mentioned. This could be because the cliffs do not present any such characteristics, or because authors did not think it was relevant and did not mention it. Moreover, parameters describing rock state are either complex, technically expensive to describe and quantify, or outside the authors' scientific field of expertise. They were characterized with a Boolean value (True/False) to be integrated in the database. “True” refers to the presence of fracturing/weathering mentioned in the paper. “False” means that authors either describe fracturing/weathering as non existent/negligible or it is not mentioned in the paper.
2.3.3 Cliff location
Cliff location is entered as geographic coordinates. Studied cliff site extent was digitized from publication information and mapped using Google Earth. A primary key links this geographic file to the database.
2.3.4 Measurement description
The measure entity contains the erosion rate values and measurement methodology (how erosion was measured, for how long, with what detection threshold). Erosion is generally provided as an erosion rate in meters per year, occasionally as finite retreat (in meters) or as minimum and maximum erosion rates or eroded volume (in cubic meters).
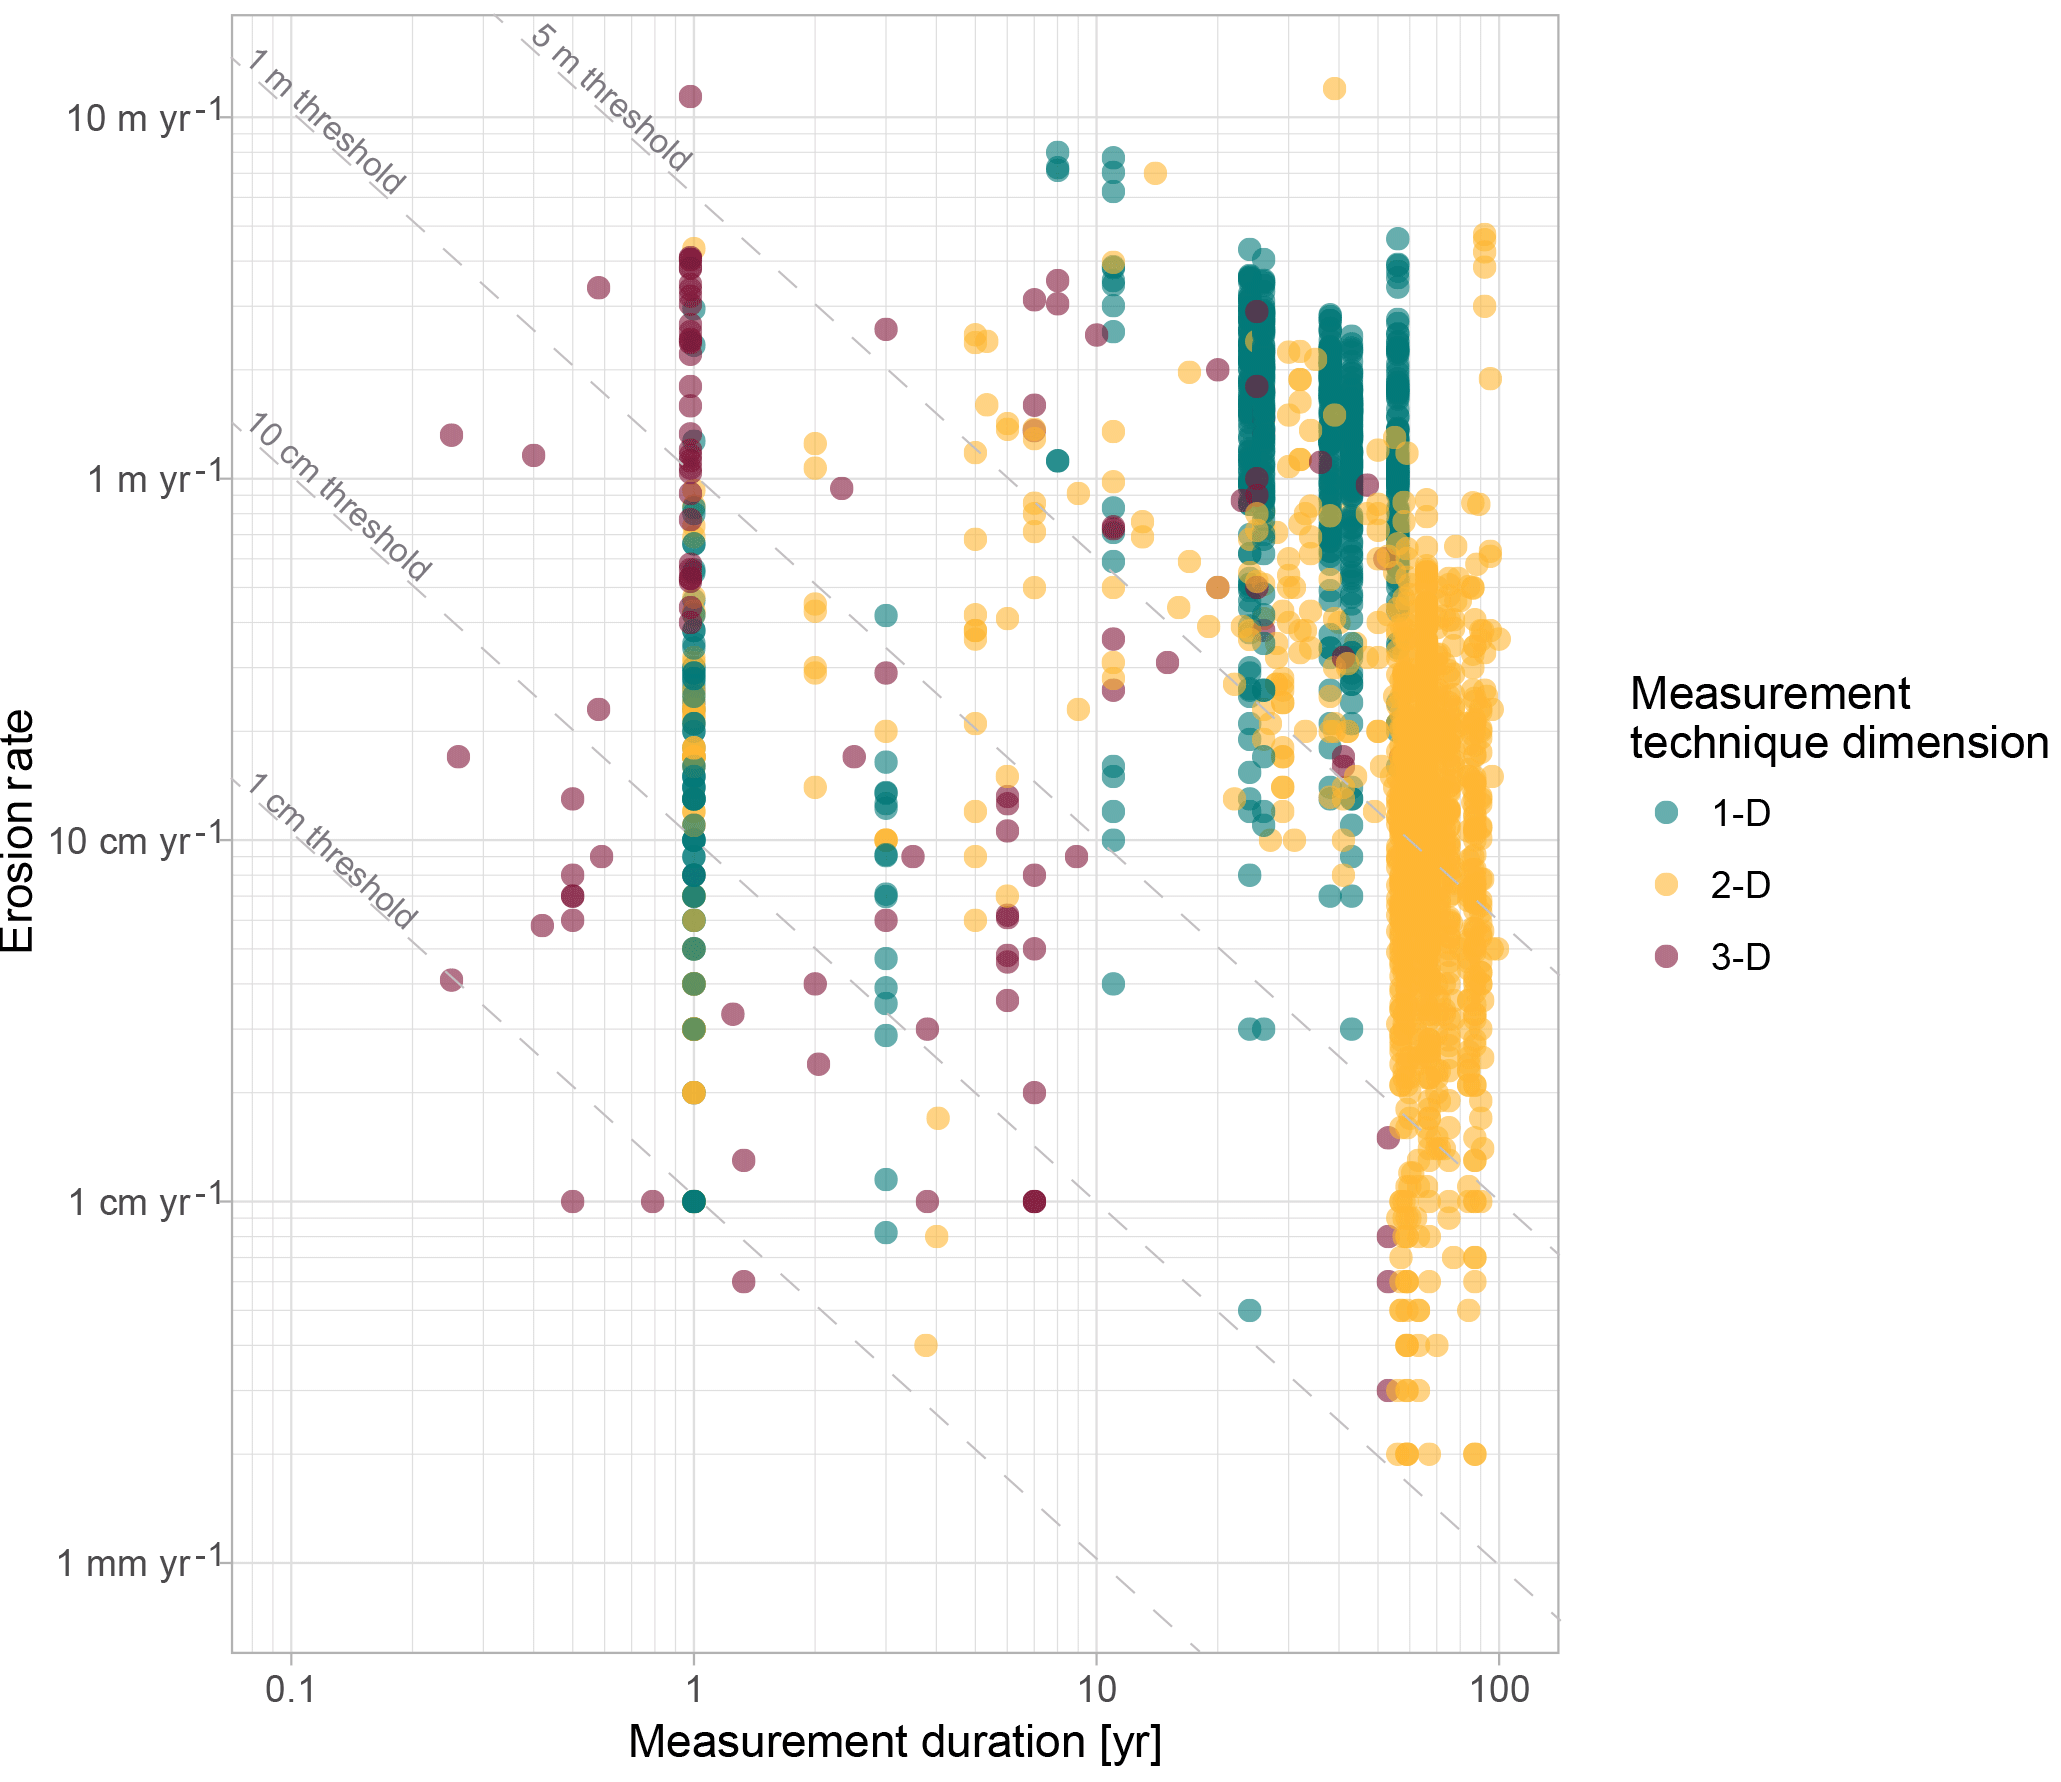
Cliff retreat measurement errors and time spans were also recorded. Measuring sea cliff erosion presents a wide range of techniques. Those techniques vary significantly in terms of the following: (i) accuracy, which range from field observation and “expert” estimates May and Hansom (2003) of volume loss to precise measurements using techniques such as lidar (Dewez et al., 2013); (ii) time period surveyed, which range from twenty minutes (Williams et al., 2018) to thousands of years (Choi et al., 2012; Hurst et al., 2017; Regard et al., 2012); and (iii) the spatial extent along the coast, which ranges from tens of meters (Letortu et al., 2015) to kilometers (Hapke et al., 2009). Moreover, these measurements can be divided into three classes of methods: one-dimensional (1-D), two-dimensional (2-D) or three-dimensional (3-D).
One-dimensional cliff retreat measurement techniques correspond to retreats calculated on single transects. Typically, they correspond to measurements made with peg transects that record the cliff toe retreat or transects on aerial photographs to quantify cliff-top retreat (Kostrzewski et al., 2015; Lee, 2008; Pye and Blott, 2015). Two-dimensional measurements are mostly based on aerial photograph comparison. They either quantify the area lost between two aerial photographs campaigns or average numerous transects (Costa et al., 2004; Letortu, 2013; Marques, 2006). Three-dimensional techniques record the evolution of the cliff face and quantify volumes (Letortu et al., 2015; Lim et al., 2005; Rosser et al., 2007). Initially, 3-D assessments were performed based on observable, large, rockfall scars or debris aprons, (May, 1971; Orviku et al., 2013; Teixeira, 2006) but now the two most commonly used methods are lidar and SfM.
2.3.5 CEREMA French national dataset
The French CEREMA institute published a systematic national coastal cliff recession inventory (Perherin et al., 2012) based on aerial photograph comparison every 200 m stretch of cliff along the entire French metropolitan coastline (1800 km of coastal rocky cliff, which corresponds to 465 (53 %) values in the database). This rich systematic dataset was obviously included in GlobR2C2 but with two caveats. On one hand, the CEREMA dataset introduces a strong spatial bias for French oceanographic and climatic conditions in the database observation records. This situation may risk polarizing the analytical results; however, this was recognized beforehand and specifically treated to prevent such bias (cf. Sect. 4.2.3). On the other hand, being a systematic study for every stretch of coastal cliff around the country makes it more robust to scientific and funding biases. Research funds are often sought for areas combining coastal threats with societal interest. Therefore, coasts with higher recession rates are more often sampled, while quiet stretches of coastlines remain in the shadows. Consequently, including this data provides a more representative set of values existing along coastlines. Little studied sectors of the CEREMA research are hard rock coastal stretches (e.g., hard proterozoic granites from French Brittany) and erosion rates lower than the study's detection threshold.
Based on historical aerial photograph archives, CEREMA acknowledges that the quality of photographs limits the detectable cliff recession to rates higher than 10 cm yr−1. Below this value, they deem recession rates as undetermined. We chose to record those undetermined values in the database but not to use them in the statistical analysis. We discuss this decision in discussion section.
2.3.6 Tides
The tidal range describes the variation in the height of the water surface. One consequence is that the cliff and platform undergo cyclic wetting and drying that weakens and erodes the constituting rocks (Kanyaya and Trenhaile, 2005). Rather than referring to difficult to use tidal records from tide gages, tidal modeling was performed with FES 2012 software (Carrère et al., 2012). This model gives all the constituents of the harmonic tide analysis. For our analysis, eight harmonics were considered: M2, N2, K2, S2, P1, K1, O1 and N2_2. These harmonics represent the diurnal and semi-diurnal main components of the tide harmonic model. The model produces a time series between given start and stop dates of sea level within a regular grid of 0.25∘. Tidal characteristics were retrieved for each study location for two entire years, from which the mean amplitude over two cycles was extracted (i.e., height difference between successive high and low tides).
Table 1Field estimates of uniaxial compressive strength (Hoek and Brown, 1997) associated with the Hoek and Brown term in the database and the corresponding lithologies in the database.
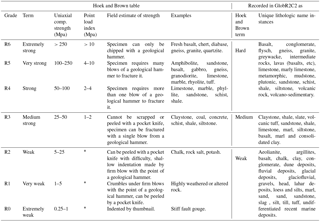
* Point load tests on rocks with a uniaxial compressive strength below 25 MPa are likely to yield highly ambiguous results.
2.3.7 Waves
Wave properties were extracted from the ERA-interim reanalysis dataset (Dee et al., 2011). This gridded data has a pixel size of 0.75∘. Temporally, data spacing is 6 h during the 1979–2016 period. Wave assault was characterized both in terms of mean agitation and extreme events. Three mean parameters characterize wave assailing force: significant wave height of combined swell and wind, wave period and wave direction. For swell characteristics, mean significant wave height and wave period characterize the average sea agitation. The wave direction value records the most frequent wave direction for the duration of the reanalysis period (1979–2016).
Anticipating that mean sea state values may be deceptive metrics, a record of extreme events was also described. Those events were characterized by the 95th percentile of wave significant height as suggested by Castelle et al. (2015). To complete this quantile value, the number of storms experienced at each cliff site was calculated between 1979 and 2016.
2.3.8 Climate
Climatic information was extracted from Climate Research Unit data between 1961 and 1990 (Mitchell and Jones, 2005). The grid size is 0.5∘, at monthly time steps. Chosen parameters likely to influence erosion rate are mean annual rainfall, mean monthly temperatures and the number of freezing days (number of days per year below 0 ∘C). We did not find a global climatic dataset reporting time series of rainfall and temperatures spanning the durations covered by the articles contained in GlobR2C2.
2.3.9 Cliff height
Cliff height often appeared to be missing. Filling this value is not straightforward because cliff height can be strongly variable along the surveyed cliff. Nevertheless, in order to provide a robust estimate, a mean cliff height was extracted from the 7.5 arcsec spatial-resolution GMTED2010 data global DEM (Danielson and Gesch, 2011). Cliff height extraction consisted of computing a buffer around the cliff extension shapefile, in which the mean value of the non-zero pixels (corresponding to the sea) was computed. To assess the accuracy of these cliff height estimates, they were compared against those rare values presented in publications. The estimations were found to be close to values given in publications with a root mean square error of 19 m at global scale. We deem it sufficient for a first attempt at the global scale, and probably not greatly different from the cliff height accuracy seen in the publications.
2.4 Tidying the covariates: from database fields to predictors
The first purpose of the database is to collate raw data from original sources in the most traceable manner possible. This data does not necessarily report information in an easily accessible fashion. This may be because (i) fields translate different realities (e.g., recession rates vs. retreat values or recession rates relate to profile-specific recession rate or to kilometer long cliff sections), or (ii) value instances of a field are too broad and need summarizing in fewer categories (e.g., lithology). Thus, post-processing was applied to the database in order to make it more homogeneous and more readily usable for statistical analysis.
2.4.1 Integration of punctual records
We mentioned earlier that measurement techniques were either 1-D, 2-D or 3-D. These methods do not reflect the exact same processes and a choice was made to force all measurements to homogeneously report 2-D type measurements. The 3-D measurements in cubic meters per year were divided by cliff face surface in a cliff top equivalent retreat in meters per year. One-dimensional measurements do not average information laterally. Cliff retreat is stochastic in time and space and 1-D measurements profiles may happen to quantify erosion on a particulary high or low erosion transect. Therefore, erosion rates of the transect measurements were averaged for a unique study, cliff and period of time in order to limit the risk of over- or under-representation.
2.4.2 Field unit conversion
Original data may be provided in different ways (for example the time span between two measurements may be given by a duration or by start and end dates). As often as possible this information is summarized in a single duration field with a homogeneous unit. The following are the operations performed:
-
To obtain a duration in years, the fields measure duration (year), measure beginning and measure ending (date) were merged together.
-
Retreat (m) and eroded volume (m3) were converted to retreat rate (m yr−1).
-
The mean cliff height was either obtained from a cliff height mean field or as the mean between height min, height max (m).
-
The error (m yr−1) was a compilation of the error value and error type.
2.4.3 Average site climate
Some explanatory variables were strongly correlated with each other (e.g., wave period vs. wave significant height). This redundant information may lead to spurious correlation. Therefore, new synthetic variables combine existing variables:
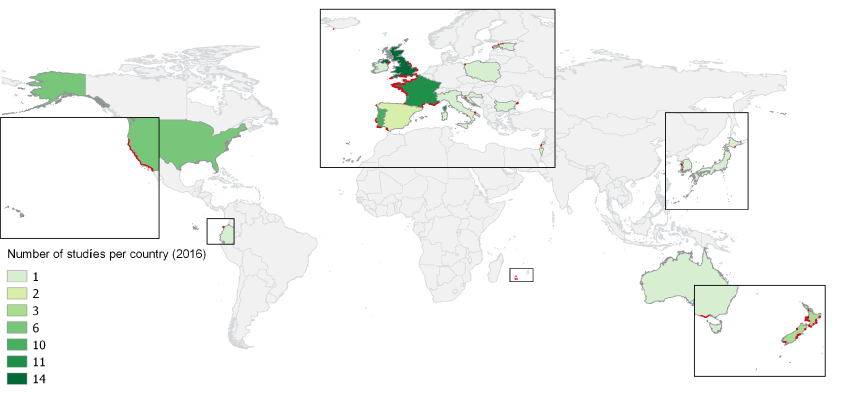
Figure 4Cliff site locations (red dots) and number of studies contained in the GlobR2C2 database by country (published before 2016).
-
Monthly mean temperatures were converted to mean annual temperature and amplitude.
-
Deep water swell energy flux was computed using swell period and significant height
where ρ is water density, Hs (m) is significant wave height, Cg (m s−1) is wave group velocity and T (s−1) is wave period.
-
Swell incidence angle with respect to the cliff (angle between 0 and 90∘).

Figure 5Time line of cliff erosion publications recorded in GlobR2C2 differentiated by measurement method.
2.4.4 Rock resistance inference
The database, filled with information from publications, results in more than 40 distinct lithological descriptions. We first grouped lithology into 9 groups with a similar classification to that of Woodroffe (2002) for historical comparison. But lithology alone does not govern rock mass mechanical properties. Tectonic inheritance, deformation, fracturing and weathering weaken the rock masses. Consequently, the rock constituting the cliffs are divided by rock mass strength criteria. Following the practical examples from Hoek and Brown (1997), we propose to further aggregate Hoek and Brown's macroscopic rock mass strength categories into three categories. Hoek and Brown (1997) describe field estimates of rock strength and experimental uniaxial compressive strength. They describe seven grades of rock resistance, from extremely weak to extremely strong. Table 1 in this study describes field estimates, resistance terms, compressive strength and provides examples of such materials. This table is associated with our Hoek and Brown classification and the relative lithologies found in the database.
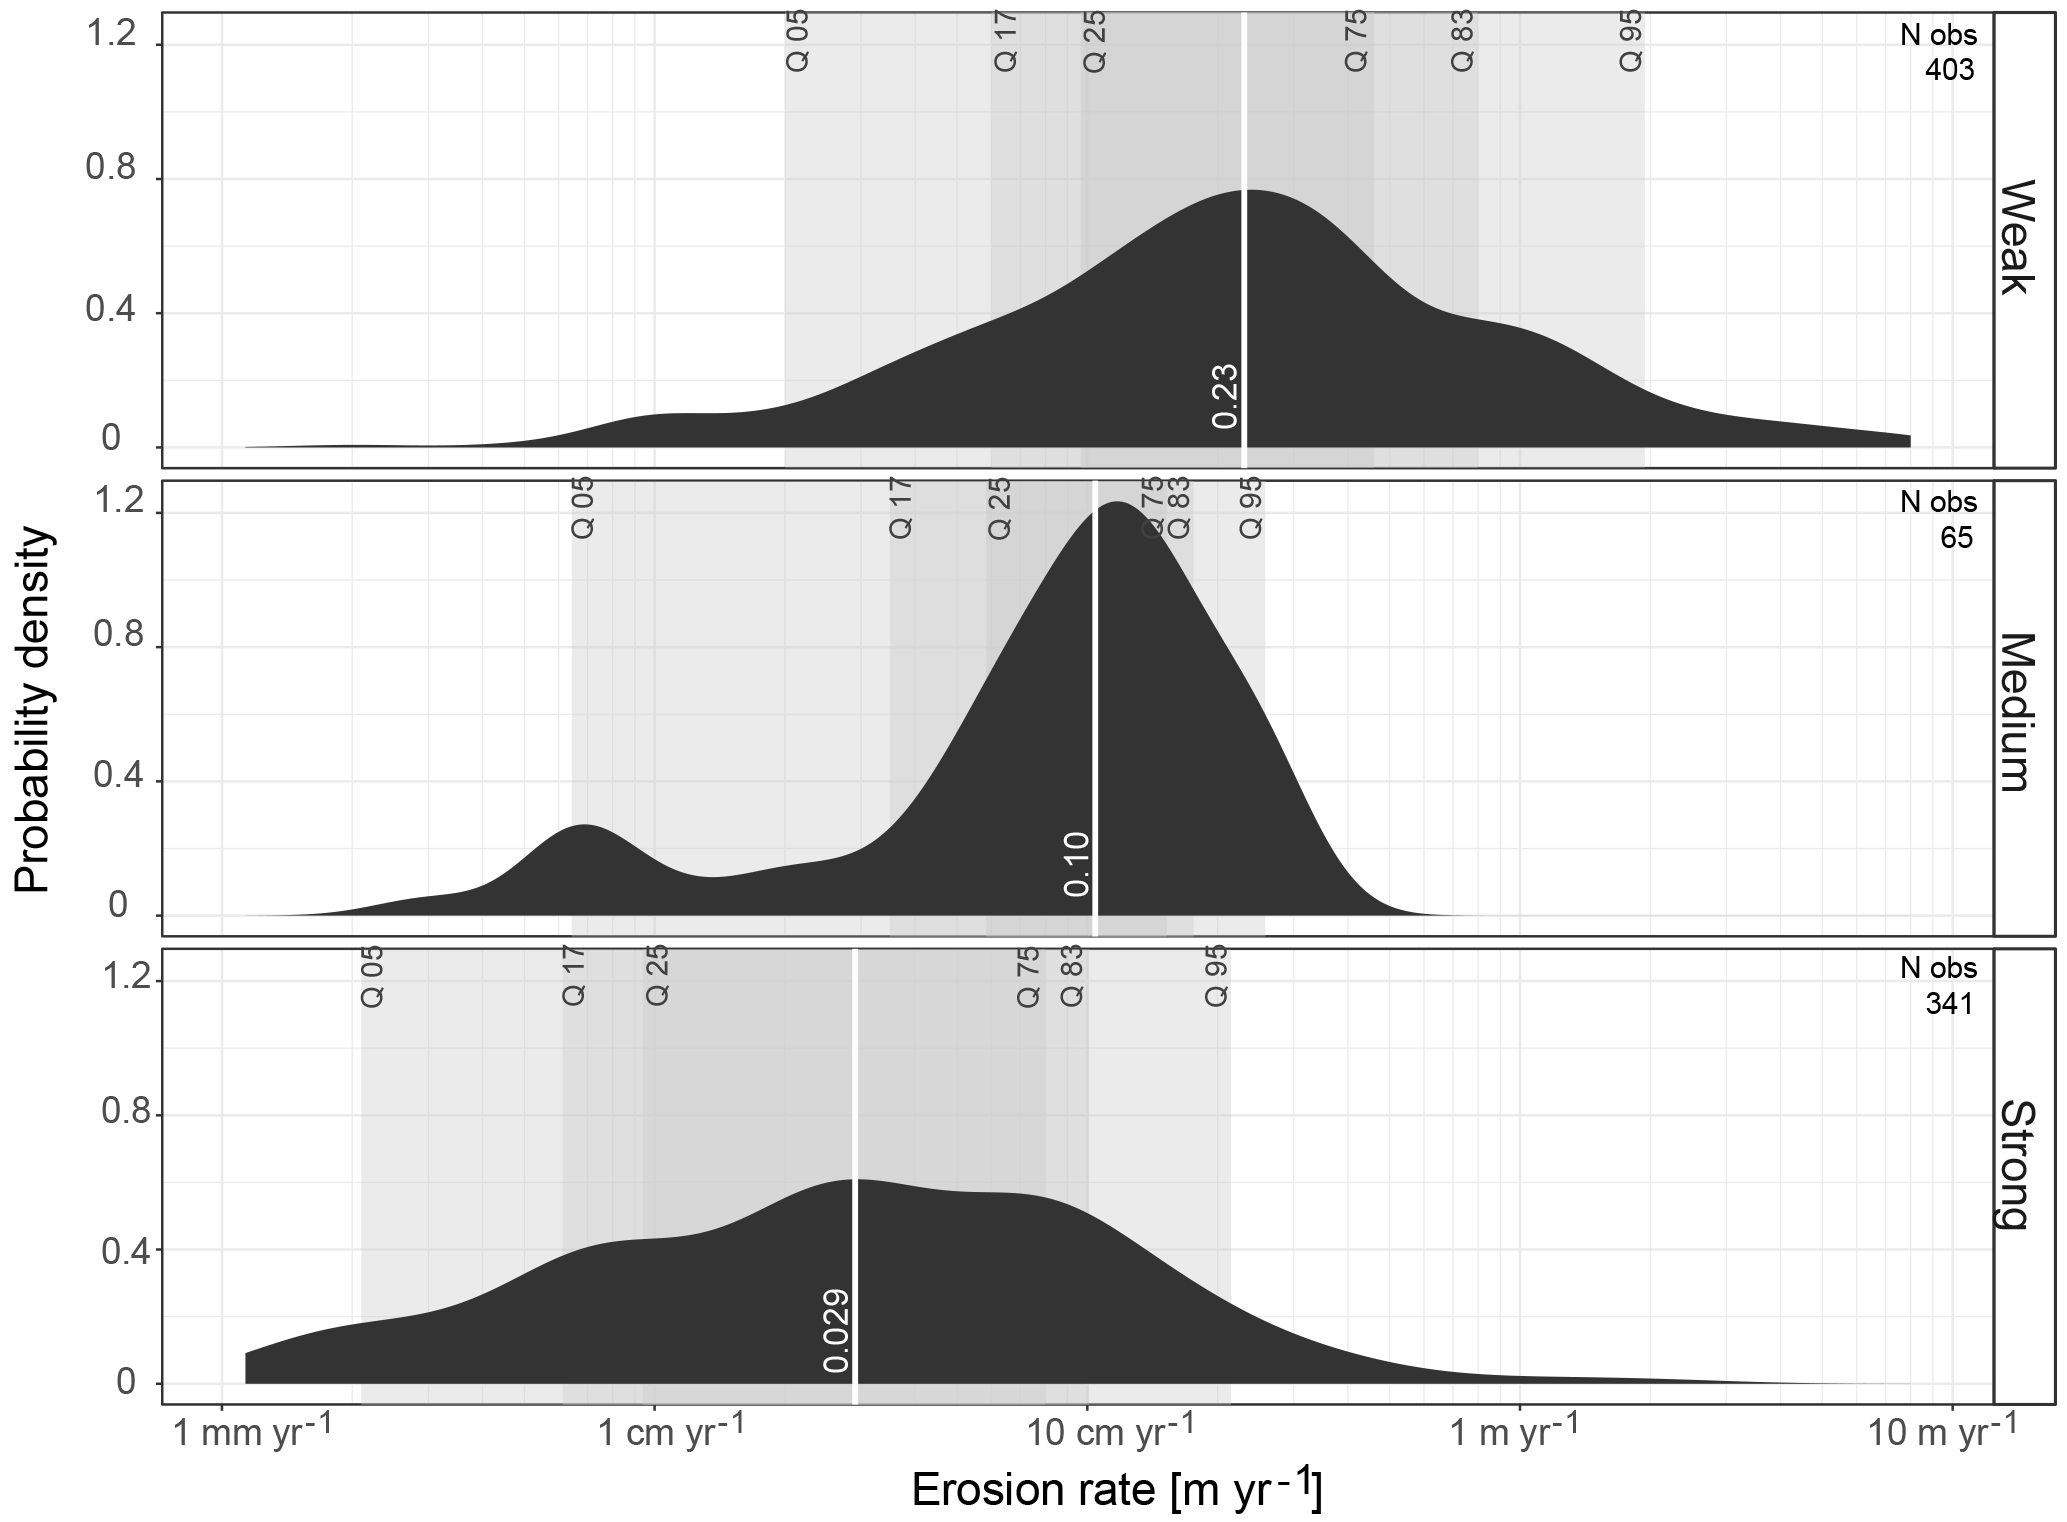
Figure 6Cliff recession rates differentiated using the Hoek and Brown rock mass strength criterion, which merges lithological descriptions and the fracturing/weathering state of the cliff rock.
Aggregation criteria are based on the fields lithology name, weathering, fracturing and comments, in which all published details on rock strength, structural geology, weathering were preserved. Rocks were classed into three resistance classes termed hard, medium and weak. One may note that a similar approach, but with only two classes, was adopted by the EUROSION project consortium (Doody and Office for Official Publications of the European Communities, 2004). The hard rock class clusters granite, gneiss and limestones together. Weak rocks are mainly poorly consolidated rocks (weakly cemented sandstones, glacial tills and glacial sands) or strongly weathered rocks. Weak rocks also noticeably include well studied chalk cliffs. Medium resistant rocks correspond to claystone shales and siltstones.
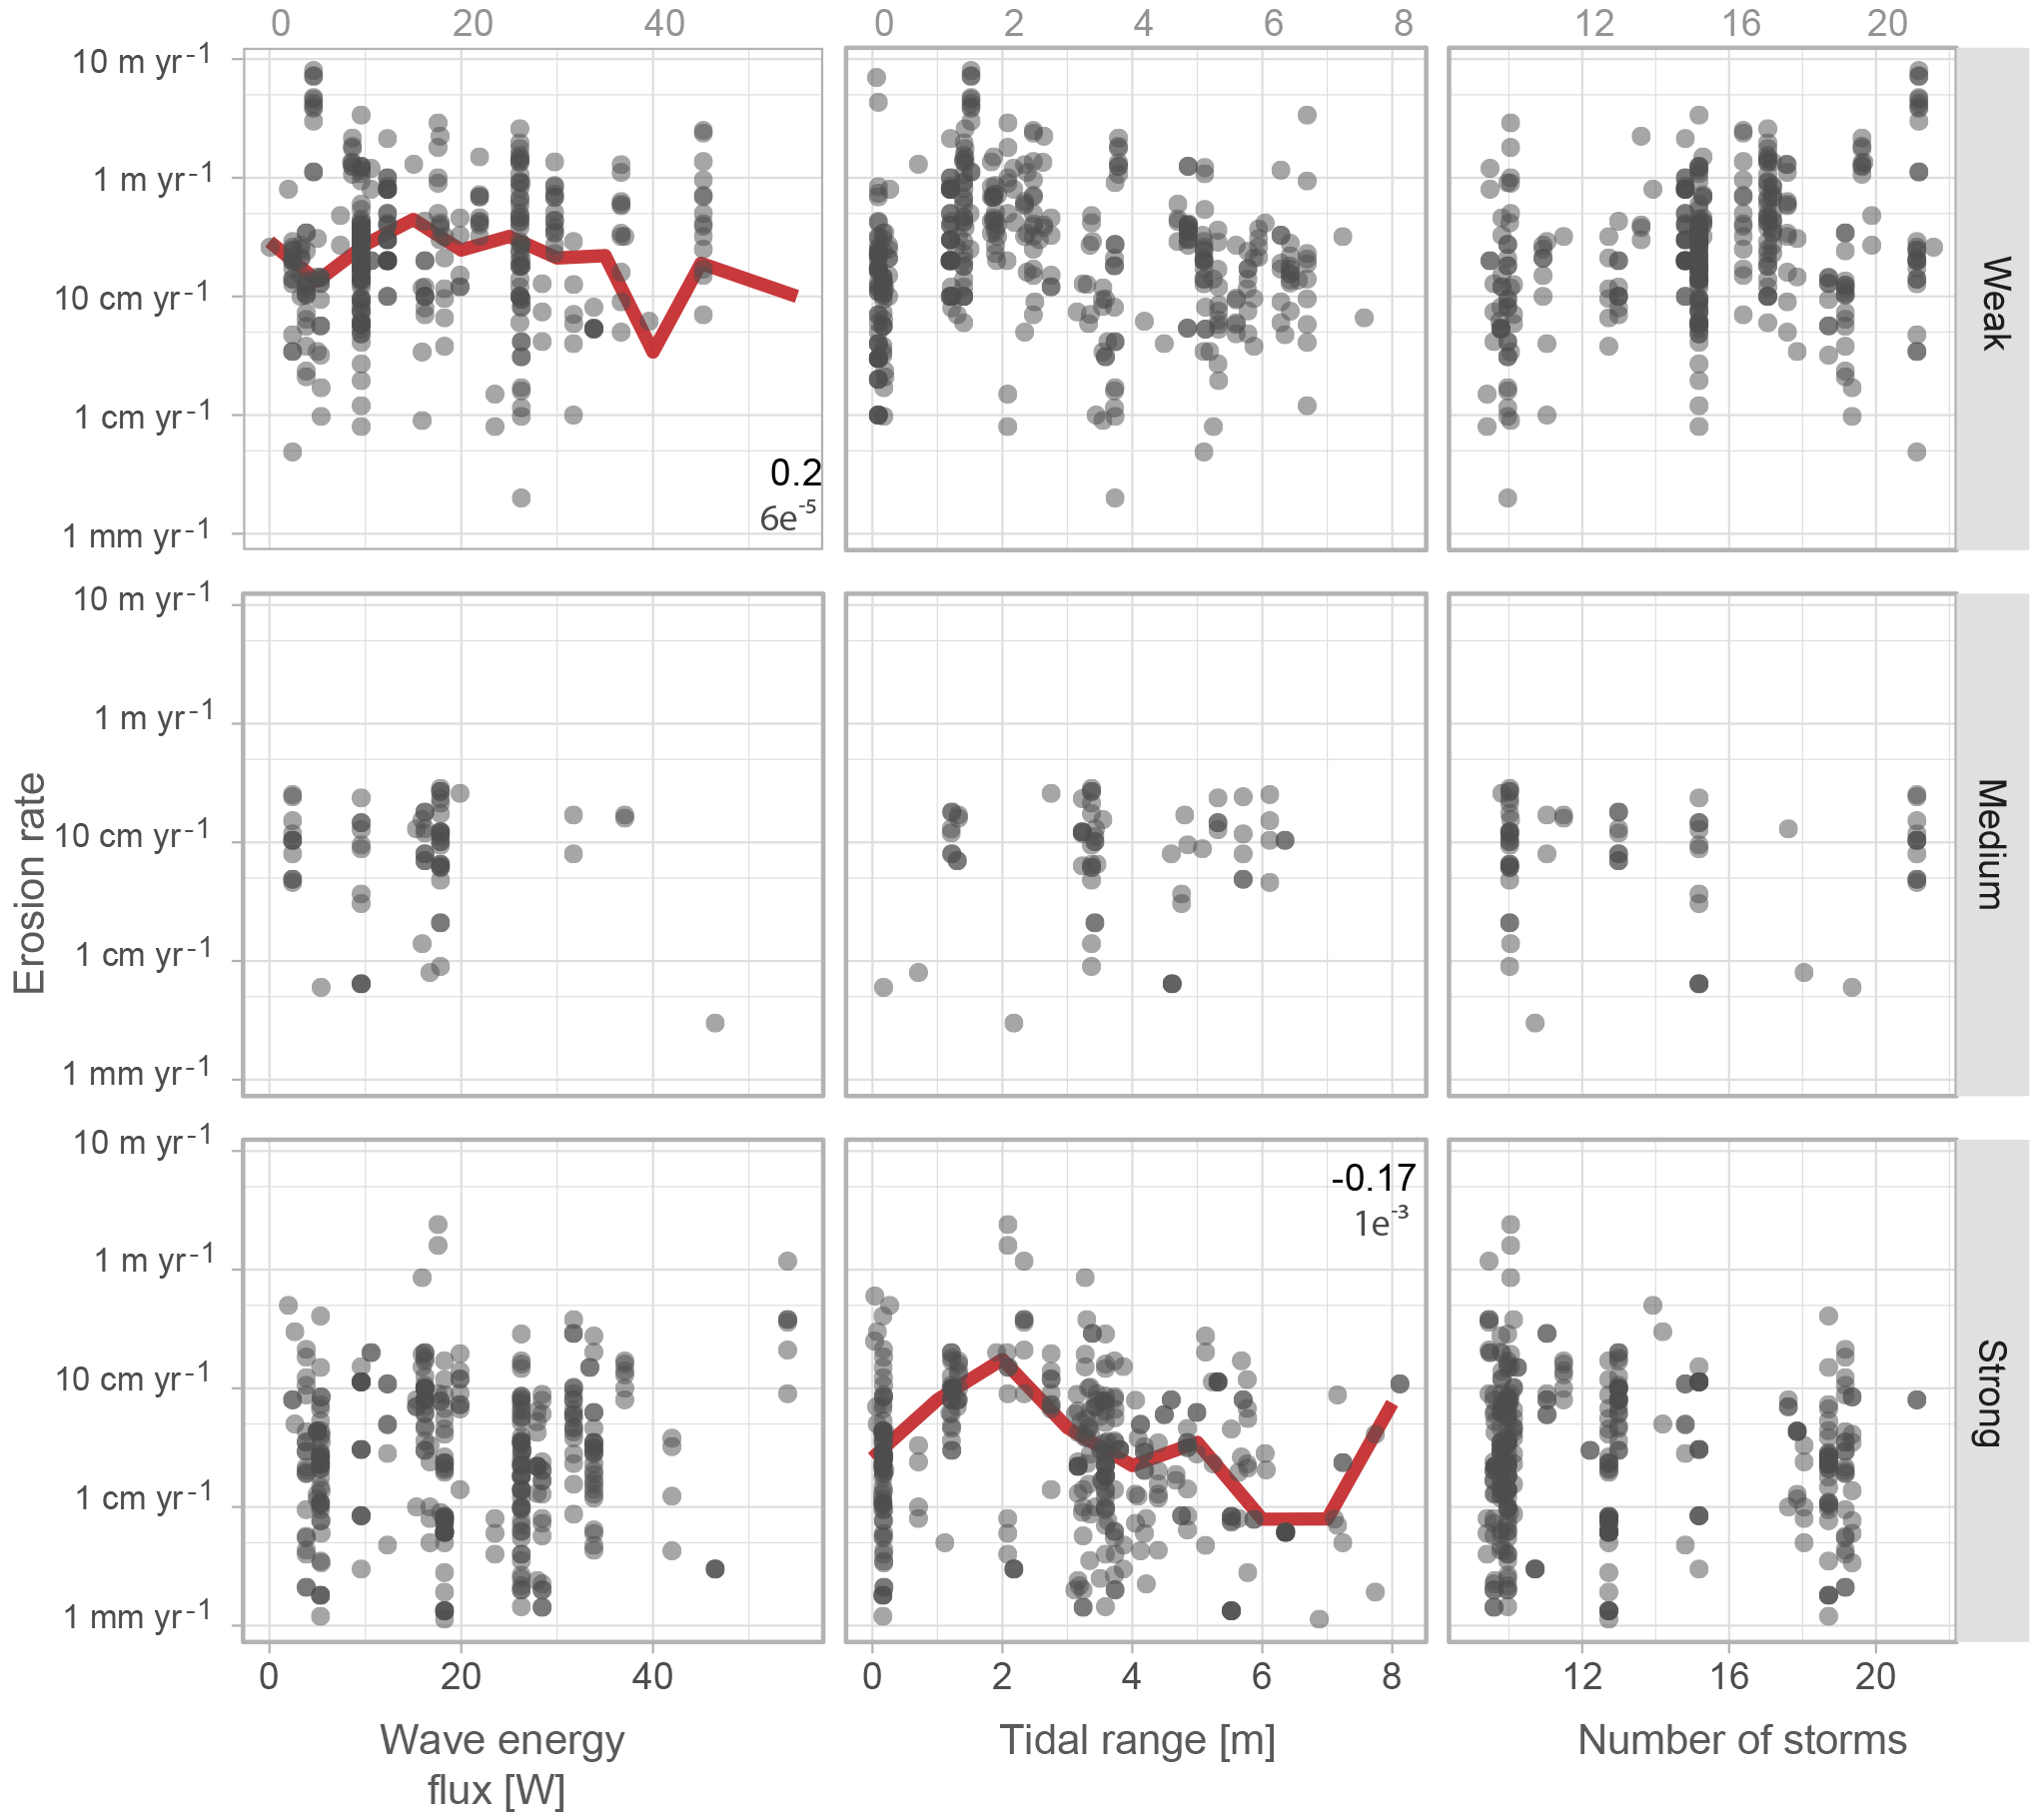
Figure 7Erosion rate versus marine forcings (wave energy flux (W), tidal range (m) and number of storms) for each one of the Hoek and Brown rock resistance class. Lines beneath the scatterplots represent moving median per bin and the numbers are the Spearman correlation coefficients, which were only reported when the p value was significant.
3.1 Database content and completeness
The database is filled with 58 studies, which is comprised of 47 peer-reviewed articles and 11 public national databases, documenting 1530 cliff sites and 1680 erosion rate records. Indeed, some cliff sites were repeatedly measured over different periods. With more than 90 % of fields complete, the database is satisfactorily thorough; however, the constitution of the database highlights some characteristics that are often poorly reported. We previously mentioned the difficulty regarding finding a description of cliff rock weathering and fracturing. Those fields are missing for 98.4 % of the records (corresponding to 53 publications).
3.2 Where was erosion measured?
Studies are mostly concentrated in Europe (42 studies, 1579 records), in Oceania (focused mainly on New Zealand) (3 studies, 94 records) and Northern America (4 studies, 50 records). Asia (2 studies, 4 records) and South America (1 study, 1 record) are poorly represented. No literature was found for the entire African continent. This lack is confirmed by the absence of a chapter about Africa in Kennedy et al. (2014). Study locations are displayed in Fig. 4.
3.3 How was erosion measured?
The number of studies has steadily been growing since the mid-1990s (Fig. 5), for every method type. Older studies exist and are present in Sunamura's database, although those papers were not available and/or cliff and measurement descriptions were too poor to be encoded in our database. The most commonly used method is the comparison of aerial photographs or historic maps, which correspond to an easy to apply 2-D method and allow for erosion evaluation spanning several decades. Forty-three studies used this method, which represents 50 % of the published studies and 88 % of the records. The second most used method is 3-D techniques, which have become common since the mid-2000s. This method represented 19 studies (22 % of the published studies) and 5 % of records. Finally, other methods are occasionally used. One-dimensional methods represent 8 studies (9 % of the published studies) and 3.5 % of the records.
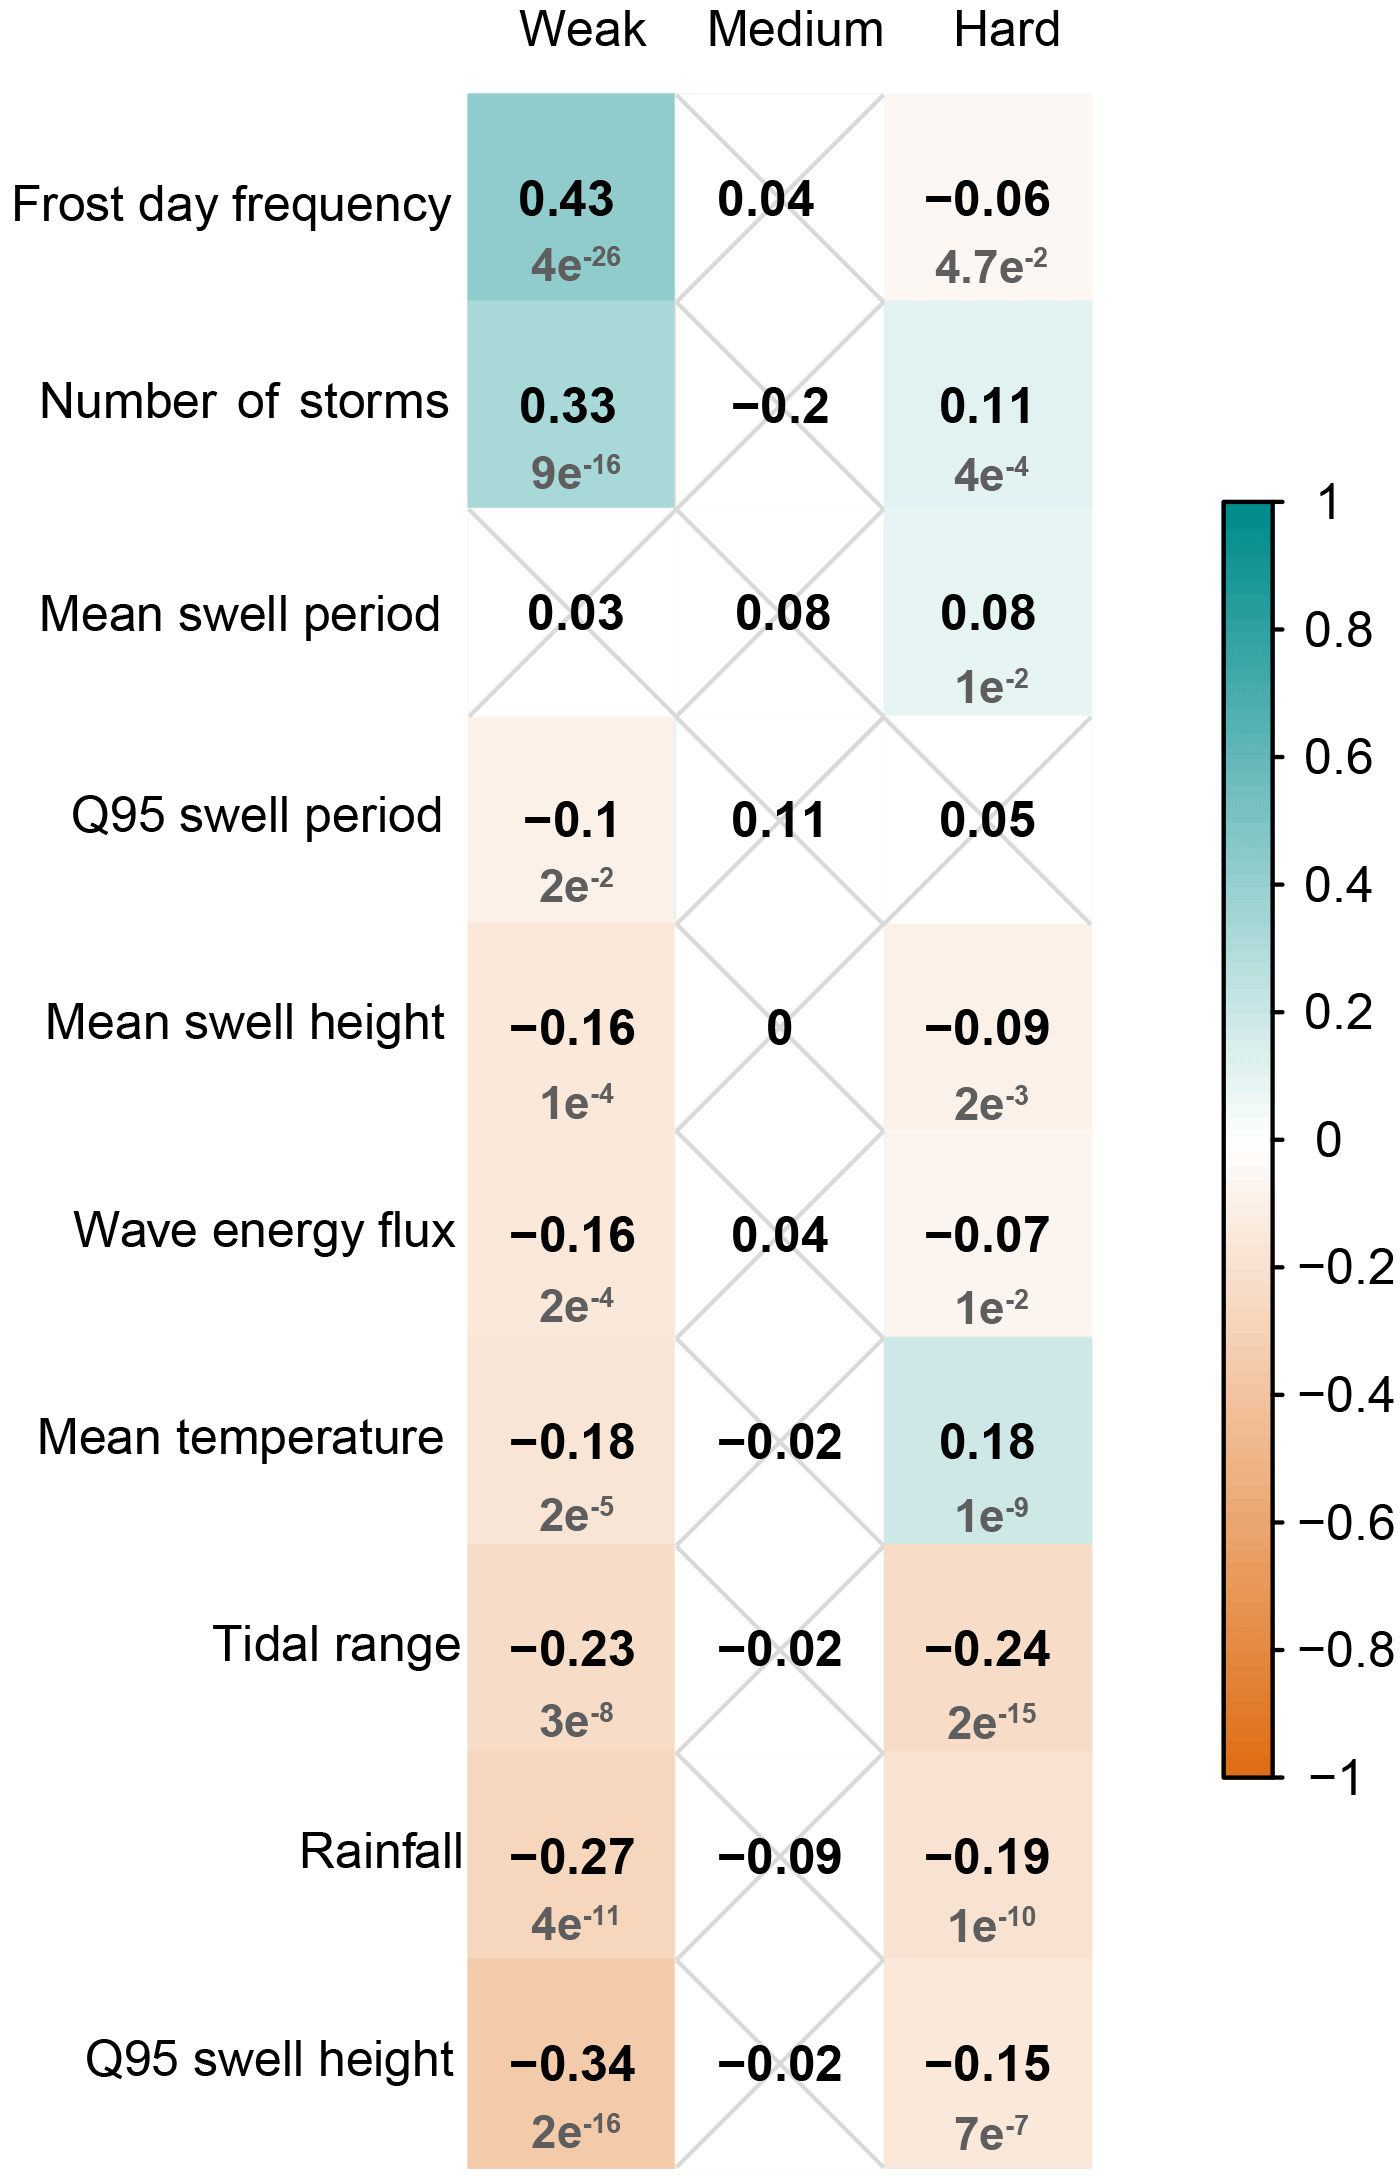
Figure 8Spearman rank correlation matrix between forcing and erosion rate for the three types of rock resistance. Values in black are Spearman correlation coefficients. Grey values are the associated p values, which were only reported when significant (<0.05).
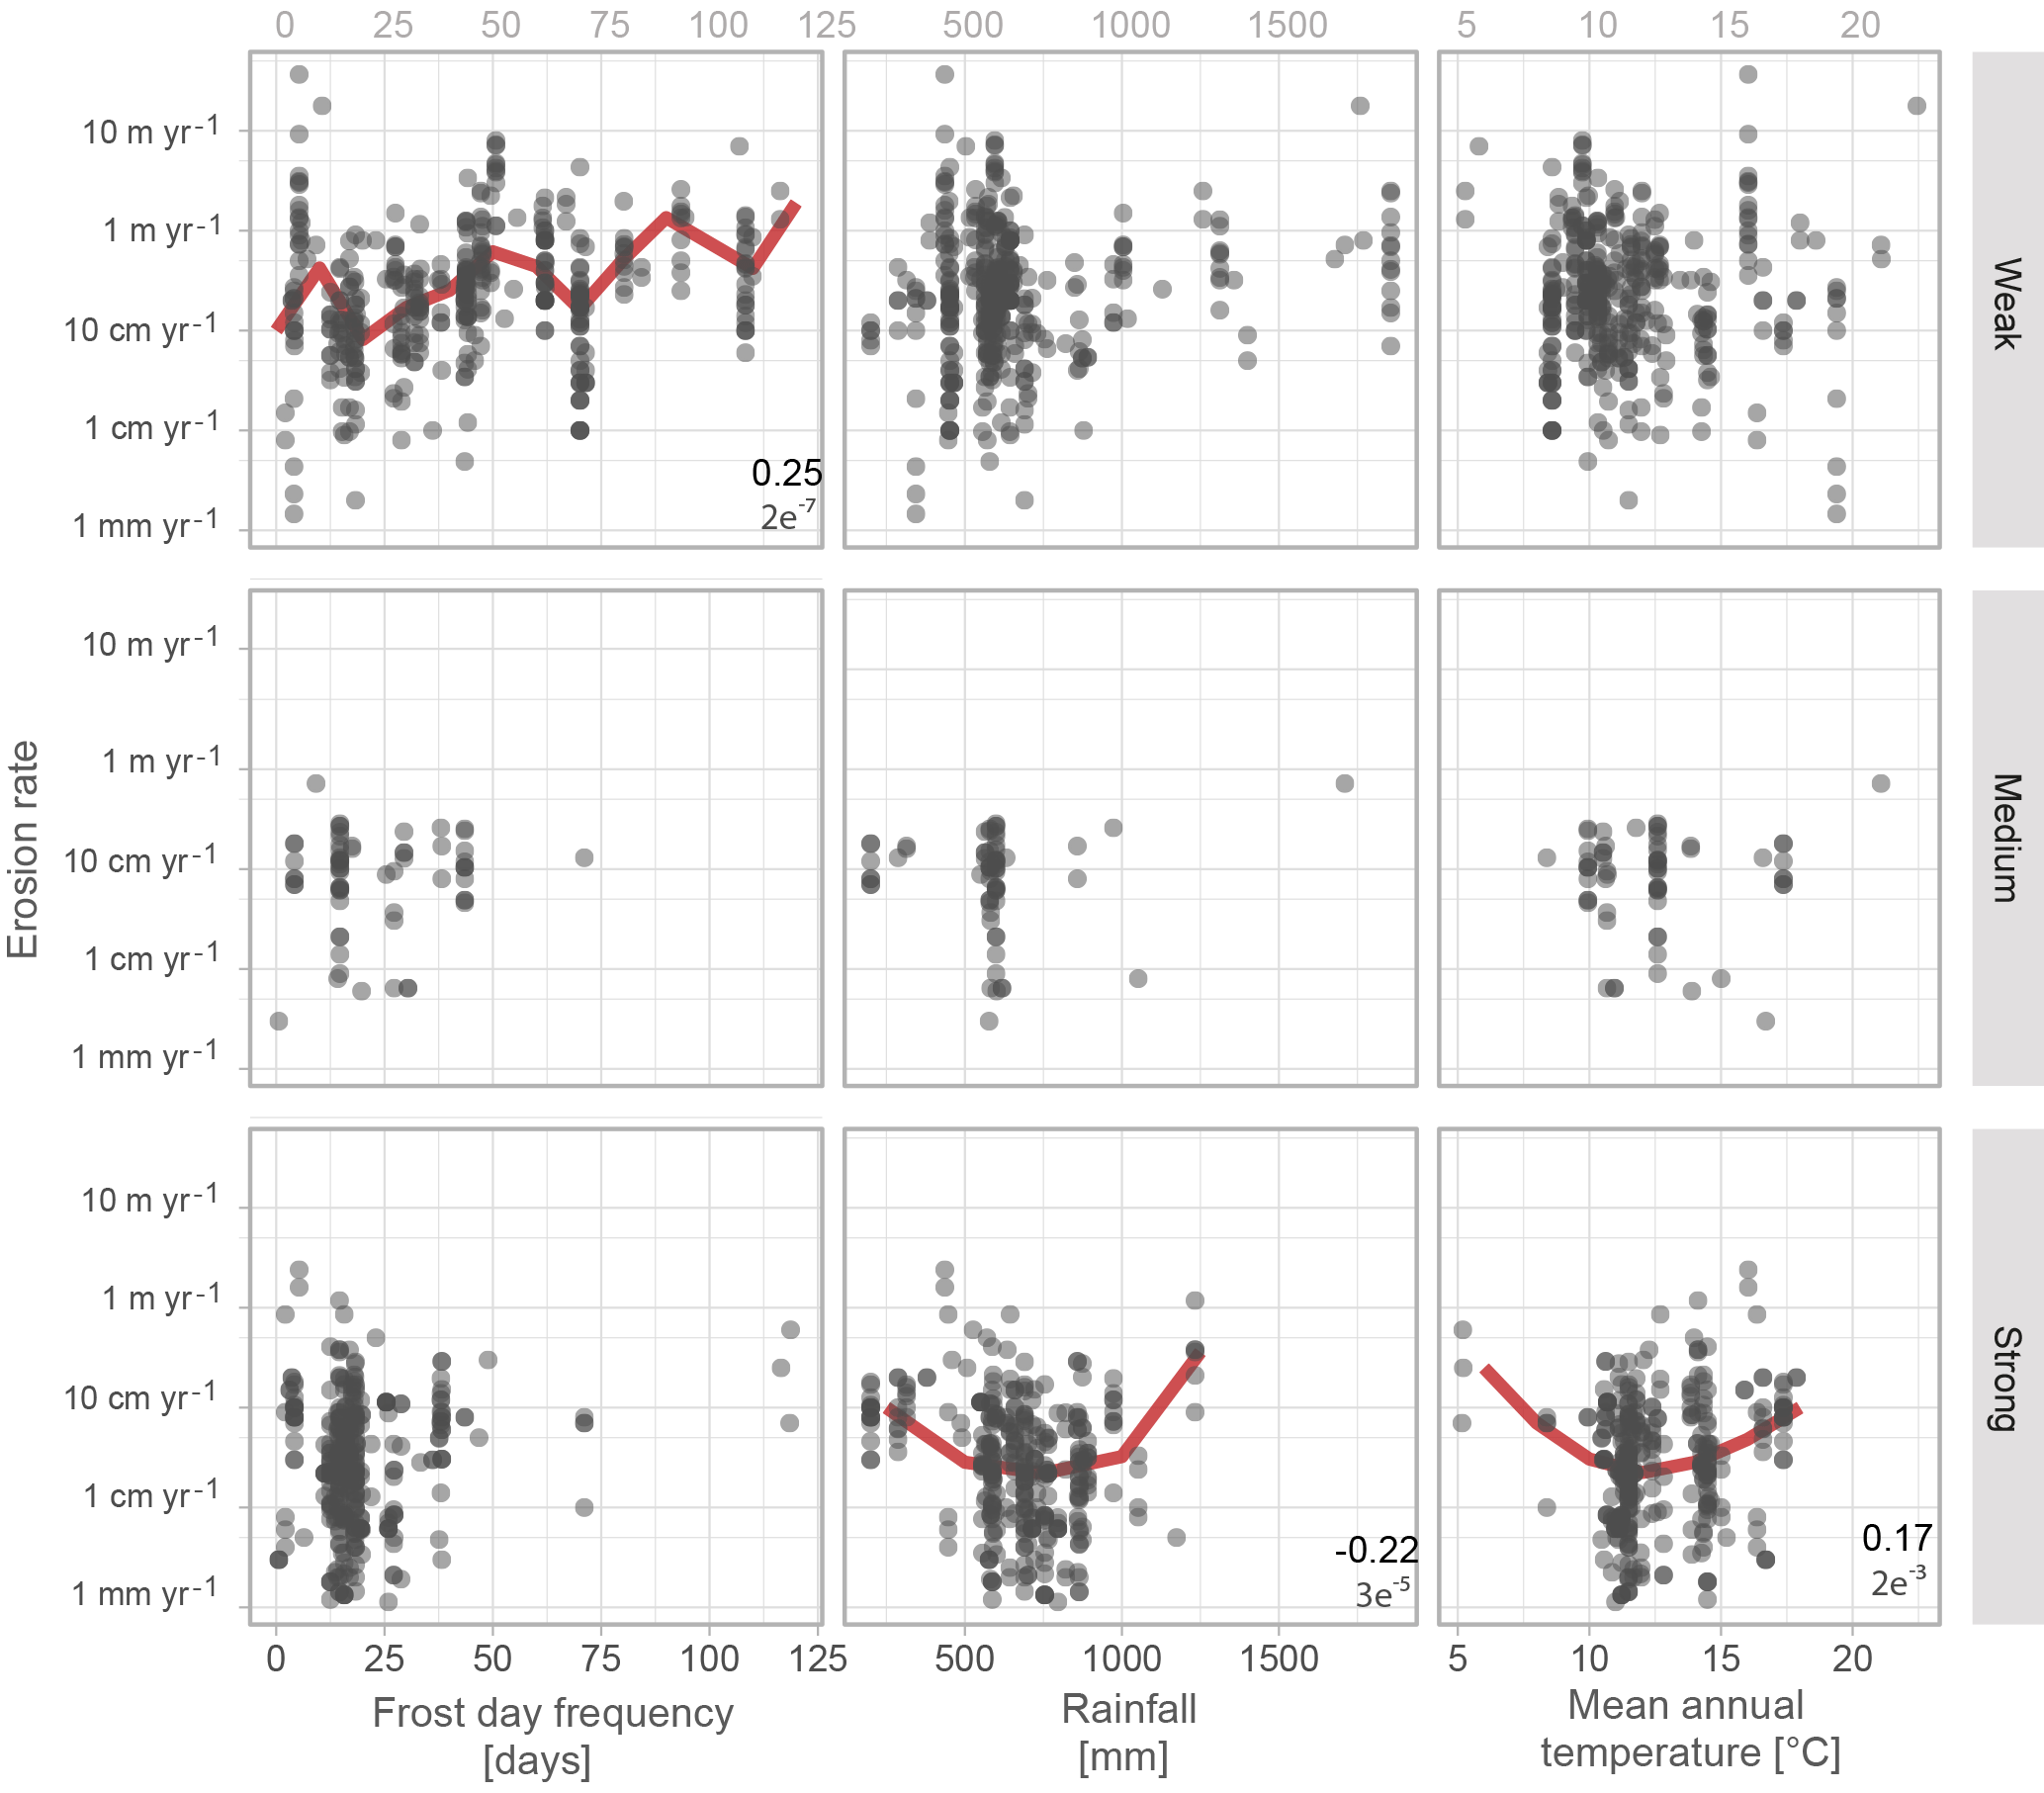
Figure 9Erosion rate versus climate forcings (frost day frequency (days), annual cumulated rainfall and (mm) mean annual temperature (∘C)) for each of the Hoek and Brown rock resistance class. The overprinted lines on the scatterplots represent moving median, and the numbers are the Spearman rank correlation coefficients, which were only reported when the p value was significant ().
Reported studies describe coastal processes along 20 m to 6.4 km stretches of coastline. The median length is 600 m. Total survey durations vary from just 1 month to 7100 years, although half the data lie between 56 and 63 years given the bulk of aerial photograph comparison studies.
3.4 Examining relations between erosion rate and forcings
The purpose of the database is to examine the relationships between erosion rates, site conditions and external forcing. Those links were sought by means of statistical exploration data analysis (known as EDA).
3.4.1 Erosion vs. rock mass properties
One of the first influential factors often pointed to in literature is rock resistance (Benumof et al., 2000; Bezerra et al., 2011; Costa et al., 2004; May and Heeps, 1985). Figure 6 shows the erosion rate distributions for the three rock resistance classes based on Hoek and Brown criterion. Three distinct behaviors can be seen. Hard rock (341 observations) erodes at a median rate of 2.9 cm yr−1 with a median absolute deviation (MAD) of 3.4 cm yr−1. Medium resistance rock coasts (63 observations) erode at a median value of around 10 cm yr−1, with a MAD of 7.8 cm yr−1. Due to the small number of observation of medium resistance rocks, this resistance class should be considered carefully. Finally, weak rocks (403 observations) erode at a median value of 23 cm yr−1 and reach rates higher than 10 m yr−1 with a MAD of 25 cm yr−1.

Figure 10Ranges of erosion rates within different lithology. Comparison between the study by Woodroffe 2002 and this study.
Macroscopic rock mass strength classes, although possibly crude, exhibit the ordered behavior expected from the literature: weak rocks erode faster than medium strength rocks, and medium strength rocks erode faster than hard rocks. Central erosion rate values increase by a factor of 2 to 3 from one class to the next.
These values are in agreement with Woodroffe's work (2002); however, even if those distributions are distinct, they are broadly spread and multimodal.
3.5 Erosion vs. marine forcings
In order to explore the influence of sea aggression, several variables were implemented in the database describing mean sea agitation and tidal range, and sea agitation during extreme events. All the variables concerning swell are strongly correlated. Hence, only three independent marine parameters are analyzed in the scatterplots in Fig. 7: tidal range, wave energy flux and the number of storms.
All scatterplots appear to be widely spread and do not show simple linear relations. Indeed, the Spearman rank correlation coefficients, which evaluate monotonic relations between two variables, are low (Fig. 8). Furthermore, many tentative correlations cannot be trusted (p value >0.05). These correlations and the associated p values are given in Fig. 8. Exploration of marine forcings indicate that no forcings have an apparent effect on erosion rates; the exception to this finding is a weak relationship between tidal range and erosion rates, which suggests higher erosion for tidal ranges between 1 and 3 m (although this is not visible for medium resistant rocks).
3.6 Erosion vs. climatic forcings
Concerning climatic forcings, recession rates are compared to temperature variation, frost frequency and the amount of rainfall. As for marine forcings, data is very scattered (Fig. 9). Frost day frequency and rainfall show a positive trend with erosion rate for weak resistance rocks. Poorly consolidated rocks represent the large majority of rock types present in cold (>50 frost day per year) and rainy climates (> 1000 mm yr−1) in the database. Only a few studies concern harder rocks in cold climates. However, even if a trend exists, data are widely distributed and the Spearman rank correlation coefficient is low (0.25 for frost and 0.07 for rainfall). Mean annual temperature does not show any clear correlation with erosion rate.
4.1 Comparison to previous studies
The GlobR2C2 database provides a quantitative overview of the current coastal rocky cliff erosion knowledge. This database is the first update since Sunamura's 1992 seminal publication and adds 54 additional quantitative studies to the scientific debate. Its design allows for an assessment of the drivers of erosion. Historically, Woodroffe (2002) has already tried linking erosion with lithology in a broadly reproduced graphic. This graph shows a clear pattern of increasing erosion rates with decreasing rock resistance. GlobR2C2 updates this classic graph using the same lithological classification (Fig. 10). New knowledge does not change historical views; however, it narrows the assumed erosion rate ranges down, both towards lower and higher rates. We also observe that supposed hard rocks such as granites or basalts can erode as quickly as 1 m yr−1. This is because resistance to erosion does not depend on the lithological category alone, but also on the degree of weathering, jointing, folding, etc. (Cruslock et al., 2010; Stephenson and Naylor, 2011; Sunamura, 1992). Figure 10, presented at a conference for sedimentologists, triggered strong reactions due to the lack of a robust rock classification in their community. This outcome confirms the decision to use a less debatable rock resistance criterion than lithology, although this geotechnical criterion is not perfect either – it was inferred based upon authors' descriptions of cliffs, meaning that it includes some interpretation and a degree of uncertainty.
4.2 What knowledge does GlobR2C2 compile?
The GlobR2C2 database is based on bibliographic references as well as models and reanalysis, which are used as proxies for forcings; some biases are inherent to this kind of approach. The next paragraphs focus on different aspects of these limitations due to (i) the use of cliff retreat rate as a proxy of erosion, (ii) the use of models and reanalyses as proxies of forcing and (iii) the use of peer-reviewed journals.
4.2.1 Erosion rates, study duration and stochastic behavior
Statistical exploratory data analysis is a way to dissolve local particularity into a global analysis. Nonetheless, including every quantitative study implies mixing rates measured via different methods, accuracy, and spatial and temporal extents, which could be a source of bias. Erosion is stochastic: the occurrence of a big rare event would influence the actual figure of the observed retreat rate. Rohmer and Dewez (2013) for instance, describe statistical indicators for testing the outlier nature of very large rockfalls, with methods borrowed from hydrology, seismology and financial statistics. These indicators were applied to a chalk cliff site in Normandy (northern France) in Dewez et al. (2013). During the 2.5 year terrestrial lidar monitoring period, a massive 70 000 m3 rockfall caused a local cliff top retreat of more than 19 m (Dewez et al., 2013). That is more than one hundred years' worth of average retreat in one event. Consequently, the estimated annual cliff recession rate rose from 13 to 0.94 m yr−1, a 7-fold increase, just by including this random and definitely unrepresentative event (Dewez et al., 2013). Further examples of this can be seen in other studies covering the same site. Costa et al. (2004) estimated the recession rate to be ca. 15 cm yr−1 in 29 years from aerial photos; whilst Regard et al. (2012), using millennial recession rates from 10Be accumulated in flint stones exposed in the chalk coastal platform, obtained 11 to 13 cm yr−1 over 3000 years.
GlobR2C2 addresses the concern of non-representative erosion values by compiling all studies available online, and retaining information from all sites and survey periods. Therefore, the actual dispersion of recession rate values is preserved, which allows for the recognition outlying values (Fig. 11).
4.2.2 Forcing proxies
While publication-derived cliff recession rates and cliff conditions could be forced into a coherent database framework, environmental forcings were so scarcely and heterogeneously documented that the same rationalization process was not possible on the basis of publication alone. Instead, publicly available global climatic and sea condition databases were used. These databases present the advantage of being spatially and temporally continuous thanks to reanalyzed climate and sea state models. Their principal limitation is their coarse-grained definition compared to site specificities. Nevertheless, they document external forcings (i) in a uniform fashion (regular spatial and temporal sampling steps), (ii) for the entire globe and (iii) reflect forcing condition for durations spanning several decades. Consequently, even if regional or continental datasets offer higher resolution information in space or time, the global extent ensures that all cliff sites worldwide are uniformly documented.
4.2.3 Literature biases as future tracks to improve cliff evolution understanding
GlobR2C2's worldwide compilation shows that research in this domain is very active. A large body of quantitative data already exist. However, even if data coverage is somewhat global, publications have been found to focus primarily on a few western countries. This finding also reflects the strategy of literature search adopted: only international and national literature published in English, French or Spanish were compiled. Due to the language barrier, we are aware that studies in Russian, German or Japanese, among other languages, were unwillingly omitted.
Spatially, our search strategy did not flag scientific literature on the evolution of African and South American cliffs. Cliff recession studies appears to be focused on the richest areas where economically valuable coastal assets are exposed to losses. This geographic distribution induces an overrepresentation of temperate climates and a limited presence of some extreme climates or wave conditions like equatorial or polar regions. These underrepresented extrema could be the key to understanding the effects of climate and wave conditions on cliff erosion.
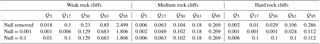
Furthermore, studies focus on fast eroding coasts because they represent bigger risks and also due to of methodological limitation. Indeed, the French CEREMA study provides the majority of the erosion values for hard rocks (265 values from 343, 77 %) and medium rocks (47 values from 66, 71 %). Without this systematic study soft rock represents 75 % of measured cliff retreat. This fact biased the analysis by mostly documenting erosion distribution in higher values. The weight of this bias can be appreciated thanks to the French CEREMA study. This study contains null erosion values for coastal sectors where the cliff was not seen to recess in a detectable manner on historical photographs. However, this detection threshold is deemed to be of the order of 10 cm yr−1 (Perherin et al., 2012), which is rather high. Therefore, null recession could reflect erosion situations anywhere on the spectrum from 0 to 10 cm yr−1. These null values represent 67 % of the studies of rocky coasts, which means that slowly eroding rocky coasts are common and ignoring this information can affect conclusions. In order to check the importance of the bias induced by those values, we explored two extreme cases. The erosion value was set to either a small value of 1 mm yr−1 or to the detection threshold of 10 cm yr−1. Table 2 shows the influence of the null value on the distribution of the erosion rate for the three Hoek and Brown rock strength classes. While the median and quantile absolute values are affected by the value attributed to null observations, the expected order of rock sensitivity to erosion is maintained. Weak rocks erode at higher rates than medium and hard rock. Therefore, we trust this result. Further, the dependency relationships flagged earlier remain. A weak positive correlation still exists between frost day frequency, and a maximum tidal efficiency for the tidal range between 1 and 3 m still is observed.
4.2.4 Cliff retreat vs. platform evolution and rock coast erosion
The cliff retreat rates discussed here cannot capture the overall rock coast erosion complexity. In particular, it is obvious that the rock shore platform coevolves with the cliff (Moses and Robinson, 2011; Sunamura, 1992; de Lange and Moon, 2005). Sunamura (1992) proposes that the shore platform erodes vertically at a rate proportional to its dip and cliff retreat. The processes driving this vertical erosion are numerous (cf. Introduction). It has also been proposed that the shore platform width reflects the total cliff retreat since the Holocene transgression; thus, it also reflects the average rock coast erosion since then (Regard et al., 2012). Applied to our findings, these ideas imply that harder rocks, leading to slower cliff retreat, come with steeper platform slopes.
On the one hand, platform width may be a powerful proxy for long-term cliff retreat. However, this analysis is not currently possible due to the fact the seaward platform boundary is not obvious (Kennedy, 2015), and there is also a lack of worldwide information on rock shore platform widths. On the other hand, this idea is debated, because it implicitly favors the static model for the evolution of shore platforms instead of the equilibrium model (Dickson et al., 2013; Moon and de Lange, 2008; Stephenson, 2008; de Lange and Moon, 2005).
Beyond its width, the rock platform behavior encompasses the dynamics of the scree apron lying on it and possibly shielding it from sea action (Regard et al., 2013). Indeed, cliff collapse is the only stage within the platform/cliff erosion cycle leading to apparent retreat. This transitory character could lead to long-term cliff retreat rate under- or over-estimation. Working with an important dataset, like the one presented here, averages data variability, ensuring the extrema are not overrepresented (cf. Sect. 4.2.1).
4.2.5 Toward a new rocky coast cliff research agenda
Table 2Distribution characteristics of cliff erosion rates (in m yr−1) compiled from publications in GlobR2C2 and differentiated by Hoek and Brown rock resistance types. The different lines in the table reflect how the characteristic distribution values change when the erosion rate value given to cliff instances where erosion rates were smaller than the detection threshold in the CEREMA study are changed (n instances for N total observations). Null values were handled in three different ways: (i) insignificant rates were removed from the distribution computation; (ii) null values were used and assigned an arbitrary low erosion rate of 0.001 m yr−1; and (iii) null values were used and assigned an arbitrary rate of 0.1 m yr−1.
This bibliographic synthesis has highlighted the strengths and weaknesses of the current rocky coast research efforts. The trend over the last three decades has gone towards increasing the quality and the resolution of cliff recession data and documenting a growing number of sites, which is positive. However, what this study highlights is the lack of a description of critically useful parameters to aid in understanding cliff evolution dynamics, which includes the following: (i) cliff height; (ii) finer rock mass characteristics descriptions, in particular weakening phenomena such as weathering and fracturing; and (iii) foreshore descriptions, in particular the type (sand beach/pebble beach/rock platform) and geometry (elevation, slope, width) of the foreshore. Moreover, the geographical distribution of the sites studied highlights a major gap in knowledge regarding extreme climates (tropical, equatorial and glacial), slowly retreating cliffs and medium resistance rock types. We also found that literature concerned with cliff retreat was not simultaneously trying to link shore platform processes to cliff retreat or to how local variations specifically affected cliff retreat.
Compared to continental cliffs, coastal cliffs obviously erode more quickly due to the presence of the sea. The GlobR2C2 v1.0 database compiles ca. 2000 coastal rocky cliff retreat data from an online global literature search published before 2016. It is the first attempt of its kind since Sunamura's seminal publication in 1992. The investigated period adds information arising from the quantitative revolution of lidar technology and the use of the structure from motion (SfM) technique, which is accessible to scientists with little background in photogrammetry, in addition to the massive release of aerial photographic archives from mapping agencies in western countries. The data compiled in GlobR2C2 is heterogeneously distributed in terms of retreat rates, geographical location, cliff nature and climate settings. Even if further research should aim at completing little studied geomorphic contexts of the globe, existing information clearly shows that cliff retreat is most clearly governed by the lithological nature of the cliffs. The dependence of cliff recession rates on rock types is best expressed using a geotechnical parameter, the Hoek and Brown (1997) macroscopic rock mass strength parameter. Rocks classified as weak (recession rate median: 23 cm yr−1) erode 2–3 times faster than medium strength rocks (median rate: 10 cm yr−1); whilst medium strength rocks erode 2–3 times faster than hard rocks (median rate: 2.9 cm yr−1). Using a lithology denomination following the historical graph from Woodroffe (2002) (Fig. 10), lithologic types exhibit a similarly ordered behavior (Fig. 6), even if geologists contest the robustness of these denominations as proxies for rock strength.
Together with cliff settings compiled from publications, GlobR2C2 also records continental climate and marine conditions at study sites from reanalyzed models for their global, spatial and temporal sampling regularity. Both forcings exhibit a weak relationship with cliff recession rates. However, in relative terms, climate (i.e., frost days frequency) exhibits a stronger influence than marine forcing. The influence of the sea is only slightly visible in this dataset through the maximum efficiency of erosion for tidal ranges between 1 and 3 m.
Our data divides rocky coasts into three classes of resistance, following the Hoek and Brown parameter. The most resistant (least resistant) rocks are found to lead to retreat rates of less than 10 cm yr−1 (83 % quantile), whilst the least resistant rocks are found to lead to retreat rates of up to 85 cm yr−1. Rocks with medium resistance have not been studied adequately enough to give a precise range of retreat rates. However, climate seems to be more efficient and frost seems to have the strongest influence.
We conclude at this stage that coastal rocky cliff erosion is primarily driven by cliff settings with second-order but non-negligible modulations from marine and continental forcings (Fig. 2). These findings are of primary interest for coastal erosion models, which currently primarily focus on marine forcing (Anderson et al., 1999; Limber et al., 2014; Trenhaile, 2000).
The GlobR2C2 data are available in the Supplement.
The supplement related to this article is available online at: https://doi.org/10.5194/esurf-6-651-2018-supplement.
MP built the database with the help of YA. Filling of the database and its analysis were performed by MP with help and advice from VR and TD. MP wrote the paper with contributions from the other authors.
The authors declare that they have no conflict of interest.
Mélody Prémaillon's PhD fellowship was funded in equal part by BRGM (the
French geological survey) and the French region Midi-Pyrénées. Laurent
Roblou and Dominique Astruc are warmly thanked for advice about tide
calculation and wave power, respectively. We thank Sebastien Carretier,
Christophe Garnier, Elise Nardin and Delphine Rouby for their support and
wise advice during committee meetings.
Edited
by: Mary Bourke
Reviewed by: Larissa Naylor and Cherith Moses
Anderson, R. S., Densmore, A. L., and Ellis, M. A.: The generation and degradation of marine terraces, Basin Res., 11, 7–19, 1999. a, b
Benumof, B. T., Storlazzi, C. D., Seymour, R. J., and Griggs, G. B.: The relationship between incident wave energy and seacliff erosion rates: San Diego County, California, J. Coastal Res., 43, 1162–1178, 2000. a, b
Bezerra, M. M., Moura, D., Ferreira, Ã., and Taborda, R.: Influence of Wave Action and Lithology on Sea Cliff Mass Movements in Central Algarve Coast, Portugal, J. Coastal Res., 275, 162–171, https://doi.org/10.2112/JCOASTRES-D-11-00004.1, 2011. a
Caplain, B., Astruc, D., Regard, V., and Moulin, F. Y.: Cliff retreat and sea bed morphology under monochromatic wave forcing: Experimental study, C. R. Geosci., 343, 471–477, https://doi.org/10.1016/j.crte.2011.06.003, 2011. a, b
Carrère, L., Lyard, F., Cancet, M., Guillot, A., and Roblou, L.: FES2012: A new global tidal model taking advantage of nearly 20 years of altimetry, available at: http://www.legos.obs-mip.fr/equipes/ecola/projets/fes2012 (last access: 6 August 2018, 2012. a
Castelle, B., Marieu, V., Bujan, S., Splinter, K. D., Robinet, A., Sénéchal, N., and Ferreira, S.: Impact of the winter 2013–2014 series of severe Western Europe storms on a double-barred sandy coast: Beach and dune erosion and megacusp embayments, Geomorphology, 238, 135–148, https://doi.org/10.1016/j.geomorph.2015.03.006, 2015. a
Choi, K. H., Seong, Y. B., Jung, P. M., and Lee, S. Y.: Using cosmogenic 10Be dating to unravel the antiquity of a rocky shore platform on the west coast of Korea, J. Coastal Res., 28, 641–657, 2012. a
Costa, S., Delahaye, D., Freiré-Diaz, S., Di Nocera, L., Davidson, R., and Plessis, E.: Quantification of the Normandy and Picardy chalk cliff retreat by photogrammetric analysis, in: Geological Society, London, Engineering Geology Special Publications, 20, 139–148, 2004. a, b
Cruslock, E. M., Naylor, L. A., Foote, Y. L., and Swantesson, J. O. H.: Geomorphologic equifinality: A comparison between shore platforms in Hoga Kusten and Faro, Sweden and the Vale of Glamorgan, South Wales, UK, Geomorphology, 114, 78–88, https://doi.org/10.1016/j.geomorph.2009.02.019, 2010. a, b
Danielson, J. J. and Gesch, D. B.: Global multi-resolution terrain elevation data 2010 (GMTED2010), Open-File Report 2011–1073, US Geological Survey, 2011. a
Dee, D. P., Uppala, S. M., Simmons, A. J., Berrisford, P., Poli, P., Kobayashi, S., Andrae, U., Balmaseda, M. A., Balsamo, G., Bauer, P., Bechtold, P., Beljaars, A. C. M., van de Berg, L., Bidlot, J., Bormann, N., Delsol, C., Dragani, R., Fuentes, M., Geer, A. J., Haimberger, L., Healy, S. B., Hersbach, H., Hólm, E. V., Isaksen, L., Kållberg, P., Köhler, M., Matricardi, M., McNally, A. P., Monge-Sanz, B. M., Morcrette, J.-J., Park, B.-K., Peubey, C., de Rosnay, P., Tavolato, C., Thépaut, J.-N., and Vitart, F.: The ERA-Interim reanalysis: configuration and performance of the data assimilation system, Q. J. Roy. Meteorol. Soc., 137, 553–597, https://doi.org/10.1002/qj.828, 2011. a
de Lange, W. P. and Moon, V. G.: Estimating long-term cliff recession rates from shore platform widths, Eng. Geol., 80, 292–301, https://doi.org/10.1016/j.enggeo.2005.06.004, 2005. a, b
Dewez, T., Rohmer, J., Regard, V., and Cnudde, C.: Probabilistic coastal cliff collapse hazard from repeated terrestrial laser surveys: case study from Mesnil Val (Normandy, northern France), J. Coastal Res., 65, 702–707, 2013. a, b, c, d
Dewez, T., Regard, V., Duperret, A., and Lasseur, E.: Shore platform lowering due to frost shattering during the 2009 winter at mesnil Val, English channel coast, NW France: Shore Platform Frost Shattering – Channel Coast, France, Earth Surf. Proc. Land., 40, 1688–1700, https://doi.org/10.1002/esp.3760, 2015. a
Dickson, M., Ogawa, H., Kench, P. S., and Andrew, H.: Sea cliff retreat and shore platform widening: steady state equilibrium?, Earth Surf. Proc. Land., 38, 1046–1048, https://doi.org/10.1002/esp.3422, 2013. a
Doody, P. and Office for Official Publications of the European Communities, (Eds.): Living with Coastal Erosion in Europe: Sediment and Space for Sustainability, Office for Official Publications of the European Communities, Niederlande, mai 2004 Edn., 2004. a
Duperret, A., Taibi, S., Mortimore, R. N., and Daigneault, M.: Effect of groundwater and sea weathering cycles on the strength of chalk rock from unstable coastal cliffs of NW France, Eng. Geol., 78, 321–343, https://doi.org/10.1016/j.enggeo.2005.01.004, 2005. a
Earlie, C. S., Masselink, G., Russell, P. E., and Shail, R. K.: Application of airborne LiDAR to investigate rates of recession in rocky coast environments, J. Coast. Conserv., 19, 831–845, https://doi.org/10.1007/s11852-014-0340-1, 2015. a, b
Emery, K. O. and Kuhn, G. G.: Sea cliffs: Their processes, profiles, and classification, Geol. Soc. Am. Bull., 93, 644–654, https://doi.org/10.1130/0016-7606(1982)93<644:SCTPPA>2.0.CO;2, 1982. a
Gibb, J. G.: Rates of coastal erosion and accretion in New Zealand, New Zeal. J. Mar. Fresh., 12, 429–456, https://doi.org/10.1080/00288330.1978.9515770, 1978. a
Gulayev, S. and Buckeridge, J.: Terrestrial methods for monitoring cliff erosion in a urban environment, J. Coastal Res., 20, 871–878, 2004. a
Hapke, C. J., Reid, D., and Richmond, B.: Rates and Trends of Coastal Change in California and the Regional Behavior of the Beach and Cliff System, J. Coastal Res., 253, 603–615, https://doi.org/10.2112/08-1006.1, 2009. a, b
Hoek, E. and Brown, E. T.: Practical estimates of Rock Mass Strength, Int. J. Rock Mech Min., 34, 1165–1186, 1997. a, b, c, d, e
Hurst, M. D., Rood, D. H., and Ellis, M. A.: Controls on the distribution of cosmogenic 10Be across shore platforms, Earth Surf. Dynam., 5, 67–84, https://doi.org/10.5194/esurf-5-67-2017, 2017. a
Kanyaya, J. I. and Trenhaile, A. S.: Tidal wetting and drying on shore platforms: An experimental assessment, Geomorphology, 70, 129–146, https://doi.org/10.1016/j.geomorph.2005.04.005, 2005. a, b
Kennedy, D. M.: Chapter 14 The rock coast of Australia, Geological Society, London, Memoirs, 40, 235–245, https://doi.org/10.1144/M40.14, 2014. a
Kennedy, D. M.: Where is the seaward edge? A review and definition of shore platform morphology, Earth-Sci. Rev., 147, 99–108, https://doi.org/10.1016/j.earscirev.2015.05.007, 2015. a
Kennedy, D. M., Stephenson, W. J., and Naylor, L. A.: Rock Coast Geomorphology: A Global Synthesis, Geological Society of London, google-Books-ID: iIROBAAAQBAJ, 2014. a
Kostrzewski, A., Zwoliński, Z., Winowski, M., Tylkowski, J., and Samołyk, M.: Cliff top recession rate and cliff hazards for the sea coast of Wolin Island (Southern Baltic), Baltica, 28, 109–120, https://doi.org/10.5200/baltica.2015.28.10, 2015. a
Lee, E.: Coastal cliff behaviour: Observations on the relationship between beach levels and recession rates, Geomorphology, 101, 558–571, https://doi.org/10.1016/j.geomorph.2008.02.010, 2008. a
Letortu, P.: Le recul des falaises crayeuses haut-normandes et les inondations par la mer en Manche centrale et orientale: de la quantification de l'aléa á la caractérisation des risques induits, PhD thesis, Caen Basse Normandie, 2013. a
Letortu, P., Costa, S., Maquaire, O., Delacourt, C., Augereau, E., Davidson, R., Suanez, S., and Nabucet, J.: Retreat rates, modalities and agents responsible for erosion along the coastal chalk cliffs of Upper Normandy: The contribution of terrestrial laser scanning, Geomorphology, 245, 3–14, https://doi.org/10.1016/j.geomorph.2015.05.007, 2015. a, b, c
Lim, M., Petley, D. N., Rosser, N. J., Allison, R. J., Long, A. J., and Pybus, D.: Combined digital photogrammetry and time-of-flight laser scanning for monitoring cliff evolution, Photogramm. Rec., 20, 109–129, 2005. a
Lim, M., Rosser, N. J., Allison, R. J., and Petley, D. N.: Erosional processes in the hard rock coastal cliffs at Staithes, North Yorkshire, Geomorphology, 114, 12–21, https://doi.org/10.1016/j.geomorph.2009.02.011, 2010. a
Limber, P. W., Brad Murray, A., Adams, P. N., and Goldstein, E. B.: Unraveling the dynamics that scale cross-shore headland relief on rocky coastlines: 1. Model development: Headland relief on rocky coastlines, J. Geophys. Res.-Earth, 119, 854–873, https://doi.org/10.1002/2013JF002950, 2014. a
Marques, F. M. S. F.: Rates, patterns, timing and magnitude-frequency of cliff retreat phenomena; a case study on the west coast of Portugal, Z. Geomorphol. Supp., 144, 231–257, 2006. a
May, V. J.: The Retreat of Chalk Cliffs, Geogr. J., 137, 203–206, https://doi.org/10.2307/1796740, 1971. a
May, V. J. and Hansom, J. D.: Beachy Head – Seaford Head, in: Coastal Geomorphology of Great Britain, no. 28 in Geological Conservation Review Series 129–130, Joint Nature Conservation Committee, Peterborough, available at: http://jncc.defra.gov.uk/pdf/gcrdb/GCRsiteaccount1850.pdf, last access: 2003. a
May, V. J. and Heeps, C.: The nature and rates of change on chalk coastlines, Zeitschrift für Geomorphologie, Supplement Band, 57, 81–94, 1985. a
Mitchell, T. D. and Jones, P. D.: An improved method of constructing a database of monthly climate observations and associated high-resolution grids, Int. J. Climatol., 25, 693–712, https://doi.org/10.1002/joc.1181, 2005. a
Moon, V. and de Lange, W.: Reply to the comment by Stephenson – Discussion of de Lange, W. P. and Moon, V.G. 2005. Estimating long-term cliff recession rates from shore platform widths. Engineering Geology 80, 292–301, Eng. Geol., 101, 292–294, https://doi.org/10.1016/j.enggeo.2008.04.007, 2008. a
Mortimore, R. N. and Duperret, A.: Coastal chalk cliff instability, 20, Geological Society of London, https://doi.org/10.1144/GSL.ENG.2004.020, 2004. a
Moses, C. and Robinson, D.: Chalk coast dynamics: Implications for understanding rock coast evolution, Earth-Sci. Rev., 109, 63–73, https://doi.org/10.1016/j.earscirev.2011.08.003, 2011. a, b, c, d
Orviku, K., Tõnisson, H., Kont, A., Suuroja, S., and Anderson, A.: Retreat rate of cliffs and scarps with different geological properties in various locations along the Estonian coast, J. Coastal Res., 65, 552–557, 2013. a
Perherin, C., Roche, A., Pons, F., Roux, I., Desire, G., and Boura, C.: Vulnérabilité du territoire national aux risques littoraux, Tech. rep., CETMEF, 2012. a
Pye, K. and Blott, S. J.: Spatial and temporal variations in soft-cliff erosion along the Holderness coast, East Riding of Yorkshire, UK, J. Coast. Conserv., 19, 785–808, https://doi.org/10.1007/s11852-015-0378-8, 2015. a
Regard, V., Dewez, T., Bourlès, D., Anderson, R., Duperret, A., Costa, S., Leanni, L., Lasseur, E., Pedoja, K., and Maillet, G.: Late Holocene seacliff retreat recorded by 10Be profiles across a coastal platform: Theory and example from the English Channel, Quat. Geochronol., 11, 87–97, https://doi.org/10.1016/j.quageo.2012.02.027, 2012. a, b, c
Regard, V., Dewez, T., Cnudde, C., and Hourizadeh, N.: Coastal chalk platform erosion modulated by step erosion and debris shielding: example from Normandy and Picardy (northern France), J. Coastal Res., 165, 1692–1697, https://doi.org/10.2112/SI65-286.1, 2013. a
Rohmer, J. and Dewez, T.: On the deviation of extreme sea-cliff instabilities from the power-law frequency-volume distribution: practical implications for coastal management, J. Coastal Res., 165, 1698–1703, https://doi.org/10.2112/SI65-287.1, 2013. a
Rosser, N., Lim, M., Petley, D., Dunning, S., and Allison, R.: Patterns of precursory rockfall prior to slope failure, J. Geophysical Res., 112, F4, https://doi.org/10.1029/2006JF000642, 2007. a, b
Sallenger Jr, A. H., Krabill, W., Brock, J., Swift, R., Manizade, S., and Stockdon, H.: Sea-cliff erosion as a function of beach changes and extreme wave runup during the 1997–1998 El Nino, Mar. Geol., 187, 279–297, https://doi.org/10.1016/S0025-3227(02)00316-X, 2002. a
Stephenson, W.: Discussion of de Lange, W. P. and Moon, V. G. 2005. Estimating long-term cliff recession rates from shore platform widths. Engineering Geology 80, 292–301, Eng. Geol., 101, 288–291, https://doi.org/10.1016/j.enggeo.2008.04.008, 2008. a
Stephenson, W. J. and Kirk, R. M.: Development of shore platforms on Kaikoura Peninsula, South Island, New Zealand: Part one: the role of waves, Geomorphology, 32, 21–41, 2000. a, b
Stephenson, W. J. and Naylor, L. A.: Within site geological contingency and its effect on rock coast erosion, J. Coastal Res., 61, 831–835, 2011. a
Sunamura, T.: Geomorphology of rocky coasts, J. Wiley, New York, 302 pp., 1992. a, b, c, d, e, f, g, h, i
Tardieu, H., Rochfeld, A., Colleti, R., Panet, G., and Vahée, G.: La méthode MERISE–Tome 2 Démarches et pratiques, Editions d'organisation, Paris., 1985. a
Teixeira, S. B.: Slope mass movements on rocky sea-cliffs: A power-law distributed natural hazard on the Barlavento Coast, Algarve, Portugal, Cont. Shelf Res., 26, 1077–1091, https://doi.org/10.1016/j.csr.2005.12.013, 2006. a
Trenhaile, A. S.: Modeling the development of wave-cut shore platforms, Mar. Geol., 166, 163–178, 2000. a, b
Trenhaile, A. S.: Modeling the role of weathering in shore platform development, Geomorphology, 94, 24–39, https://doi.org/10.1016/j.geomorph.2007.04.002, 2008. a
Trenhaile, A. S.: Modeling the erosion of cohesive clay coasts, Coast. Eng., 56, 59–72, https://doi.org/10.1016/j.coastaleng.2008.07.001, 2009. a
Williams, J. G., Rosser, N. J., Hardy, R. J., Brain, M. J., and Afana, A. A.: Optimising 4-D surface change detection: an approach for capturing rockfall magnitude–frequency, Earth Surf. Dynam., 6, 101–119, https://doi.org/10.5194/esurf-6-101-2018, 2018. a, b
Woodroffe, C. D.: Coasts: Form, Process and Evolution, Cambridge University Press, 2002. a, b, c, d, e
Young, A. P. and Ashford, S. A.: Application of Airborne LIDAR for Seacliff Volumetric Change and Beach-Sediment Budget Contributions, J. Coast. Res., 222, 307–318, https://doi.org/10.2112/05-0548.1, 2006. a