the Creative Commons Attribution 4.0 License.
the Creative Commons Attribution 4.0 License.
 | 30 Oct 2019
Permafrost distribution in steep rock slopes in Norway: measurements, statistical modelling and implications for geomorphological processes
Florence Magnin
Bernd Etzelmüller
Sebastian Westermann
Ketil Isaksen
Paula Hilger
Reginald L. Hermanns
Permafrost in steep rock slopes has been increasingly studied since the early 2000s in conjunction with a growing number of rock slope failures, which likely resulted from permafrost degradation. In Norway, rock slope destabilization is a widespread phenomenon and a major source of risk for the population and infrastructure. However, a lack of precise knowledge of the permafrost distribution in steep slopes hinders the assessment of its role in these destabilizations. This study proposes the first nationwide permafrost probability map for the steep slopes of Norway (CryoWall map). It is based on a multiple linear regression model fitted with multi-annual rock surface temperature (RST) measurements, collected at 25 rock slope sites, spread across a latitudinal transect (59–69∘ N) over mainland Norway. The CryoWall map suggests that discontinuous permafrost widely occurs above 1300–1400 and 1600–1700 m a.s.l. in the north and south rock faces of southern Norway (59∘ N), respectively. This lower altitudinal limit decreases in northern Norway (70∘ N) by about 500±50 m, with a more pronounced decrease for south faces, as a result of the insolation patterns largely driven by midnight sun in summer and polar night in winter. Similarly, the mean annual RST differences between north and south faces of similar elevation range around 1.5 ∘C in northern Norway and 3.5 ∘C in southern Norway. The CryoWall map is evaluated against direct ice observations in steep slopes and discussed in the context of former permafrost studies in various types of terrain in Norway. We show that permafrost can occur at much lower elevations in steep rock slopes than in other terrains, especially in north faces. We demonstrate that the CryoWall map is a valuable basis for further investigations related to permafrost in steep slopes in terms of both practical concerns and fundamental science.
- Article
(27504 KB) - Full-text XML
-
Supplement
(73282 KB) - BibTeX
- EndNote


Permafrost affecting steep bedrock slopes has been increasingly studied since the early 2000s in conjunction with both the high frequency of rock fall activity during hot summers (e.g. Gruber et al., 2004a; Fischer et al., 2006; Allen et al., 2009; Ravanel et al., 2017) and the occurrence of high-magnitude rock–ice avalanches (e.g. Haeberli et al., 2004; Sosio et al., 2008; Huggel et al., 2012; Deline et al., 2015). These increasing rock slope failures bear both fundamental and societal concerns. They are essential events of periglacial and paraglacial mass-wasting processes (McColl, 2012) and of sediment transport (Korup, 2009). They are therefore important processes of landscape development but are also important sources of hazard, threatening infrastructures, activities and individuals through either direct or potential secondary effects, such as displacement waves and catastrophic flooding through debris flows (e.g. Huggel et al., 2005; Romstad et al., 2009; Hermanns et al., 2013).
Investigations of the mechanical behaviour of frozen bedrock have demonstrated that permafrost dynamics affect rock wall stability as much on short as on long timescales (days to millennia). Bedrock warming modifies the fracture toughness of rock bridges at depths >20 m, preparing slow deformation and high-magnitude failures, while warming of ice-filled fracture joints at shallower depth is responsible for fast deformation and smaller-magnitude rock detachments (Krautblatter et al., 2013). Recently, the study of Mamot et al. (2018) established a new failure criterion to quantitatively predict the lowering of the shear resistance of ice joints in bedrock fractures resulting from both warming and unloading due to preliminary failures. It explains that the shear strength of an ice-filled fracture decreases by 64 % to 78 % when the bedrock at depths between 4 and 15 m warms from −10 to −0.5 ∘C. Other studies have rather focused on the effect of water circulation resulting from active layer thaw and permafrost degradation and showed that it could accelerate the melting of ice-filled fractures (Hasler et al., 2011a), adding to slope destabilization due to enhanced water pressures (Fischer et al., 2010; Krautblatter et al., 2013). The mechanical behaviour of frozen bedrock is therefore closely linked to its temperature range and water phase changes. For this reason, the assessment of permafrost distribution and evolution in steep rock slope has been an important focus tackled by geomorphologists within the past 15 years.
Since the early 2000s, rock surface temperature (RST) sensors have been deployed in many mountain areas, especially in the European Alps (e.g. Gruber et al., 2004b; Magnin et al., 2015a; Kellerer-Pirklbauer, 2017), but also in the Southern Alps of New Zealand (Allen et al., 2009), in the highest mountain peaks of Norway (Hipp et al., 2014), and in British Columbia (Hasler et al., 2015). Analyses of the recorded RST have shown that the primary factors controlling permafrost distribution and changes are the incoming shortwave solar radiation (or sun exposure) and the air temperature (or elevation). Based on these findings, energy balance models have been employed to estimate the spatial distribution of rock slope permafrost (Gruber et al., 2004b) and, combined with heat conduction schemes, to assess its spatial patterns and evolution in typical alpine topographies (Noetzli et al., 2007; Noetzli and Gruber, 2009). Later, the accumulation of multi-year RST data over various mountain ranges allowed for the calibration of simple statistical models explaining the mean annual RST (MARST) with potential incoming solar radiation (PISR) and mean annual air temperature (MAAT) used to map permafrost over large areas (e.g. Boeckli et al., 2012a; Hipp et al., 2014; Magnin et al., 2015b). Nevertheless, RST measurements have also hinted at a significant control of snow accumulation on surface ruggedness, which has been investigated by mean of physics-based models (e.g. Haberkorn et al., 2017; Magnin et al., 2017a). These numerical investigations have shown that the high spatial and temporal variability of snow deposits in such steep slopes, due to the interaction of various topoclimatic factors (slope angle, sun exposure, wind transport, etc.), results in a highly variable and local thermal effect either warming or cooling the rock surface. Statistical approaches therefore struggle to capture this effect, but it can be qualitatively assessed to interpret permafrost distribution maps (Boeckli et al., 2012b). These maps are essential bases to implement physics-based models in order to address the temporal evolution of steep slope permafrost and its interactions with environmental variables in areas where no temperature measurements are available (e.g. Magnin et al., 2017b). Furthermore, permafrost maps allow scientists to link the observed rock wall destabilizations with permafrost conditions (e.g. Ravanel et al., 2017) and are therefore a key step towards the assessment of rock slope failure patterns and processes.
In Norway, the glacially shaped deep valleys and fjords are prone to mass-wasting processes. Rock slope failures from the oversteepened slopes and potential secondary effects, such as displacement waves (tsunamis), represent one of the deadliest natural hazards in the country (Hermanns et al., 2012). Over the last 500 years, approximately 800 events and 500 fatalities have been recorded in Norway, among which three displacement waves, triggered by major rock slope failures, caused the loss of 175 lives during the 20th century (Hermanns et al., 2013, 2014). At present, more than 253 unstable rock slopes have been mapped systematically and are partly monitored periodically by the Geological Survey of Norway (Oppikofer et al., 2015). At one of seven rock slope instabilities that are continuously monitored because of the potentially severe consequences in the case of failure, the role of permafrost was investigated with direct observations, which allowed for a detailed assessment of its role in local rock wall dynamics (Blikra and Christiansen, 2014). Many of these unstable slopes are possibly located at or above the lower boundary of altitudinal permafrost. Thus, a systematic investigation of steep rock slope permafrost at the national scale is required in order to assess its role in the conditioning of rock slope failures.
Permafrost has been investigated in many different types of terrain at the site scale or national scale in Norway and Scandinavia (e.g. Ødegård et al., 1992; Harris et al., 2001; Christiansen et al., 2010; Isaksen et al., 2011; Westermann et al., 2013; Gisnås et al., 2013, 2016, 2017). The study of permafrost in steep slopes in Norway has recently started with direct measurements of rock surface temperature (RST) in the high-elevated alpine areas of Jotunheimen and Hurrungane (Hipp et al., 2014). Myhra et al. (2017) have simulated the permafrost evolution since the end of the Little Ice Age (1880) to present for steep mountain sites spread over a latitudinal transect over Norway. At the national scale, a 1st-order estimation of the permafrost distribution in steep slopes has been proposed by Steiger et al. (2016) based on a straightforward empirical relationship between air and rock wall surface temperatures. Finally, Frauenfelder et al. (2018) studied ground thermal and geomechanical conditions in a permafrost-affected rock slide site in Troms (northern Norway). It is likely that changing rock and ice temperatures, due to general warming and in response to the extremely warm previous year, have played an important role in this detachment.
Knowing the current distribution of permafrost is not only a prerequisite to assess its past, present and future variability, but also to provide key knowledge and tools to land use planners and Earth scientists. Thus, a lack of precise knowledge regarding the nationwide distribution of rock slope permafrost is a major gap for both fundamental research and practical concerns in Norway. Therefore, we have monitored the RST at 25 measurement points, covering various aspects and elevations across a latitudinal transect of Norway. With the collected data we (i) characterize the thermal regime in rock slopes, (ii) calibrate a statistical model of RST and (iii) map permafrost probability for rock slopes at the national scale. In this paper, we present (i) the measurement settings and strategy, (ii) the approaches for statistical modelling and permafrost probability mapping, and (iii) the permafrost distribution in steep slopes at the national scale and for local areas of interest.
The Norwegian mainland has a land area of ca. 350 000 km2 and is dominated by the Scandinavian mountain chain, stretching between 57 and 71∘ N through Norway and Sweden over a distance of more than 2000 km. Scandinavia forms a tilted margin, with the highest elevations (culminating at 2469 m a.s.l.) found towards the western coast and decreasing towards the east and the Bothnian Sea. The area has undergone multiple glaciations during the Pleistocene, with the largest glaciations covering northern Europe completely several times during the last ca. 1 million years (e.g. Kleman et al., 2008). Most of the land area in Norway is dominated by gentle-relief landscape (Etzelmüller et al., 2007), probably preserved under cold-based ice conditions during the major glaciations (e.g. Kleman and Hättestrand, 1999). Steep slopes and rock walls are mainly associated with four types of settings (e.g. Steiger et al., 2016): (i) steep valley sides associated with large U-shaped valleys which drained the ice sheets during the glaciations, (ii) rock walls formed by local glaciations, mostly located along the western coast of the country and within the highest mountain regions of central southern Norway, (iii) rock walls associated with overthrusted nappes, and (iv) rock walls associated with steep river incisions. High-relief areas of Norway have experienced high rock slope failure activity throughout the late Pleistocene and Holocene, with a peak shortly after deglaciation (Bohme et al., 2015; Hermanns et al., 2017). The result is a high density of rock slope failure deposits (e.g. Hilger et al., 2018), both in western and northern Norway.
In general, the lower limit of mountain permafrost in Scandinavia decreases from the western coast towards eastern Norway and north-western Sweden, while the glaciation limit increases from west to east (e.g. King, 1983, 1986; Etzelmüller et al., 2003a). These gradients follow the climatic setting, with the maritime climate along the western coast (moist and high snow cover) gradually changing towards a more continental climate in the eastern parts of Norway (dry and less snow cover). In southern Norway, permafrost is mostly associated with bedrock in mountain settings, with coarse ground moraines and regolith (Farbrot et al., 2013; Gisnås et al., 2013, 2017; Christiansen et al., 2010; Westermann et al., 2013); the lower limit of discontinuous permafrost decreases from ca. 1600 m a.s.l. in the west to ca. 1200 m a.s.l. in the east (Etzelmüller et al., 2003a). In northern Norway, on the other hand, the permafrost limit decreases from 800–900 m a.s.l. in the western mountains of Troms county to 200–300 m a.s.l. in more continental areas, where it is often found in depressions characterized by peat plateaus (Borge et al., 2017).
The ongoing thawing and degradation of permafrost since the Little Ice Age (LIA) is likely to continue within the 21st century, with the lower altitudinal limit projected to rise up to 1800–1900 m a.s.l. in southern Norway (Hipp et al., 2012). Projections at the national scale based on an equilibrium model suggest that stable permafrost will be confined to 0.2 % of mainland Norway by the end of the 21st century, while it occupies about 6 %–6.5 % of the ground at present and was extending over 14 % of the ground at the end of the LIA (Gisnås et al., 2013). At present, we can expect considerable areas in Norway to feature thawing and degrading permafrost, which at greater depths is also likely a transient response to post-LIA warming.
3.1 Rock surface temperature monitoring
During the summers of 2015 to 2017, 21 temperature loggers (Geoprecision, M-Log5W-ROCK) were installed in eight mountain areas to record RST with a 2 h interval (Fig. 1). Together with the remaining four out of five temperature loggers installed in 2010 in Jotunheimen (Hipp et al., 2014), a network of 25 temperature loggers was available for this study. In order to represent a wide range of climate settings, they were distributed between 60.33 and 69.46∘ N, from 230 to 2320 m a.s.l. and in various aspects (Fig. 2, Table 1, Fig. S1 in the Supplement).
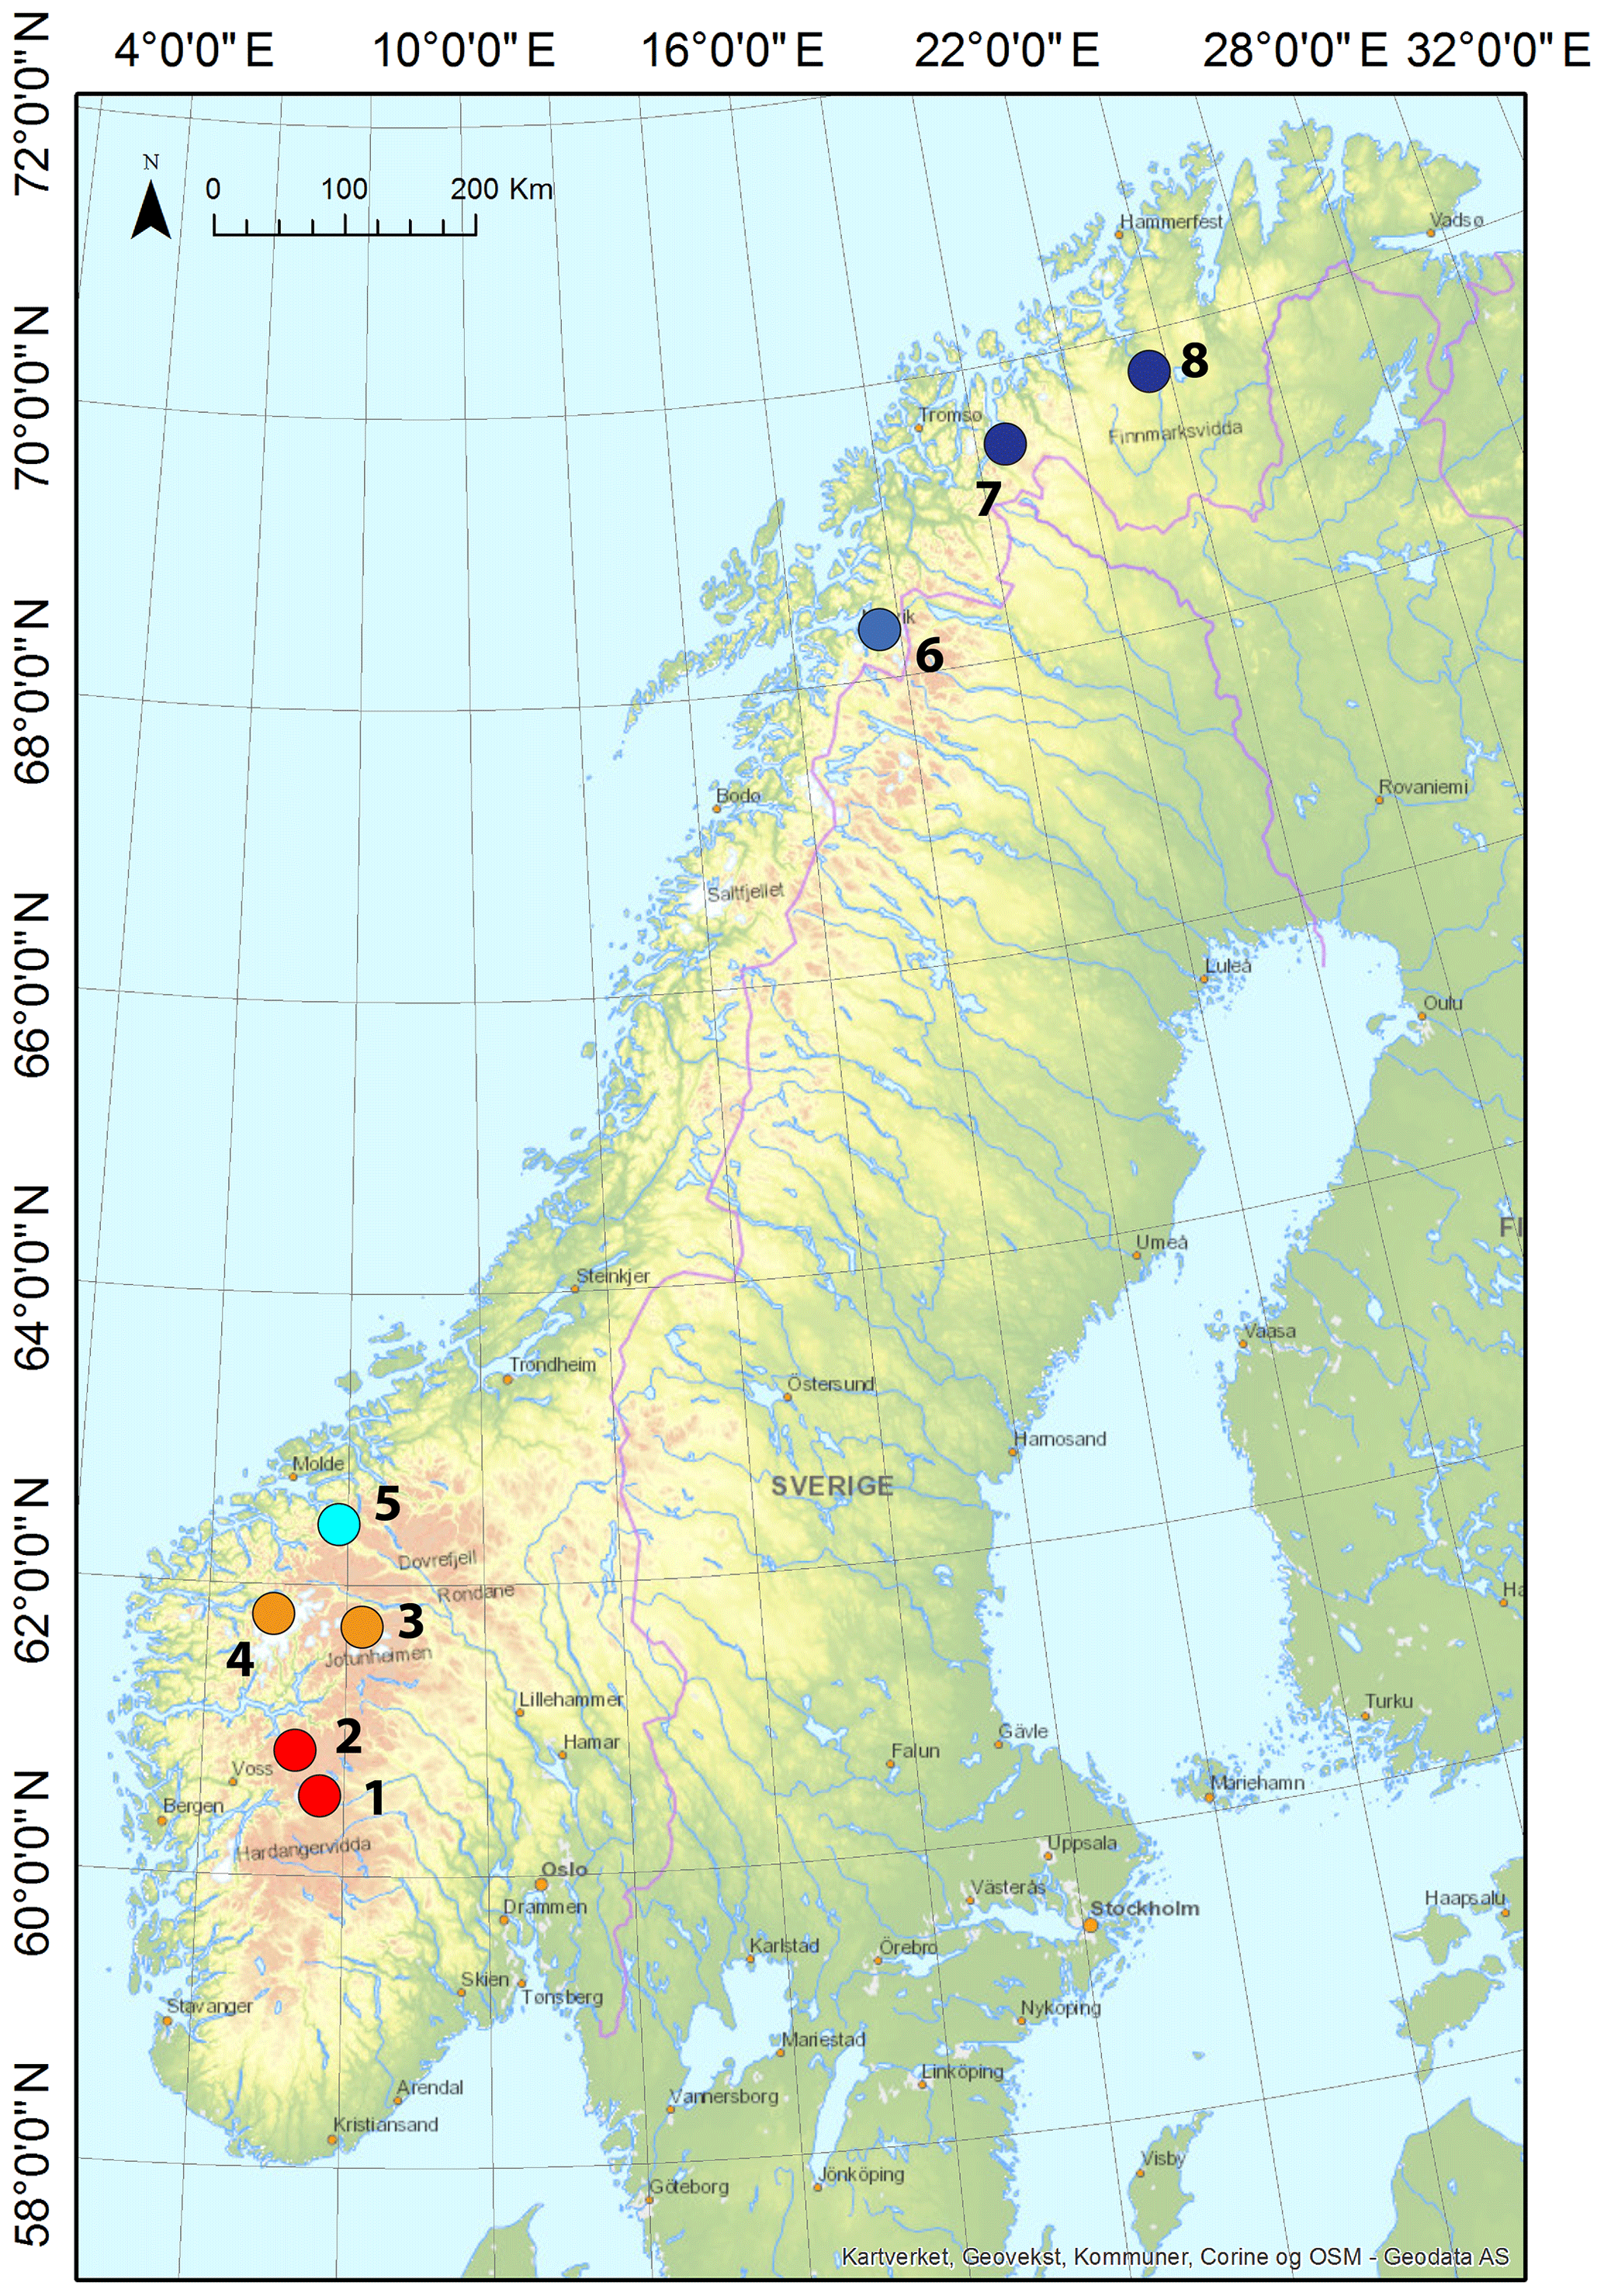
Figure 1Location of the rock surface temperature loggers in steep rock slopes across Norway. 1. Finse (one logger). 2. Flåm (three loggers). 3. Jotunheimen (four loggers). 4. Loen (three loggers). 5. Mannen (two loggers). 6. Narvik (three loggers). 7. Kåfjord (seven loggers). 8. Alta (two loggers). The colour range is adapted to latitude in accordance with Fig. 2.
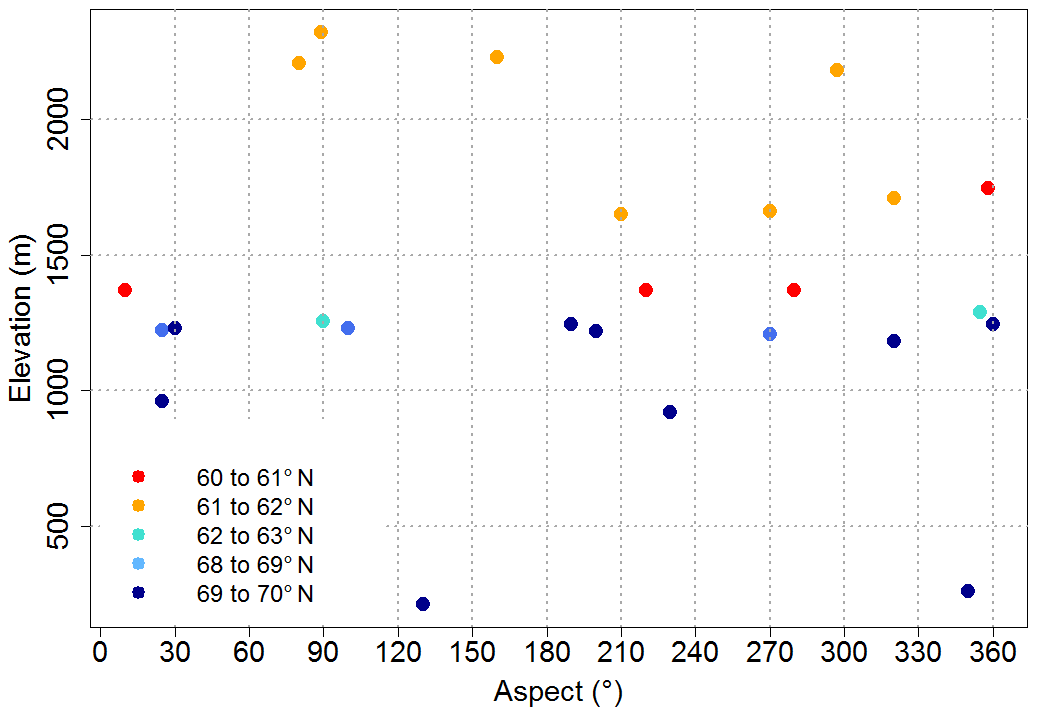
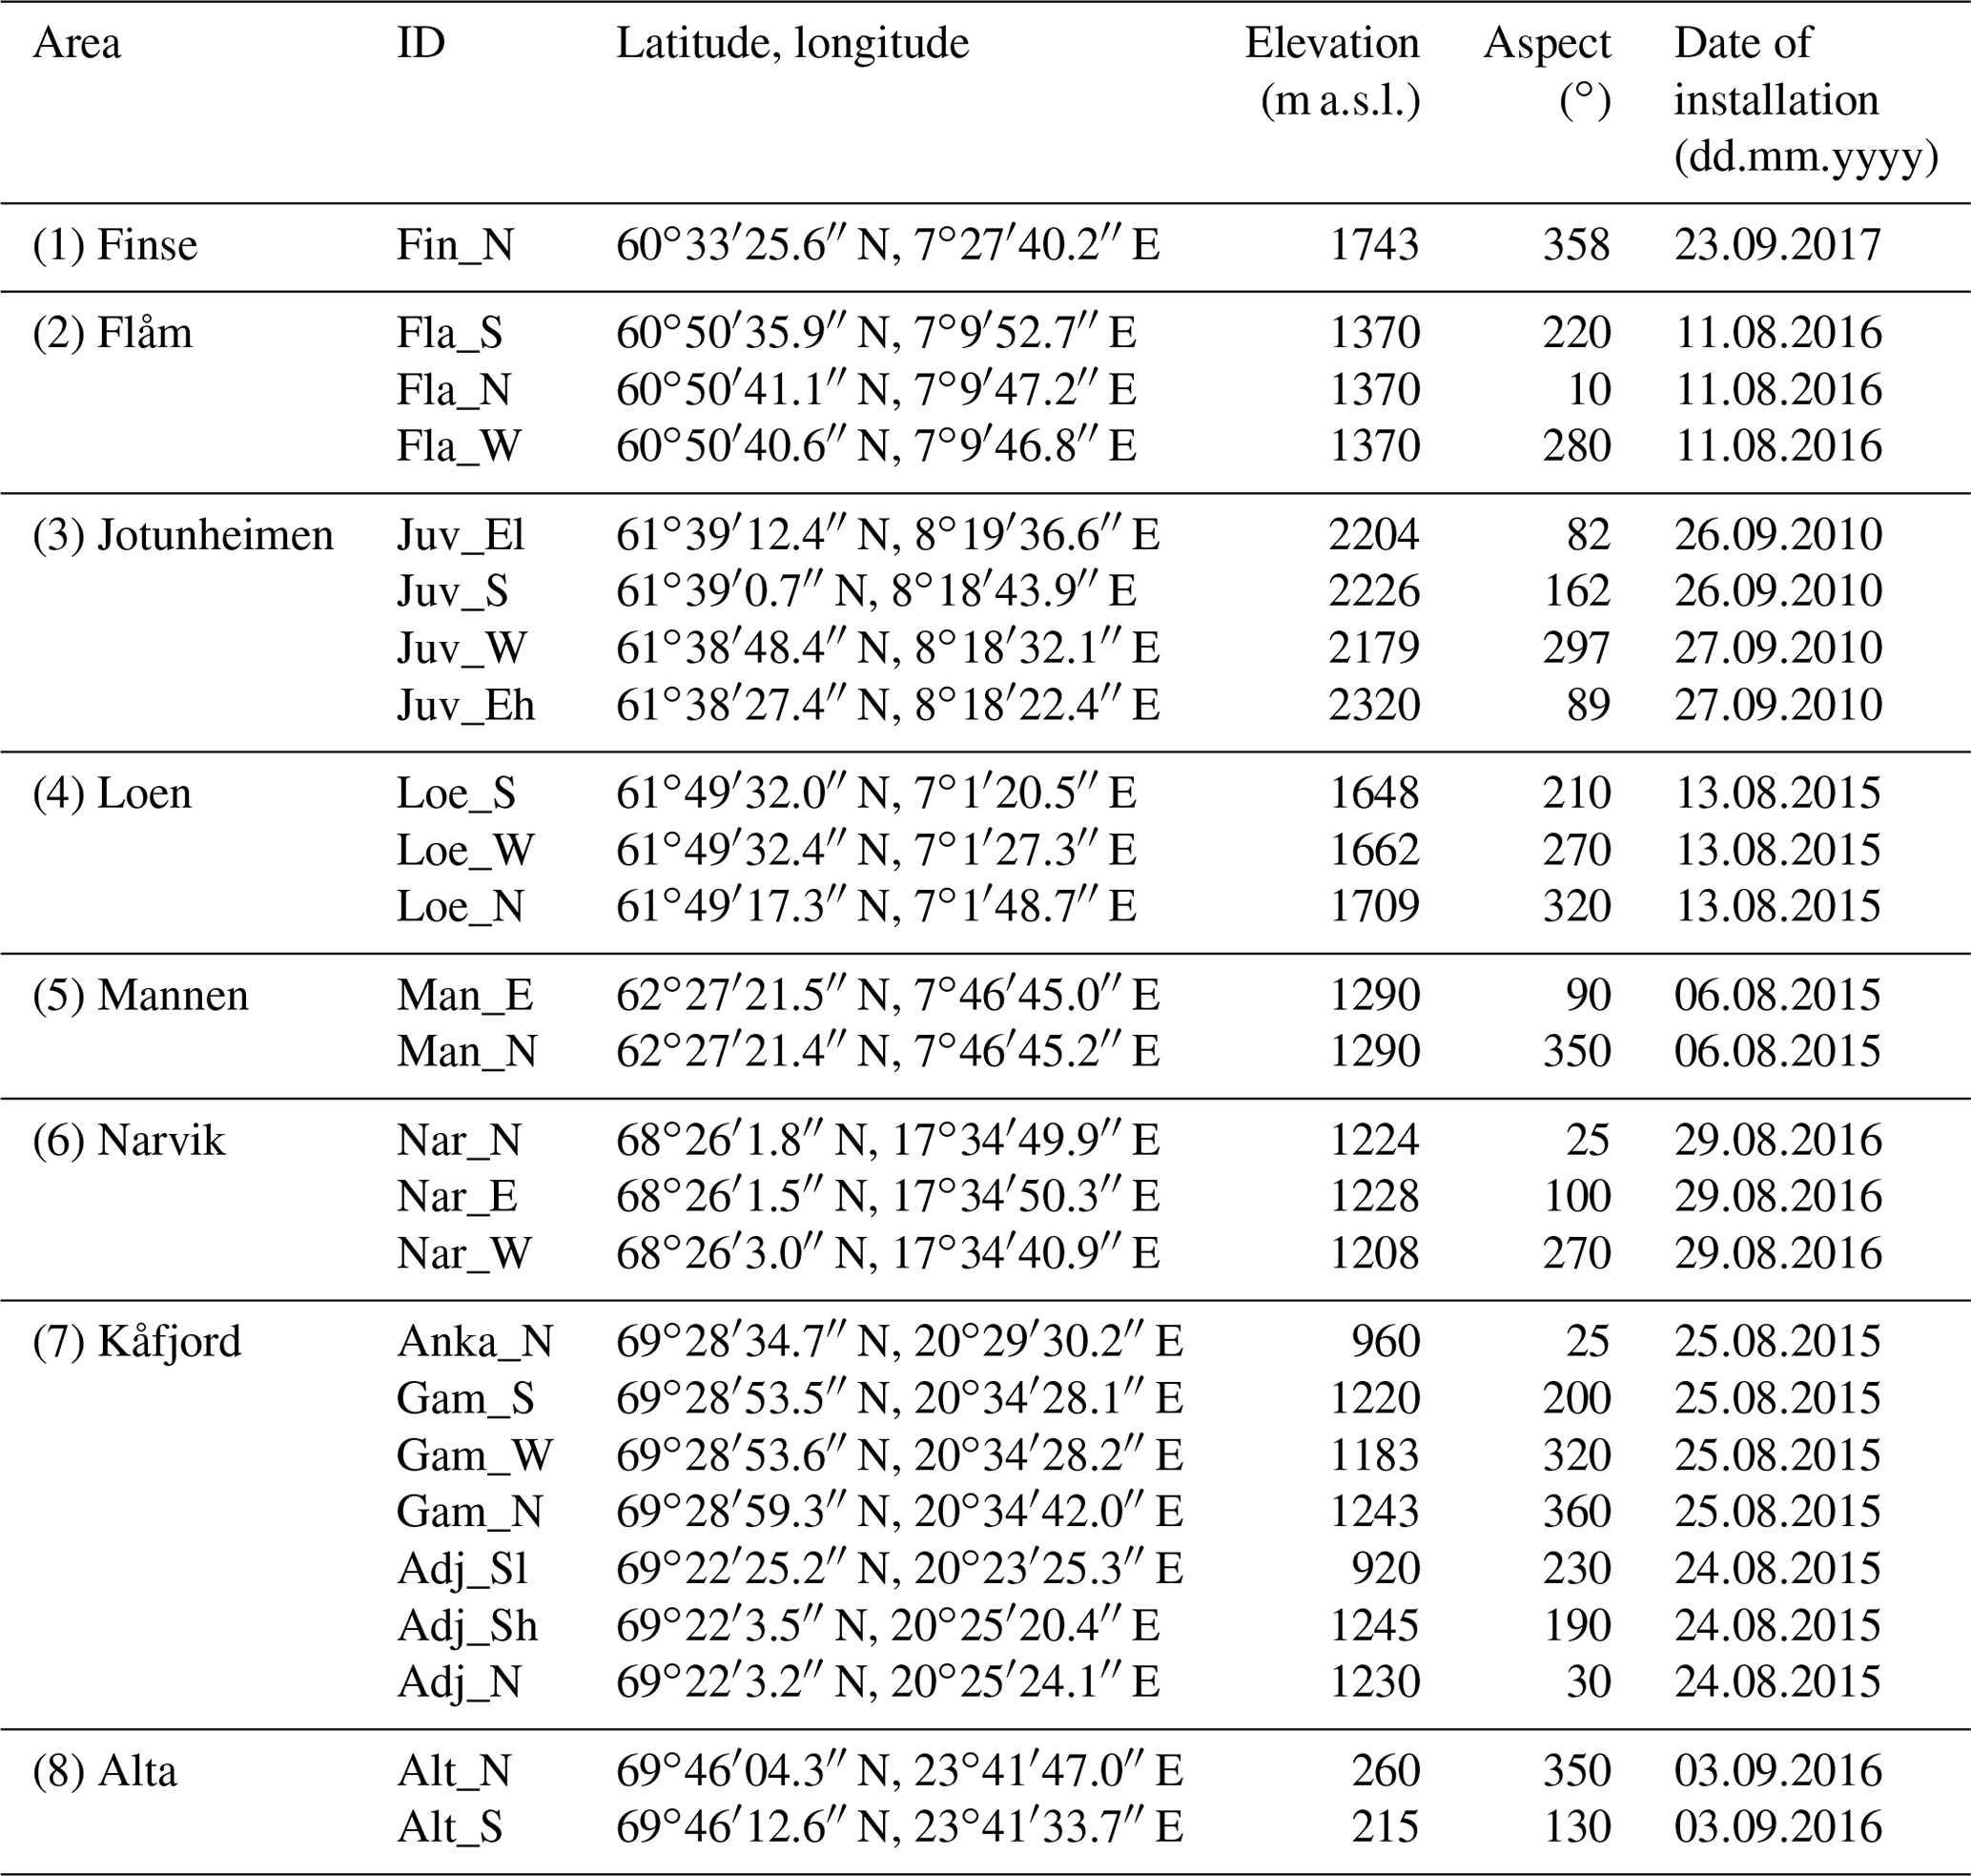
Table 1Settings of the temperature sensors used in this study.
The installation procedure followed the approach described by Gruber et al. (2004b) of placing sensors at a depth of 10 cm below the rock wall surface to avoid rapidly fluctuating surface temperature prone to erroneous measurements, well above ledges to ensure snow-free conditions. Thick snow accumulation over the logger would make the recorded RST unsuitable for statistical modelling because its thermal effect is not linear and depends on a variety of parameters that are highly fluctuating in space and time in high-elevated and high-relief environments, such as the snow thickness, duration and time period of the accumulation, the sun exposure of the affected rock face, and the snowpack thermal properties (Haberkorn et al., 2015, 2017; Magnin et al., 2015a, 2017a). Boeckli et al. (2012a) have shown that a precipitation or “seasonal” variable has no statistical significance in their “rock model” and confirmed that snow cannot be pertinently accounted for in a statistical approach to model steep rock slope permafrost.
3.2 Linear regression modelling and permafrost probability calculation
The mean annual rock surface temperature (MARST) is mainly governed by incoming shortwave solar radiation (PISR) and mean annual air temperature (MAAT), which makes its estimation possible by means of a multiple linear regression model (Sect. 1; Boeckli et al., 2012a; Hipp et al., 2014; Magnin et al., 2015b) such as
in which Y is the response variable (the MARST), α is the intercept term, θiXi represents the model's k explanatory variables (PISR and MAAT) and their respective coefficients to be calculated, and ε is a normally distributed residual error term with the mean equal to 0 and the variance σ2>0.
In this study, we therefore predict the MARST (MARSTpred) for the steep slopes of Norway as follows:
where a is the MARSTpred value when PISR and MAAT are equal to 0, and PISR and MAAT are respectively the potential incoming solar radiation (PISR) and the mean annual air temperature (MAAT) at measured RST positions, with their respective coefficients b and c to be calculated. We therefore use the measured RST over several years to calculate a sample of MARST, for which we then calculate the PISR and MAAT at their locations (see the following section for the preparation of these variables) to fit the regression displayed in Eq. (2) and calculate a, b and c using R (R Core team, 2013).
The model performance is assessed by the R2, RMSE (root mean square error) and MAE (mean absolute error), while the model residuals (measured MARST–MARSTpred) are used to evaluate the suitability of the data sample for the linear regression model. We further performed a repeated 10-fold cross-validation approach, which allows for the testing of the model performance by partitioning the dataset into 10 subsamples, 9 of which are used to fit the model, while 1 is kept to test the model (Gareth et al., 2014). The process is then repeated for each subsample and the means of the calculated R2, RMSE and MAE for each run are then provided to evaluate model performance (, RMSEcv and MAEcv). A total of 10 folds balance the possible bias or high variability associated with low and high fold numbers, respectively.
Finally, the probability of permafrost occurrence P(p) is expressed by the probability of MARSTpred at a given location to be ≤0 ∘C. To calculate p, MARSTpred is first transformed into a normal variable (MARSTnorm) of mean μ=0 and variance σ2=1 with
in which μpred and σpred are the mean and standard deviation of MARSTpred, respectively. The negative sign associated with MARSTpred is necessary since we calculate the probability of MARSTpred to be negative.
In the final step, p is calculated using a logistic approximation of the cumulative normal distribution developed by Bowling et al. (2009):
which ensures simplicity and accuracy in the permafrost probability calculation by guaranteeing a maximum absolute error in probability <0.00014 according to the comparison of Eq. (3) with the cumulative standard normal distribution (Bowling et al., 2009).
3.3 Calculation of model variables and model parameters
In order to ensure the best possible fit between the measured MARST, calculated PISR and MAAT, a preliminary visual data control is performed to detect possible snow control which would decorrelate the surface temperature from the air temperature and incoming solar radiation. To do so, daily means are computed from RST hourly records and plotted against local air temperature (AT) measurements (Fig. 3). Smoothing of the temperature curves and disconnection with AT oscillations are hunted, since they indicate thick snow accumulation (Hanson and Hoelzle, 2004). For all our RST time series, we notice that daily RST data follow AT oscillations throughout the year (Fig. 3). In summer, the sensors, which are most exposed to solar radiation, record higher RST than sensors located in shaded areas and higher RST than air temperature. No obvious smoothing of the daily RST is found in the presented time series, making them all suitable for statistical modelling.
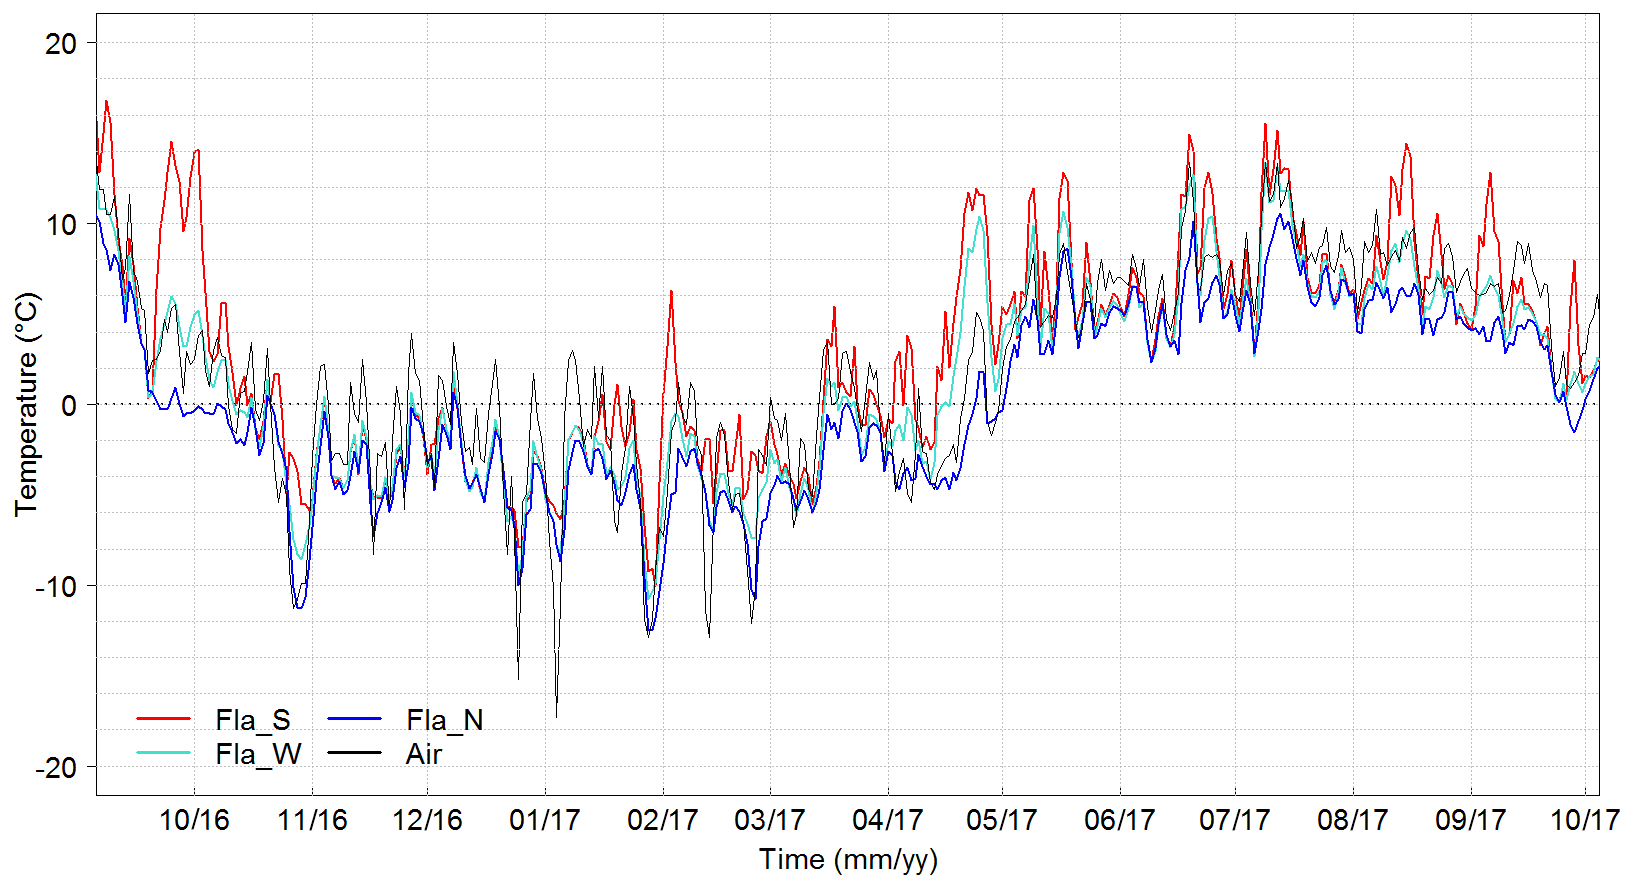
Figure 3Example of daily rock surface temperature data for the site of Flåm during one hydrological year.
Table 2Summary of the data used for calculating the MARST.
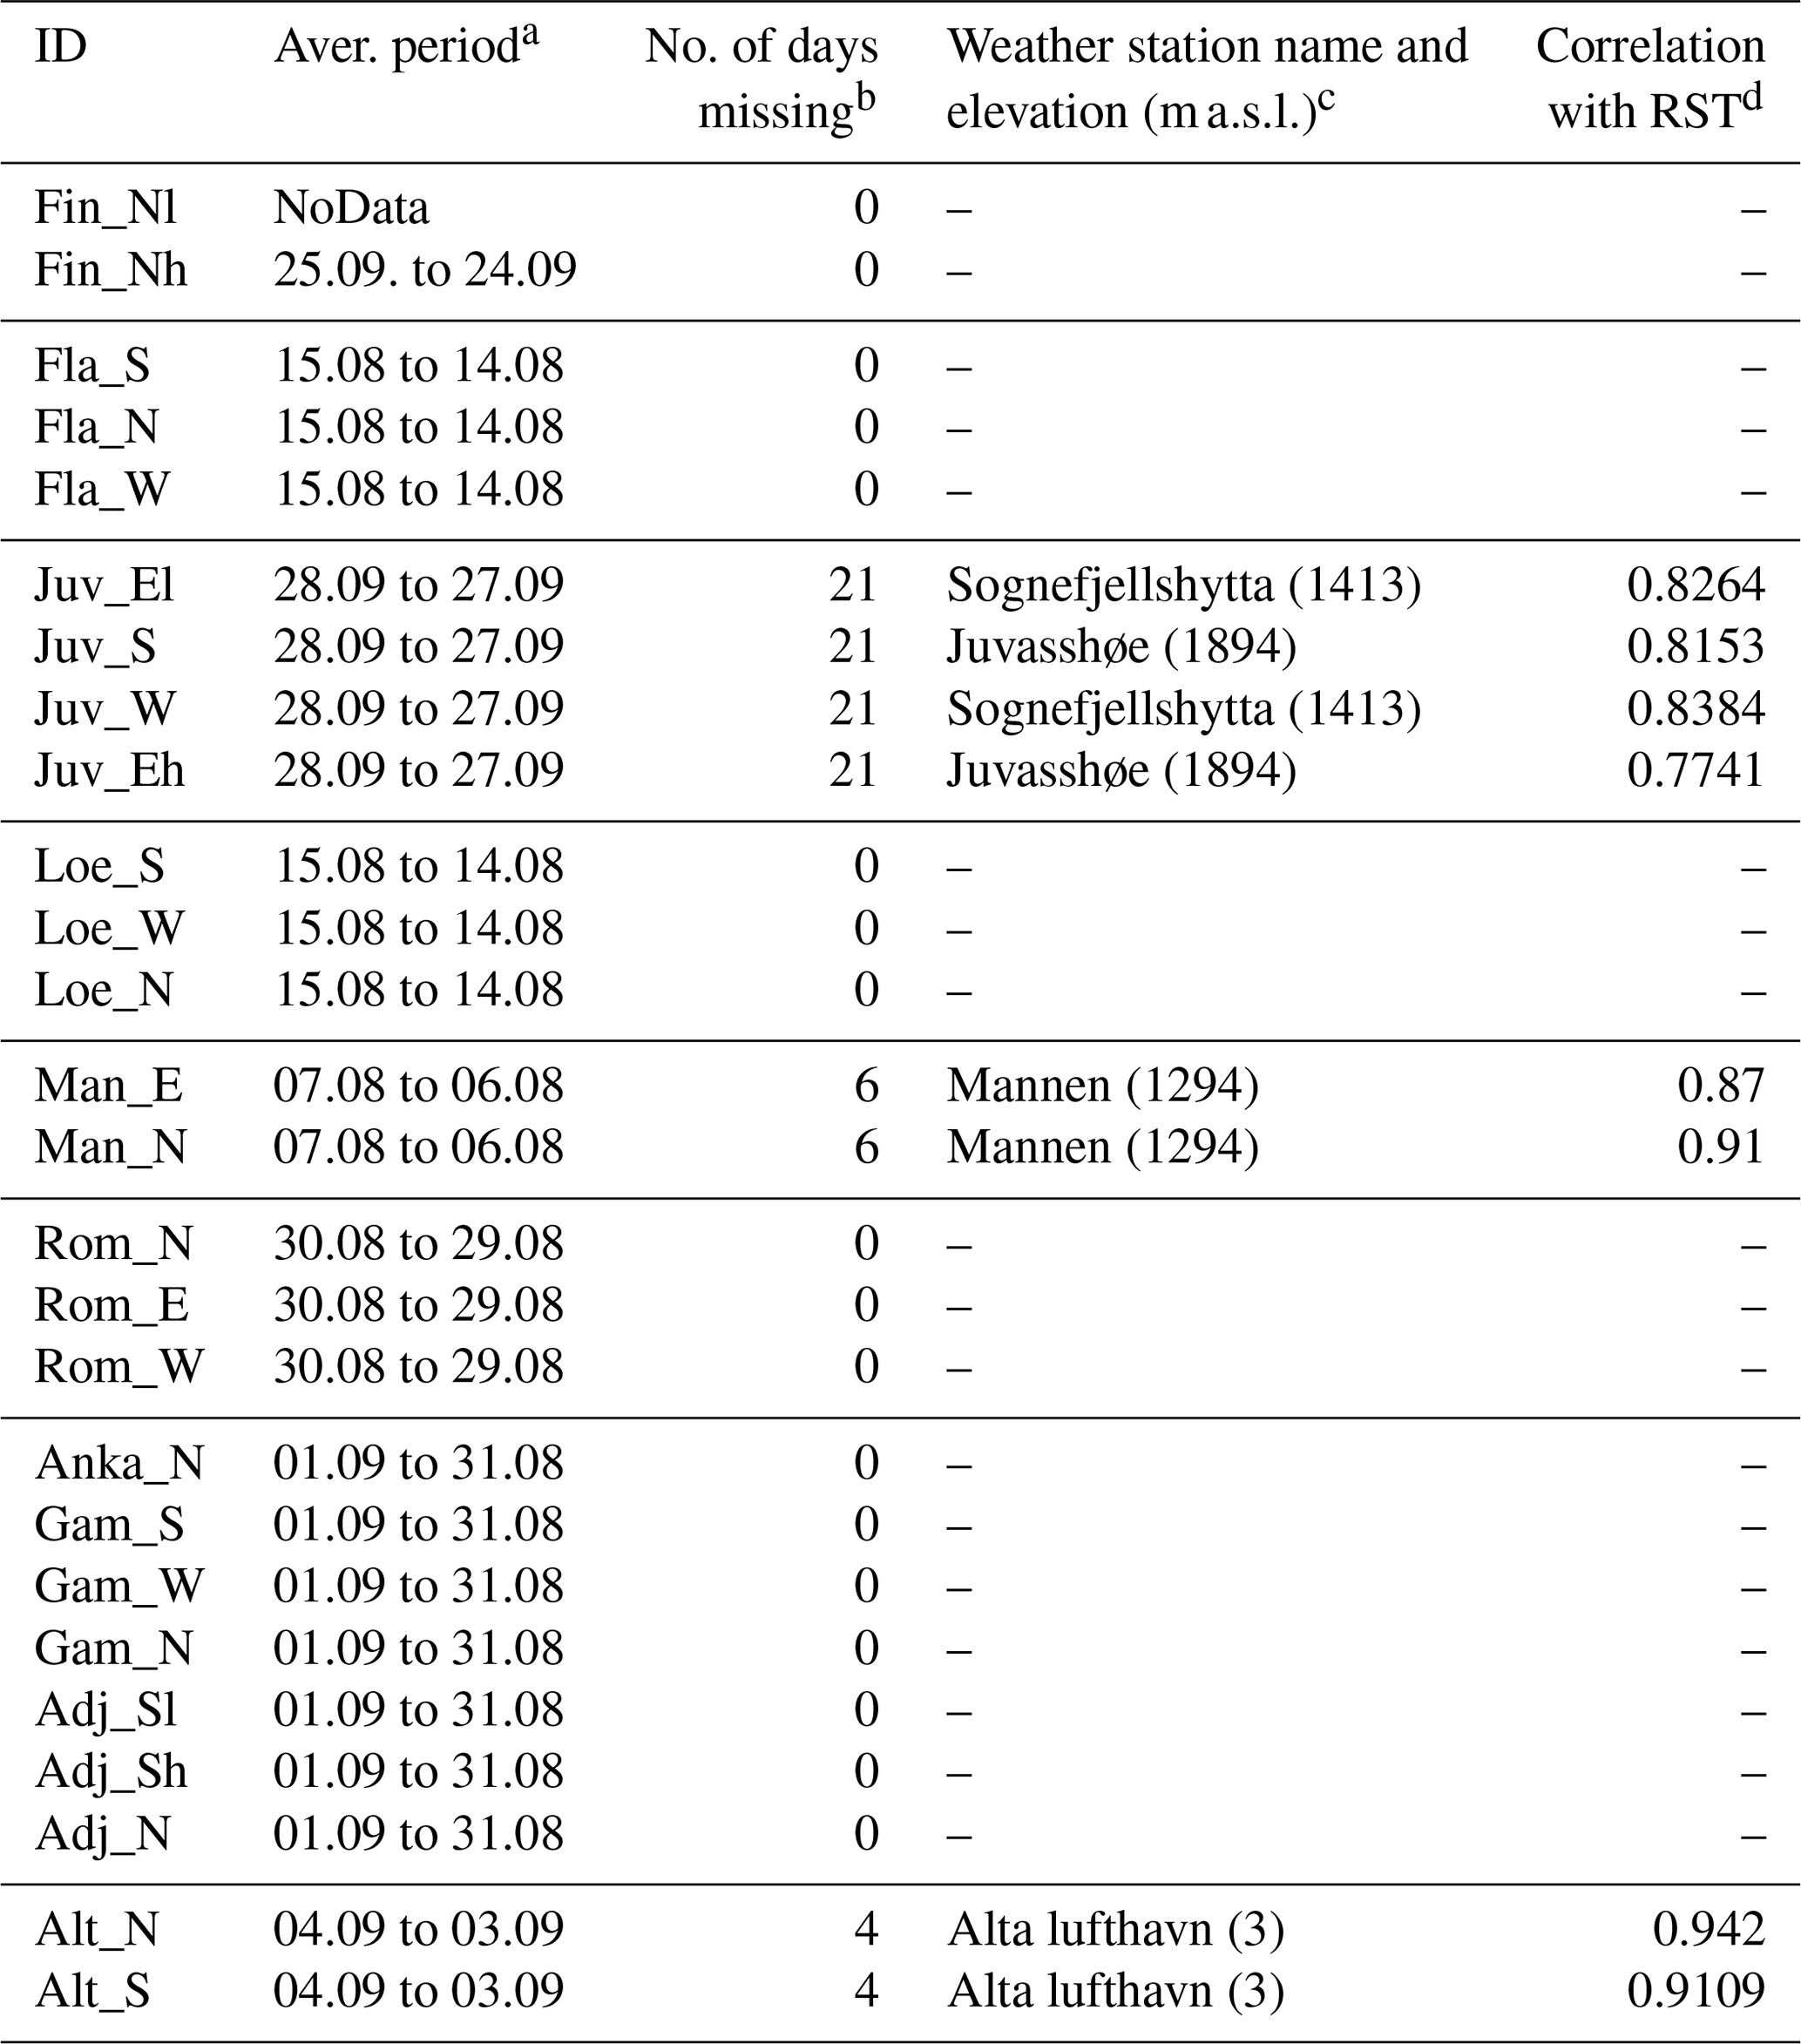
a Averaging period for the MARST calculation. b Number of days missing for the calculation of the most recent MARST. c Elevation of the weather station chosen to reconstruct the daily RST during the missing days. d Correlation between the daily RST and the daily AT recorded at the weather station.
After this visual check, daily RST data are aggregated to mean annual values (MARST). For the eight loggers at Mannen, in Jotunheimen and in Alta, we retrieve the data before achieving a full last year of measurements. Therefore a few days are missing to allow for the calculation of MARST over complete years, and we filled the missing data for the last few days by fitting a linear regression with local AT measurements (daily averages). For this, AT time series showing the best correlation with RST time series were chosen (Table 2, Fig. S1). The RST data processing provides 85 MARST multi-year measurement points to fit the regression model.
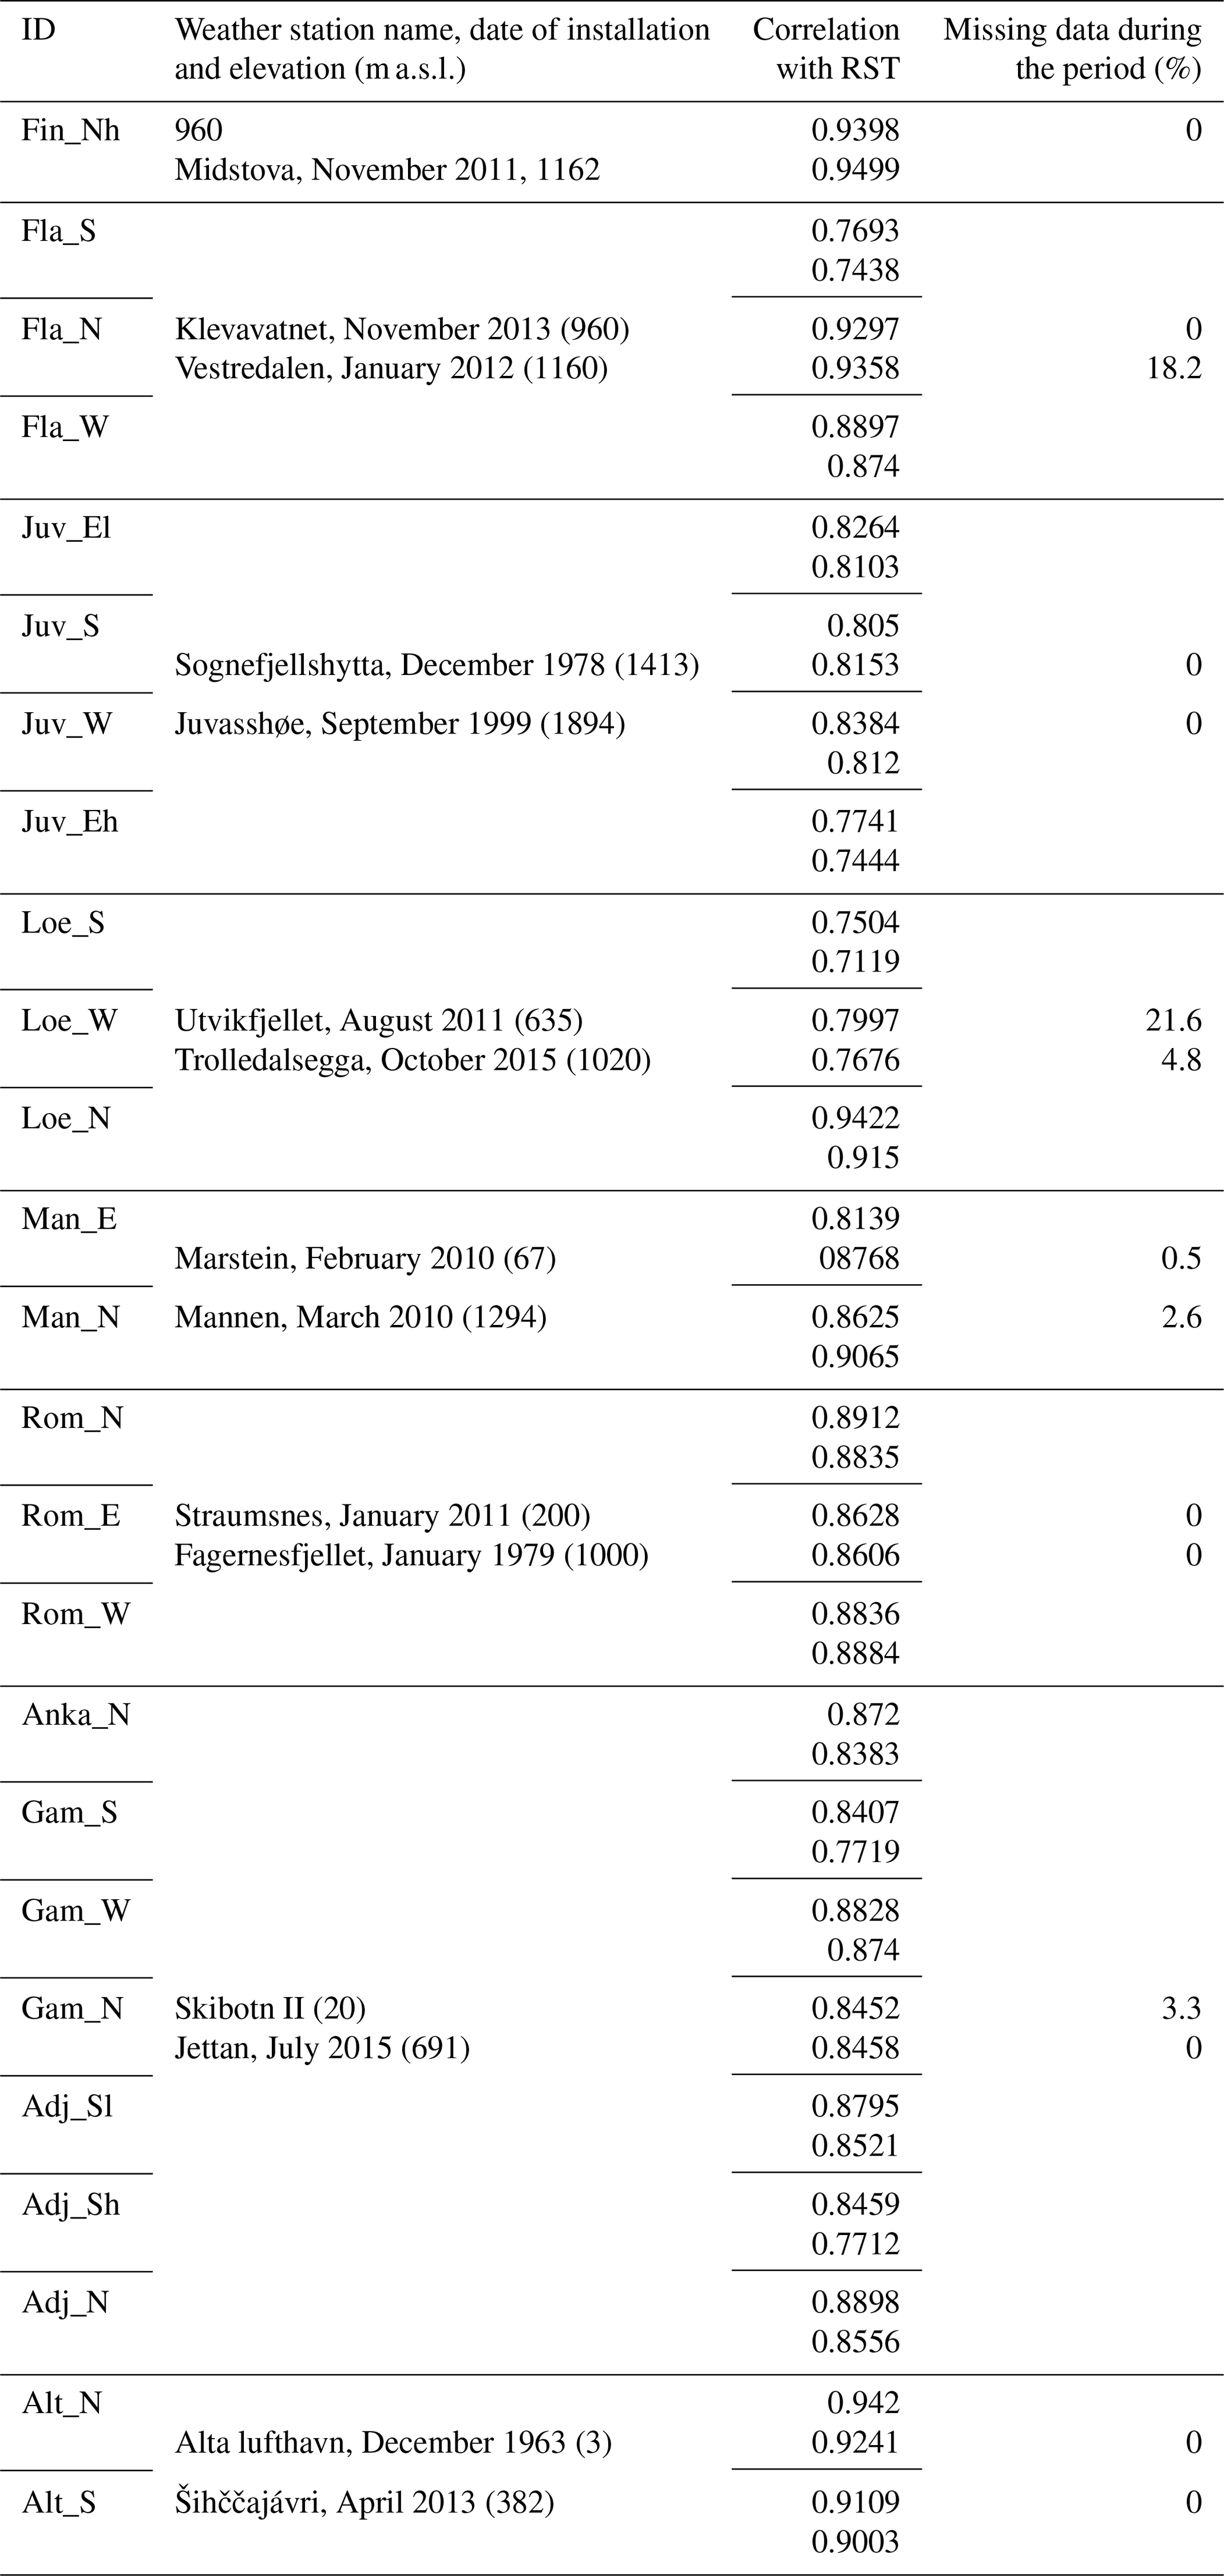
MAAT for the measurement period is calculated for each MARST point using local meteorological records at different elevations, from which a lapse rate is calculated. AT data were retrieved from the eKlima portal (http://sharki.oslo.dnmi.no/portal/page?_pageid=73,39035,73_39049&_dad=portal&_schema=PORTAL, last access: 11 October 2018) from the Norwegian meteorological institute. Similarly to the RST reconstruction, weather stations are chosen based on the best correlation between daily AT and RST records. To derive the most accurate MAAT at the locations of the RST loggers, we calculate the lapse rate at a daily time step between relatively low- and relatively high-lying weather stations. When AT records are incomplete, an average lapse rate is calculated for the period of the gap (2 months of overlap on each side of the gap) and for each of the recorded years. This yields a standard lapse rate value for the period of the gap, taking into account the fact that lapse rate values can vary significantly throughout seasons. The meteorological data used to reconstruct MAAT at each of the MARST locations are presented in Table 3.
The PISR is then calculated for each MARST point at an hourly resolution over 1 year and considering a transmissivity of 100 % (no atmosphere) using the Spatial Analyst tools of ArcGIS (© ESRI, Redlands, CA, USA). PISR is highly sensitive to the topographic settings (sun exposure, slope and viewshed) and thus highly dependent on the quality and coverage of the digital elevation model (DEM). For the Mannen, Narvik, Flåm, Loen and one of the Kåfjord (Gammanjunni) sites, 1 m resolution DEMs were available (Norge digital), while a 10 m resolution DEM (© Statens Kartverk, Norway) is available for all of Norway. The 1 m resolution DEMs only cover the relevant summits, meaning that relief shading effects from the surrounding peaks is neglected in the PISR calculation. We therefore conducted a sensitivity test of the PISR to relief shading based on the 10 m resolution DEM and tested the effect of the DEM resolution on the calculated PISR to choose which DEM to use for the final PISR calculation at logger locations. The test indicates that the relief shading effects are marginal on the summits, with maximal differences of 50 W m−2, while the effect of the resolution is crucial, especially close to the summits and ridges (see Fig. S2). This is due to the sharp topography which is hardly represented in medium-resolution DEMs and can lead to differences ranging above 100 W m−2. We chose the PISR values to attribute to each MARST point by averaging the three to five pixel values best matching the measured topographical parameters (slope angle, aspect and elevation) considering both DEM resolutions (1 and 10 m), since the slope angle and sun exposure have a primary role compared to the relief shading effect. Results of the sensitivity analysis are provided in the Supplement together with the MARST, MAAT and PISR data used to fit the multiple linear regression model (Fig. S2, Table S1).
3.4 Permafrost mapping
MAAT and PISR are first mapped over the entire country based on the 10 m resolution DEM. The PISR is calculated using the same parameters as for the model explanatory variable: hourly time step and 100 % transmissivity. The MAAT is mapped using the SeNorge2 dataset, which is interpolated from in situ temperature observations over grid point elevations at 1 km resolution (Lussana et al., 2017), and daily AT grids available from 1957. For the downscaling to a 10 m resolution, we first averaged daily AT data of the normal period 1981–2010 to generate a 1 km resolution MAAT raster. Then, for each 1 km grid cell, an average lapse rate is calculated over a radius of 25 km (Fig. 4). This regional lapse rate is then used to interpolate the 1 km MAAT grid to a 10 m resolution. The 25 km radius ensures a precision at the regional scale, representing the relatively high lapse rate of the maritime coasts and the relatively low lapse rates in the more continental areas, while smoothing local patterns and possible artefacts.
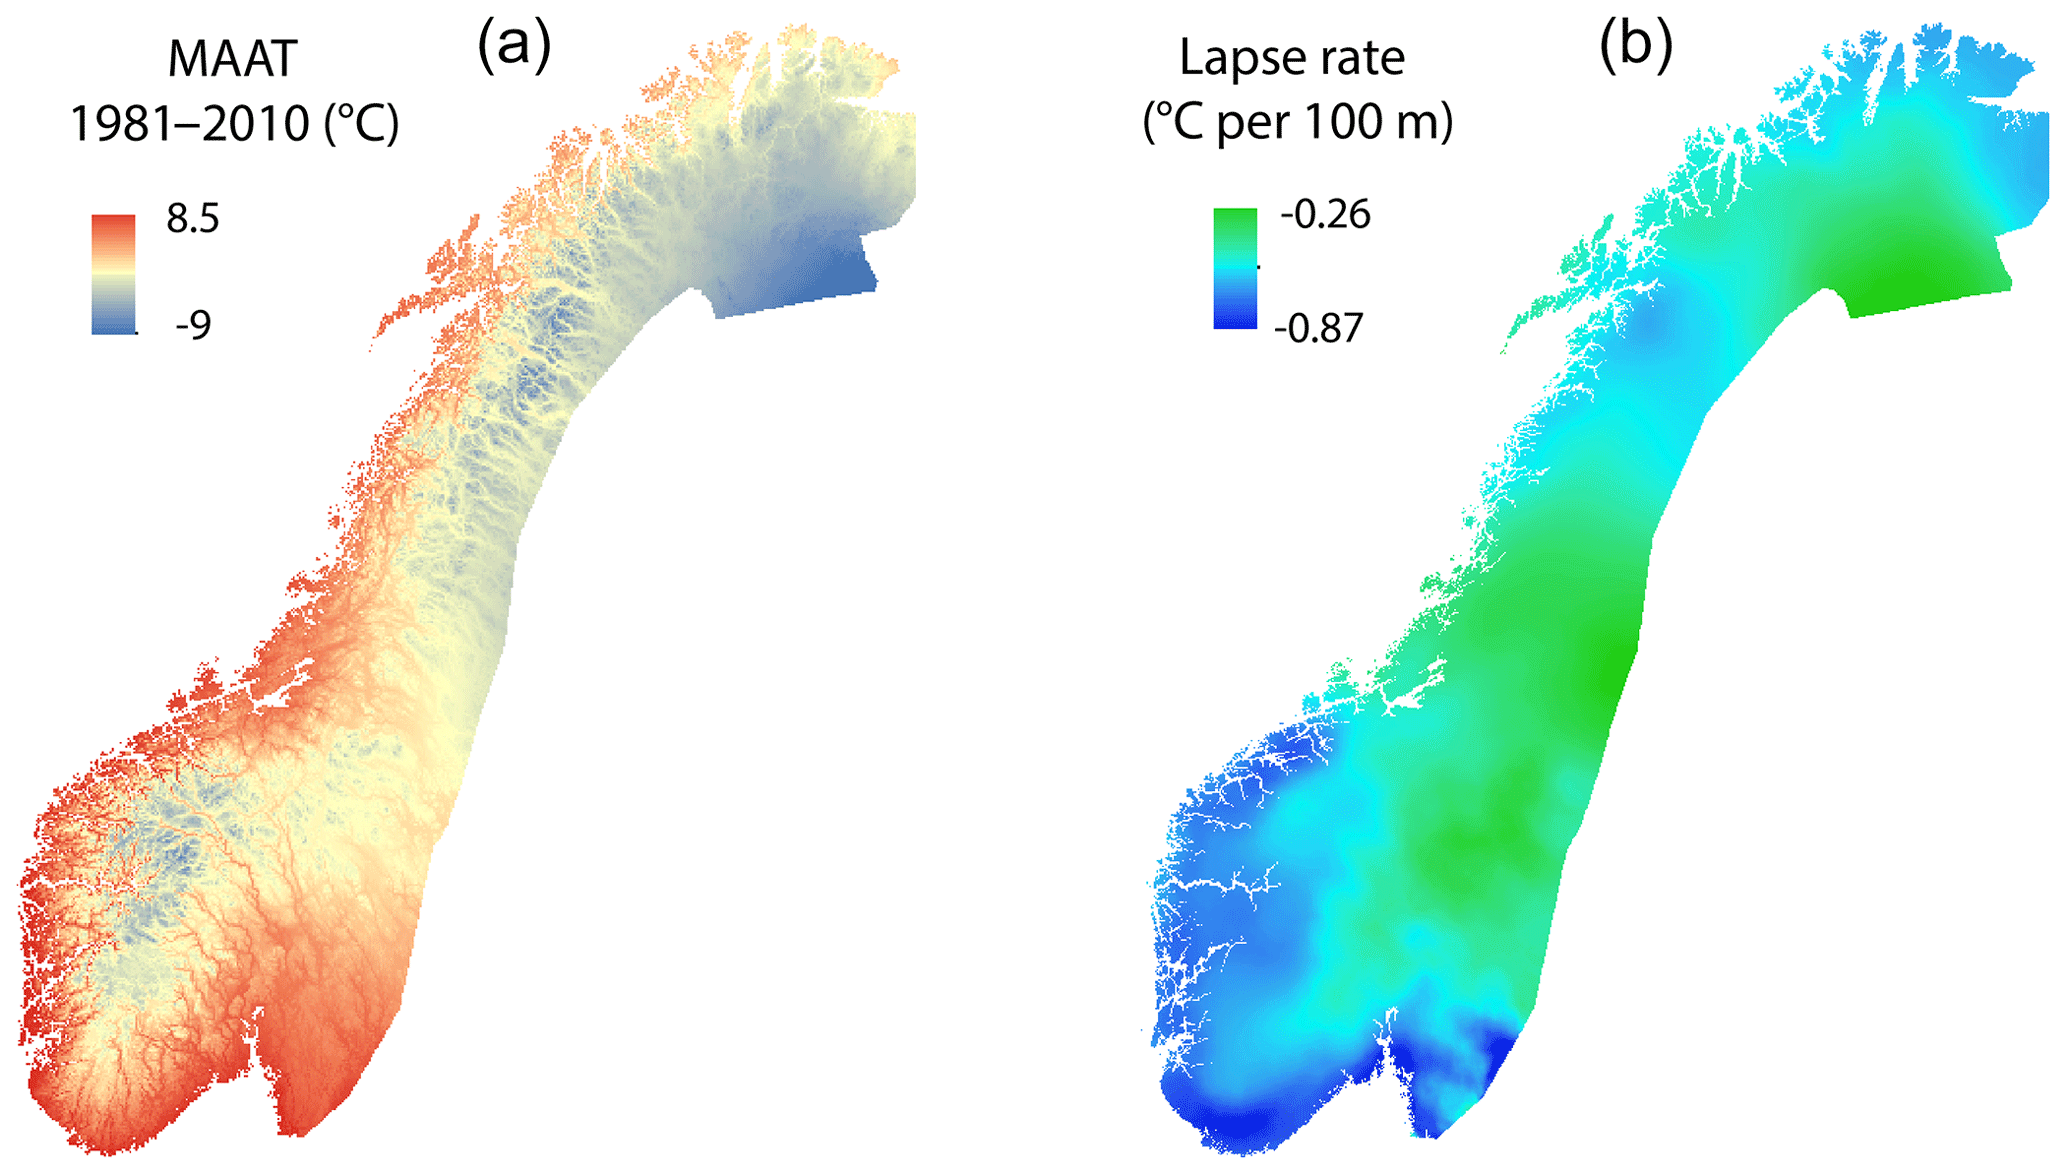
Figure 4The 1 km grid mean annual air temperature (MAAT) derived from the SeNorge2 dataset (a, Lussana et al., 2017) and averaged lapse rate over a 25 km radius (b).
MARSTpred and permafrost probability are then mapped by implementing Eqs. (2) and (4) in a raster calculator. Since the model is only valuable for steep slopes with restricted snow and debris covers, the map is only produced for slopes >40∘, which is a conservative threshold above which a 10 m resolution DEM is expected to display steep slopes. Indeed, DEMs tend to underestimate slope values, and taking a higher threshold value would exclude a large part of possible steep slopes. This, however, entails slopes with possible snow deposit being considered in the mapping step. Nevertheless, the interpretation provided in the following section allows us to interpret permafrost probability according to the rock face characteristics (slope angle, ruggedness and possible snow accumulation).
3.5 Permafrost classes and interpretation keys
The permafrost probability is calculated as a continuous variable ranging from 0 to 1, which is then classified into four permafrost classes according to the international permafrost classification standards (Brown et al., 1997):
-
continuous permafrost for p≥0.9;
-
discontinuous permafrost for ;
-
sporadic permafrost for ; and
-
isolated permafrost for p<0.1.
Similarly to the Alpine-wide Permafrost Map covering the European Alps and its index interpretation keys (Boeckli et al., 2012b), the permafrost classes proposed here are interpreted against local bedrock favourability for snow accumulation (Fig. 5) and a possible cooling effect of dense fracturing, allowing for air ventilation (Hasler et al., 2011b). Indeed, fractured, mid-steep (40 to 60∘) and rugged bedrock surfaces are generally characterized by colder conditions than vertical, unfractured and smooth bedrock surfaces because they allow snow accumulation and eventually debris accumulation and air ventilation in fractures, which all have an overall cooling effect (Hasler et al., 2011b; Magnin et al., 2015a, 2017a; Haberkorn et al., 2015). Nevertheless, snow cover can in some rare cases (thick accumulation in shaded rock faces) rather warm the rock surface compared to snow-free conditions due to thermal insulation (Magnin et al., 2015a; Haberkorn et al., 2017). Finally, the transient effects of past colder conditions also have to be addressed in the interpretation of the permafrost probability map. Therefore, the specific effects of snow accumulation, non-conductive heat transfers in bedrock clefts and transient effects from past climate that are not accounted for in our statistical approach have to be considered when interpreting the permafrost map for specific sites.
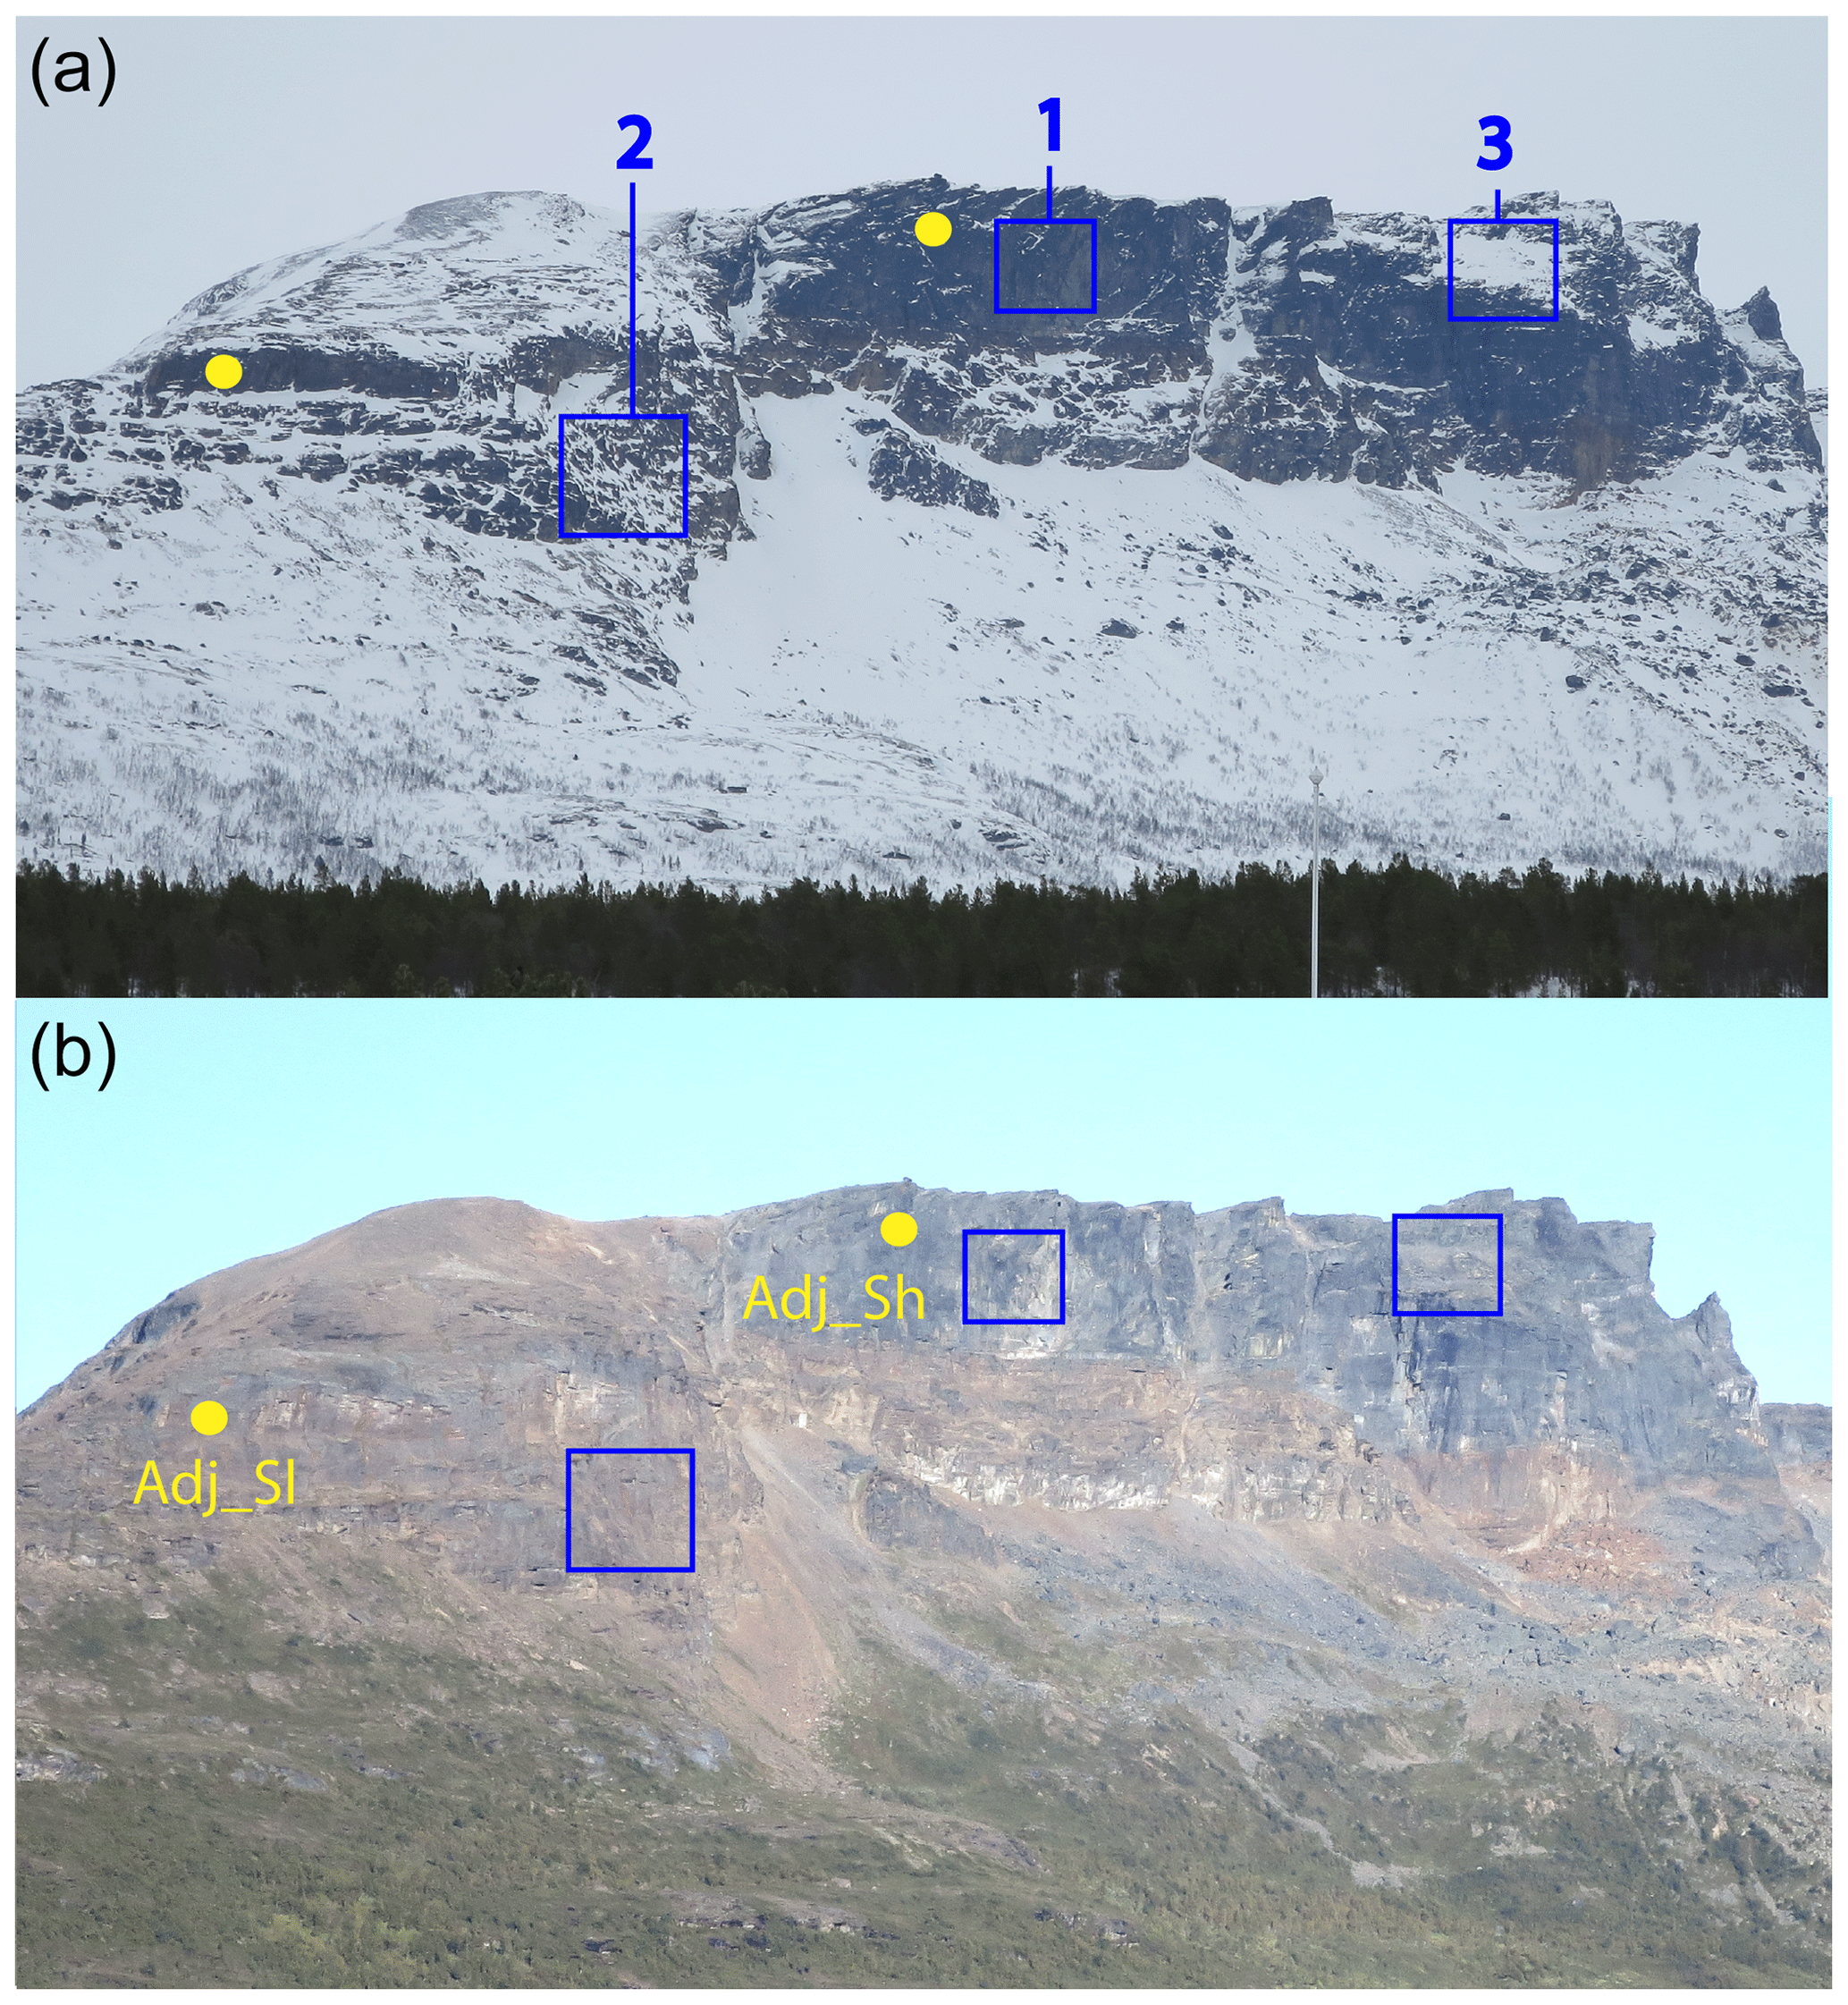
Figure 5Pictures of the Ádjit crest (a: March 2017, b: August 2018) showing variable bedrock settings more or less favourable to permafrost occurrence. 1. Vertical and compact bedrock. 2. Rugged bedrock surface with sparse snow deposits. 3. Mid-steep slope with substantial snow and debris accumulation. Yellow dots indicate logger locations.
The existence of continuous permafrost is thus suggested in all conditions, regardless of the bedrock conditions. Discontinuous permafrost, the lower boundary of which corresponds to MARSTpred=0 ∘C, is suggested to exist in most of the rock faces, except those that are (sub-)vertical, compact and substantially exposed to sunbeams (mostly all aspects except north) or north faces with thick snow cover. Sporadic permafrost suggests that the MARST is most likely positive but that permafrost can exist at depth because of very favourable conditions, meaning that the slope surface is substantially rugged and therefore more significantly fractured, covered by heterogeneous and non-insulating snow and possible debris retention, or because of transient effects. Finally, isolated permafrost refers to isolated and perennial ice bodies found in open bedrock fractures at relatively low elevation.
4.1 Model variables and summary statistics
The lowest MARST registered over the measurement period (Table 4) is found at Juv_S (−4.9 ∘C), the second highest measurement point, in 2012–2013, while the highest MARST (3.5 ∘C) is registered at Fla_S in 2017–2018, which is the most sun-exposed sensor installed at the lowest latitude. The minimum and maximum MAAT values, respectively −5.9 and 0.4 ∘C, are found at the highest and lowest measurement points: Juv_Eh in 2010–2011 and Alt_S in 2016–2017. The lowest PISR value (10 W m2) is at Fla_N, the most shaded sensor of the lowest latitude, and the highest one (295 W m2) is at Adj_S, a high-elevated and south-exposed logger in northern Norway (Fig. 5).

At 11 loggers, the measurements suggest permafrost occurrence (negative MARST every year). Permafrost-free conditions (positive MARST every year) are suggested at nine loggers with recorded MARST consistently >1 ∘C; possible permafrost, with MARST oscillating between −1 and 1.5 ∘C, is found at five loggers (see Table S1). The presence of permafrost is nevertheless not excluded where positive MARSTs are recorded because of the transient effect at depth from former colder periods (Noetzli and Gruber, 2009; Myhra et al., 2017) and a possible temperature offset (i.e. temperature difference between the surface and depth) resulting from fracturing and snow deposits (Hasler et al., 2011b).
The MARST difference between north-exposed and south-exposed faces is around 3.5 ∘C in southern Norway (e.g. 3.5 ∘C at Fla_S and 0.2 ∘C at Fla_N in 2017–2018), while it is around 1.5 ∘C in northern Norway (e.g. 0.2 ∘C at Adj_S and −1.4 ∘C at Adj_N in 2015–2016). This difference between northern and southern Norway coincides with higher PISR values at north-exposed slopes of northern Norway, with, for example, 100 W m−2 more at Adj_N or Gam_N than at Fla_N or Man_N.
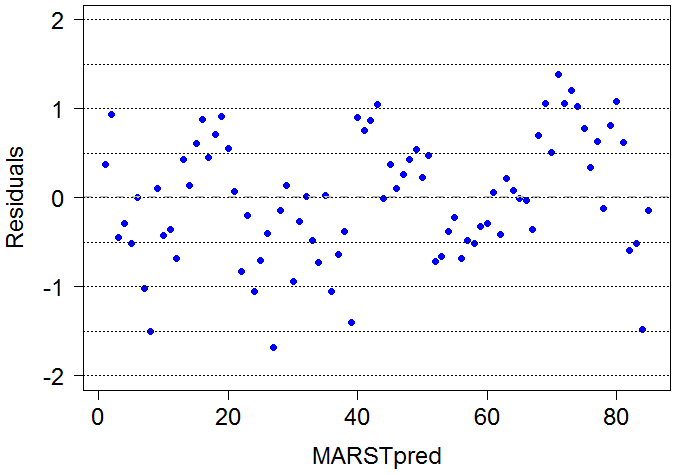
Table 5 summarizes the statistics of the regression model. For most of the measurement points, the MARST is generally higher than the MAAT (Fig. 6a) and the difference between MARST and MAAT (surface offset) increases with increasing PISR (Fig. 6b), confirming previous studies of steep bedrock thermal characteristics (Boeckli et al., 2012a; Magnin et al., 2015a). The surface offset ranges from 0 to 4 ∘C, the highest values being found at the most sun-exposed sites, mostly located in high-elevated south-, east- and west-exposed faces whatever the latitude (Fig. 6b, Table S1). In some rare cases, the MARST is slightly lower than the MAAT (Fig. 6a), which indicates possible factors locally cooling the most shaded rock faces (wind or ice accretion, for example). An increase of 100 W m−2 induces an increase of about 1 ∘C in MARST and is equivalent to an increase of 1 ∘C in MAAT. The adjusted R2, RMSE and MAE demonstrate the good fit of the model, which is corroborated by the consistency of these values with those of the , RMSEcv and MAEcv (Table 5). The model residuals confirm that the data sample is well suited for the chosen statistical approach (Fig. 7): they are randomly distributed around 0 ∘C, and no noticeable outlier is detected.
Table 5Summary statistics of the model. Significance of Wald test: , .
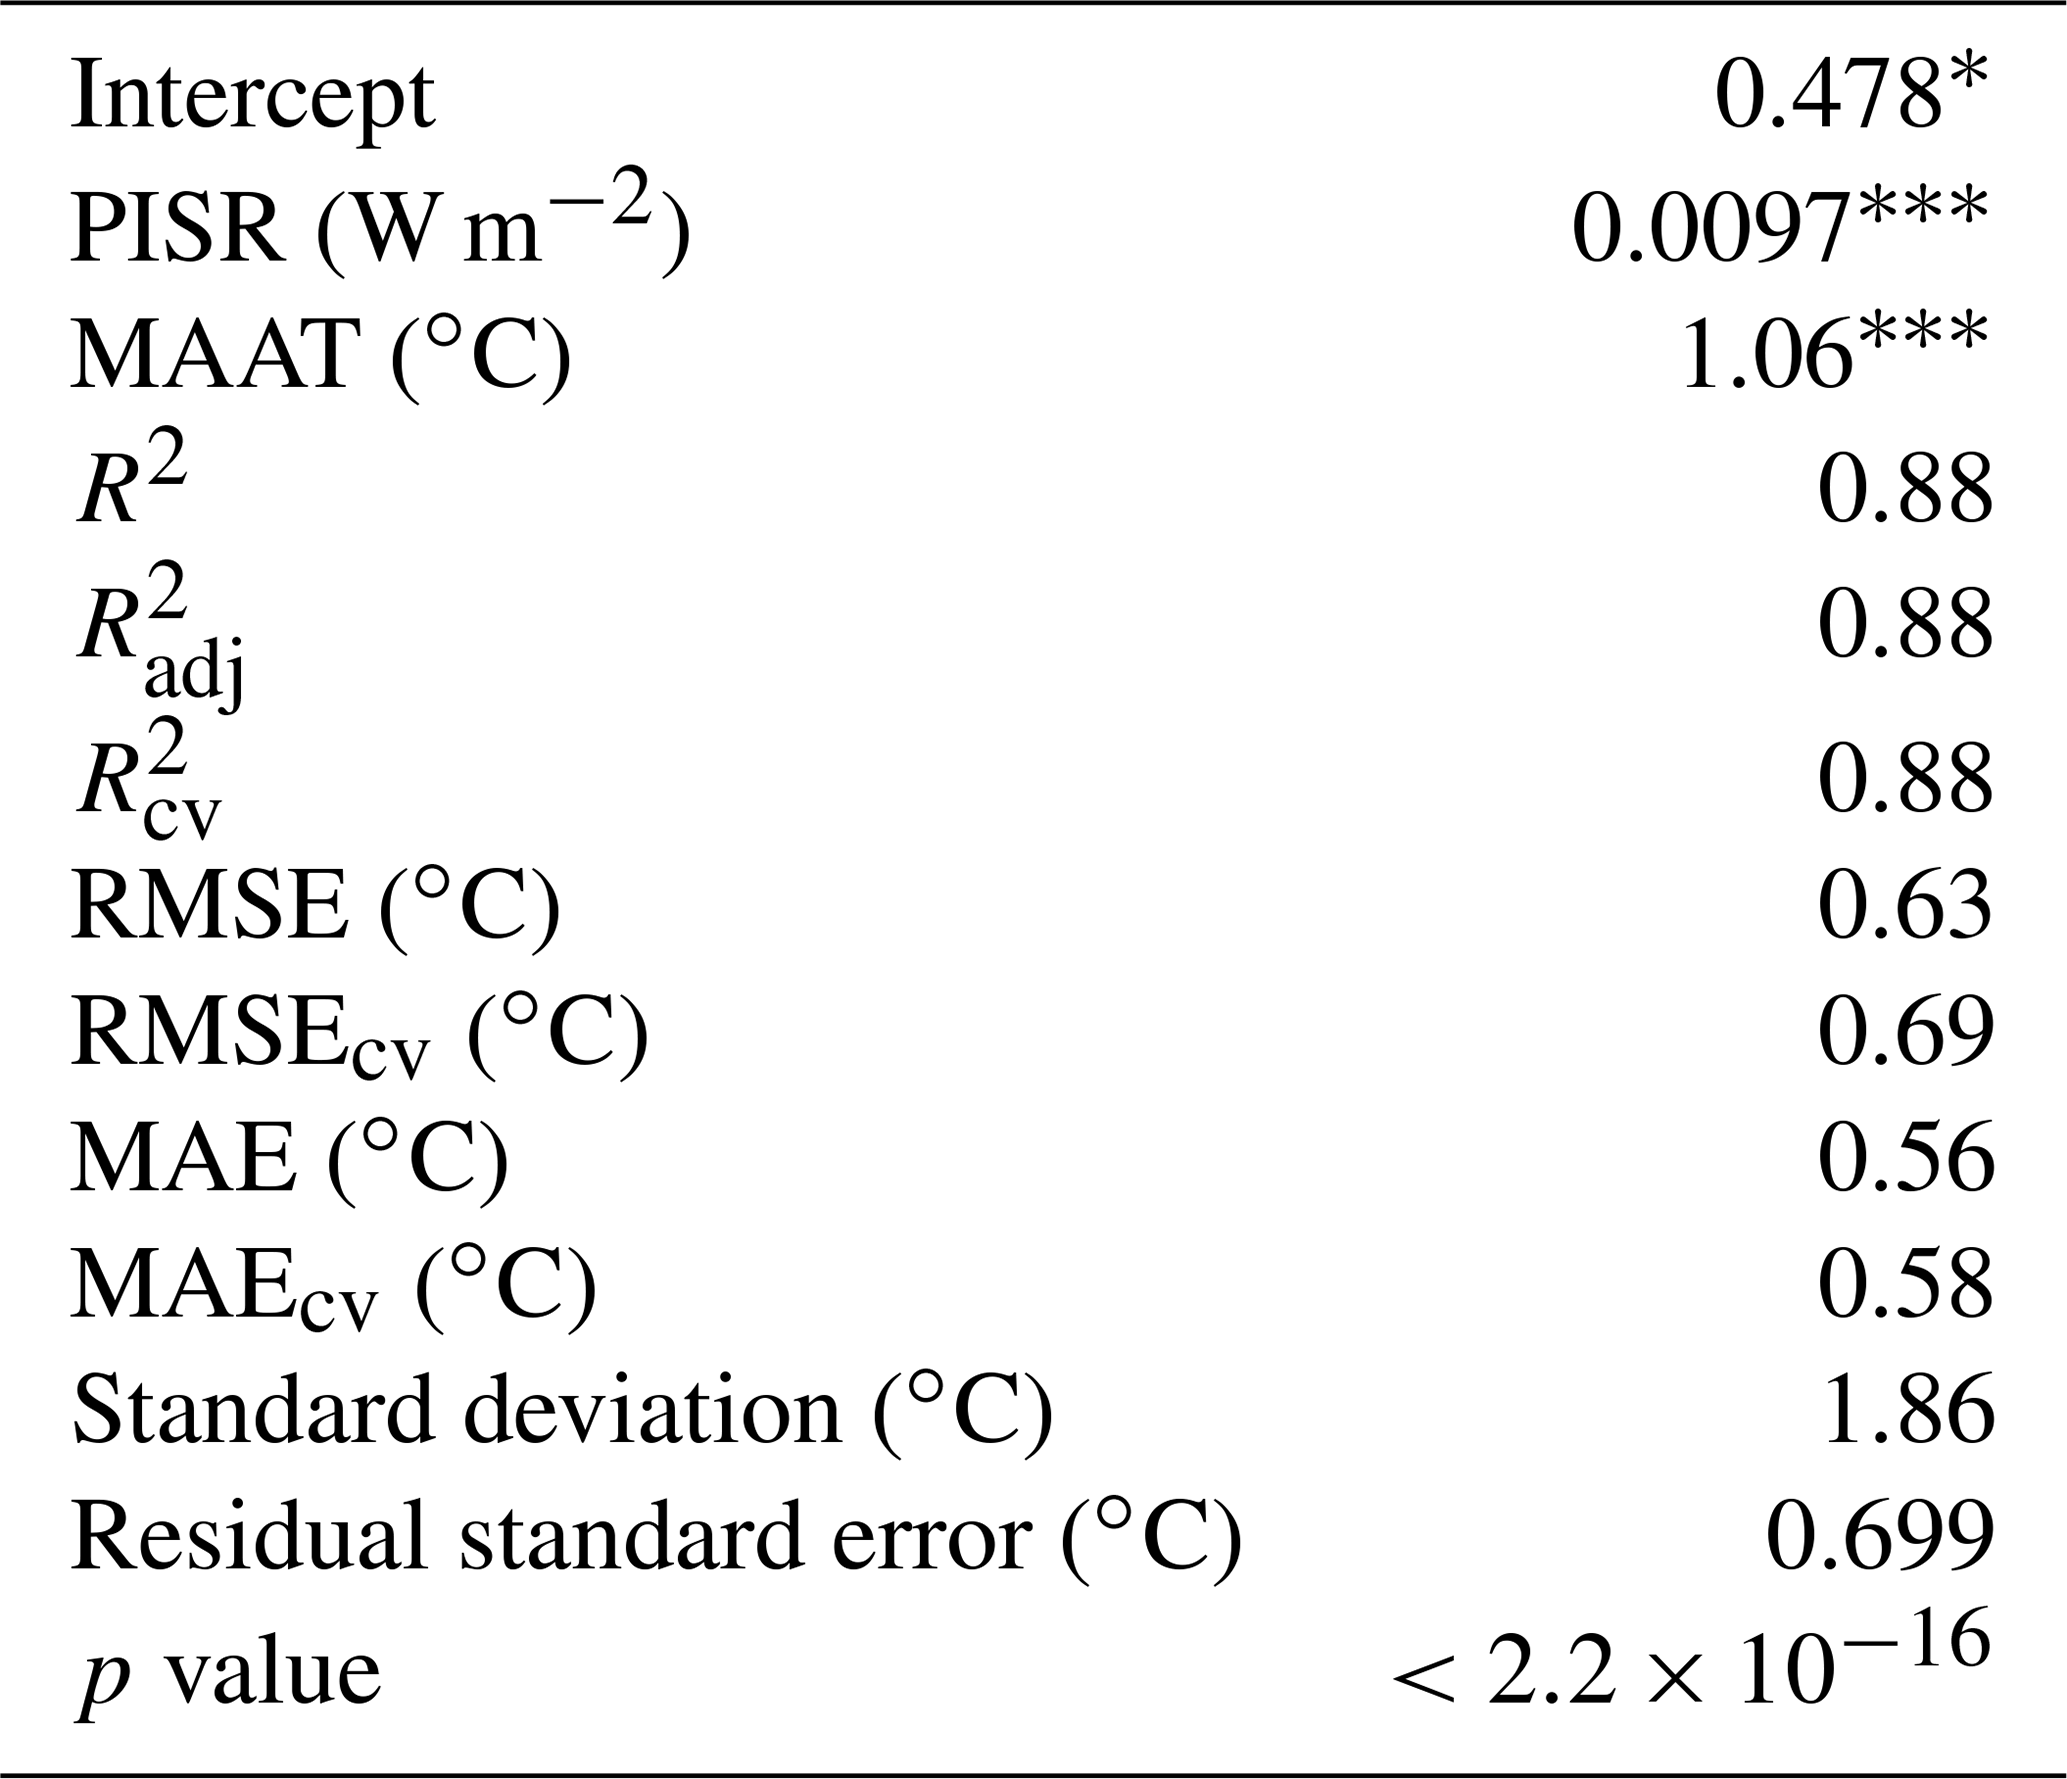
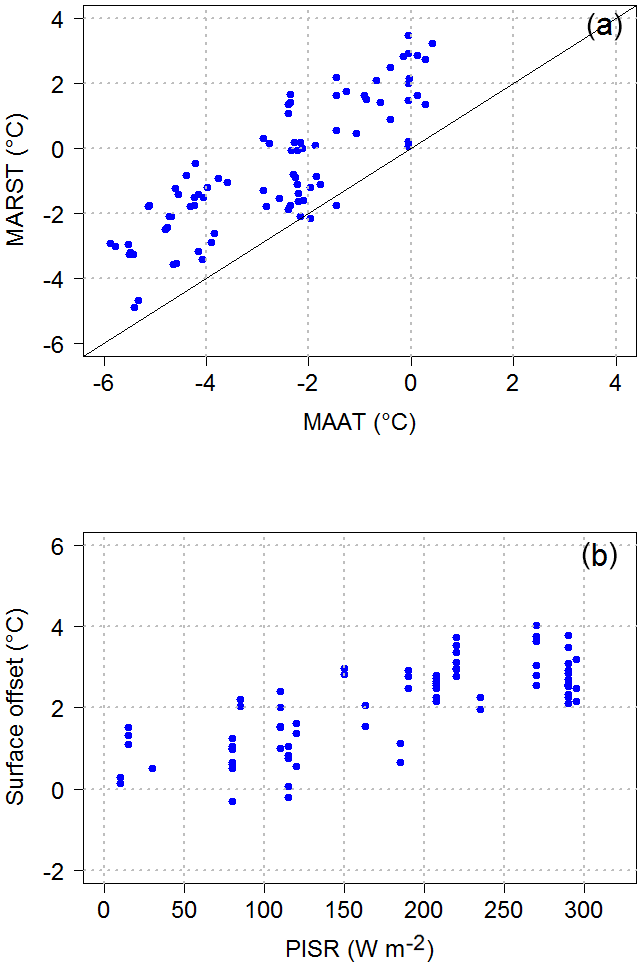
Figure 6(a) Measured mean annual rock surface temperature (MARST) versus interpolated MAAT at the MARST measurement points. (b) Surface offset (i.e. MARST measured – MAAT interpolated) versus calculated potential incoming solar radiation (PISR) at measurement points. The multiple MARST points for the same PISR values result from multiple years of RST records at the same logger and for which the PISR value remains identical.
4.2 Permafrost distribution in steep slopes
Steep slopes represent almost 2 % of the surface area of mainland Norway, constituting about 7300 km2 between sea level and 2460 m a.s.l. (surface area covered by slopes >40∘ on the 10 m resolution DEM). The rock wall surface area is unequally distributed across latitudes with almost 20 % lying between 61 and 62∘ N (Fig. 8a), where the highest peaks of Norway are (Fig. 8b). West-facing slopes are generally predominant (30 %), while south-exposed faces are less frequent (20 %), and north- and east-facing slopes each represent a quarter of the steep slope surface area. However, this national pattern is not constant across latitudes, with, for example, predominantly north-facing slopes between 65 and 67∘ N (Fig. 8a).
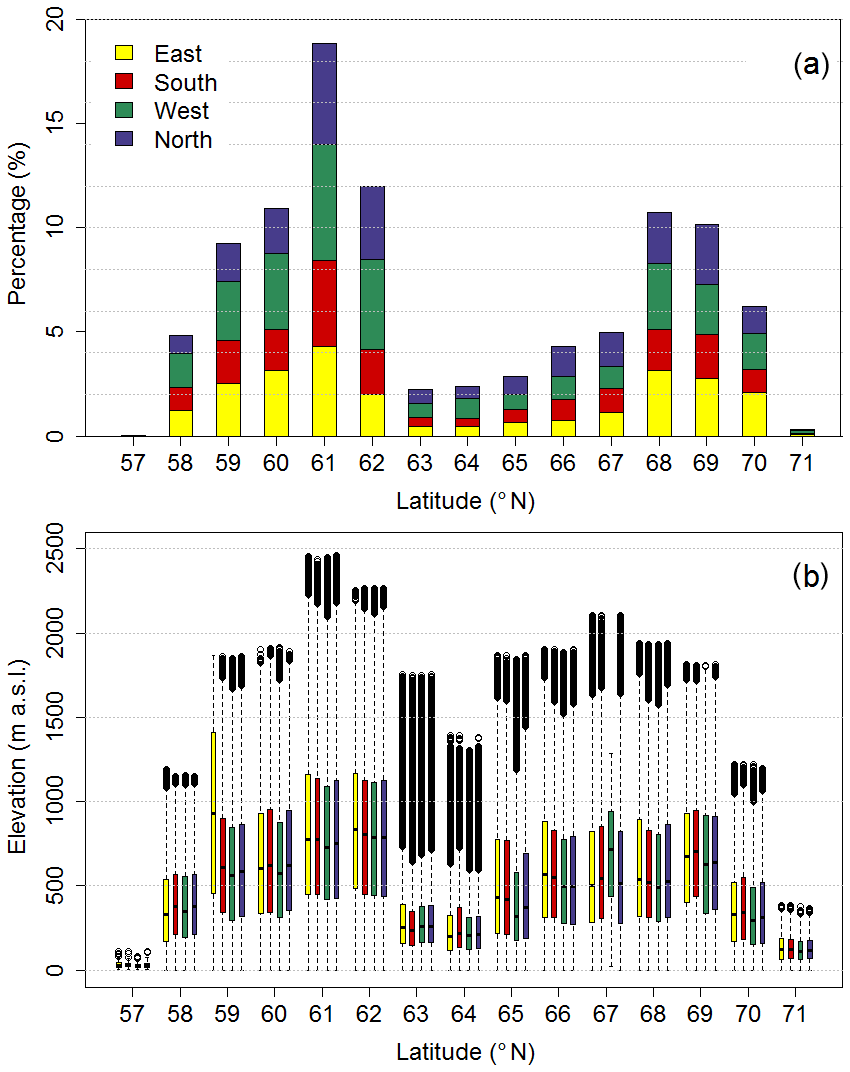
Figure 8Relative distribution of steep rock walls across Norway (slopes >40∘ based on the 10 m resolution DEM). (a) Relative distribution of rock wall surface area according to aspect and latitude. (b) Relative distribution of rock wall according to latitude, aspect and elevation. East: 45 to 135∘; south: 135 to 225∘; west: 225 to 315∘; north: 315 to 45∘. The lowest and highest boundaries of the boxes respectively display the 1st and 3rd quartile (Q1 and Q3) of the observations. The lowest and highest whiskers respectively show and . The dots are the outliers.
Continuous permafrost occupies about 2 % of the rock wall surface area, discontinuous permafrost about 9 % and sporadic permafrost about 20 %, meaning that 31 % of the rock wall surface area features a permafrost probability ≥0.1 and 11 % a probability ≥0.5.
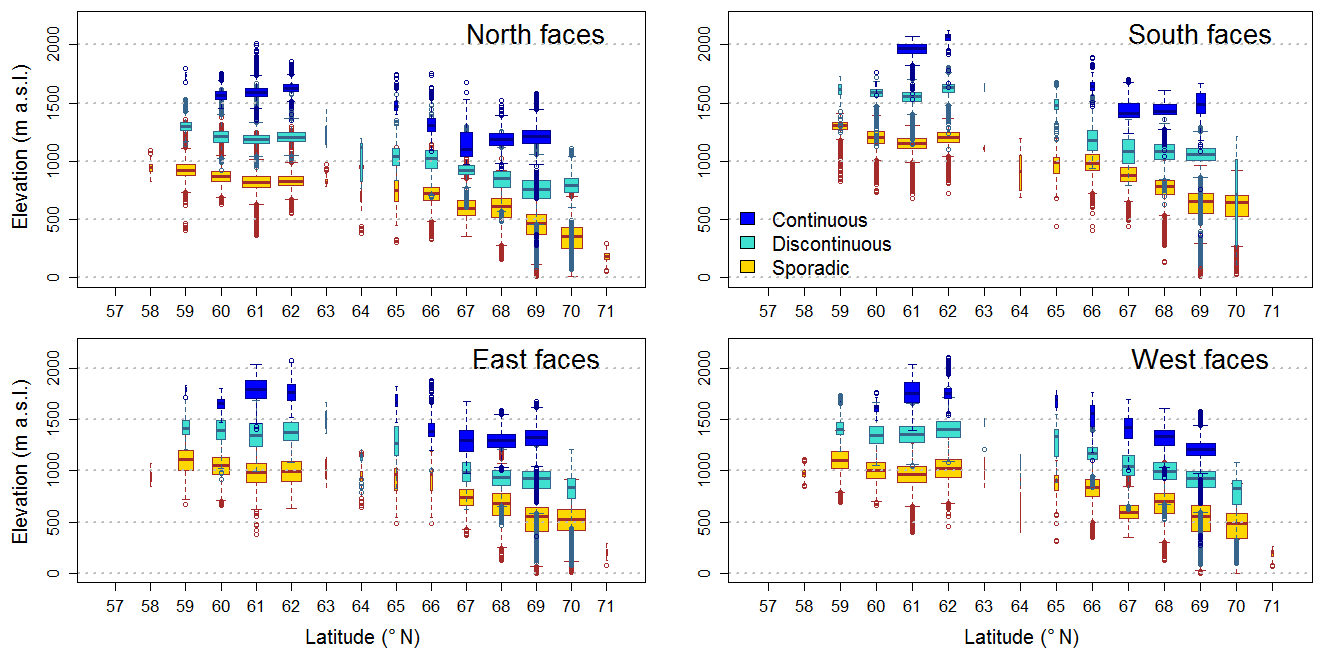
Figure 9Distribution of the lower limit of each permafrost class according to elevation, aspect and latitude. The width of the boxes is proportional to the square roots of the number of observations in the respective groups. The lowest and highest boundaries of the boxes respectively display the 1st and 3rd quartile (Q1 and Q3) of the observations. The lowest and highest whiskers respectively show and . The dots are the outliers.
In Fig. 9 we display the distribution of the lowest occurrence of each permafrost class (i.e. the distribution of the occurrences of probability 0.1, 0.5 and 0.9) according to elevation and latitude. We refer to these lowest occurrences as the “lower altitudinal limit” (LAL) of each permafrost class. In the southernmost part of Norway (58∘ N), sparse occurrences of sporadic permafrost are found as low as 830 m a.s.l. in all aspects, except south (Fig. 9). Discontinuous permafrost occurs from 59∘ N as low as 1150 m a.s.l. in north faces, and 50 % of the LAL observations are above 1300–1400 m a.s.l. At the same latitude, sparse occurrences of continuous permafrost are found from 1700 m a.s.l. in north and east faces. Continuous permafrost is more widespread at 61 and 62∘ N, in accordance with rock wall frequency and elevation. The 1st quartile of the observations of LAL of continuous permafrost is around 1500 m a.s.l. in north faces, 1700 m a.s.l. in east and west faces, and 1900 m in south faces. Little permafrost is found in the steep rock slopes between 63 and 65∘ N, concordant with rock wall frequency and elevation and therefore resulting in a plateau-like pattern in the distribution of permafrost across latitude. From 67 to 69∘ N, continuous permafrost exists mostly above 1100 m a.s.l. in north faces, 1200 m a.s.l. in east and west faces, and 1400 m a.s.l. in south faces. The LAL for discontinuous permafrost decreases from 900 to 700 m a.s.l. in north faces, over 800–900 m a.s.l. for east and west faces, and down to 1000 m a.s.l. for south faces between 67 and 69∘ N. Sparse occurrences of discontinuous permafrost are found as low as 50 m a.s.l. in all aspects at 69 and 70∘ N. At 70∘ N, the permafrost probability reaches a maximum value of 0.9, meaning that continuous permafrost is mostly absent, mainly because rock walls rarely exceed 1000 m a.s.l.
The medians of observations of the LAL for each permafrost class decrease by about 500±50 m from southern to northern Norway, decreasing by about 50 m with every degree northwards for north-facing slopes and by 58 m for the south-facing slopes. For example, the median of the observations of the LAL for discontinuous permafrost at 60∘ N is at 1210 and 1580 m a.s.l. in the north and south faces, respectively, and at 760 and 1060 m a.s.l. at 69∘ N. In southern Norway, permafrost therefore exists 350 to 400 m lower in north faces compared to south faces, while it is found only 200 to 250 m lower in northern Norway. These decreases in the LAL of permafrost classes according to latitude and aspect do not appear to be linear (Fig. 9) because the rock wall distribution significantly controls this relationship (Fig. 8).
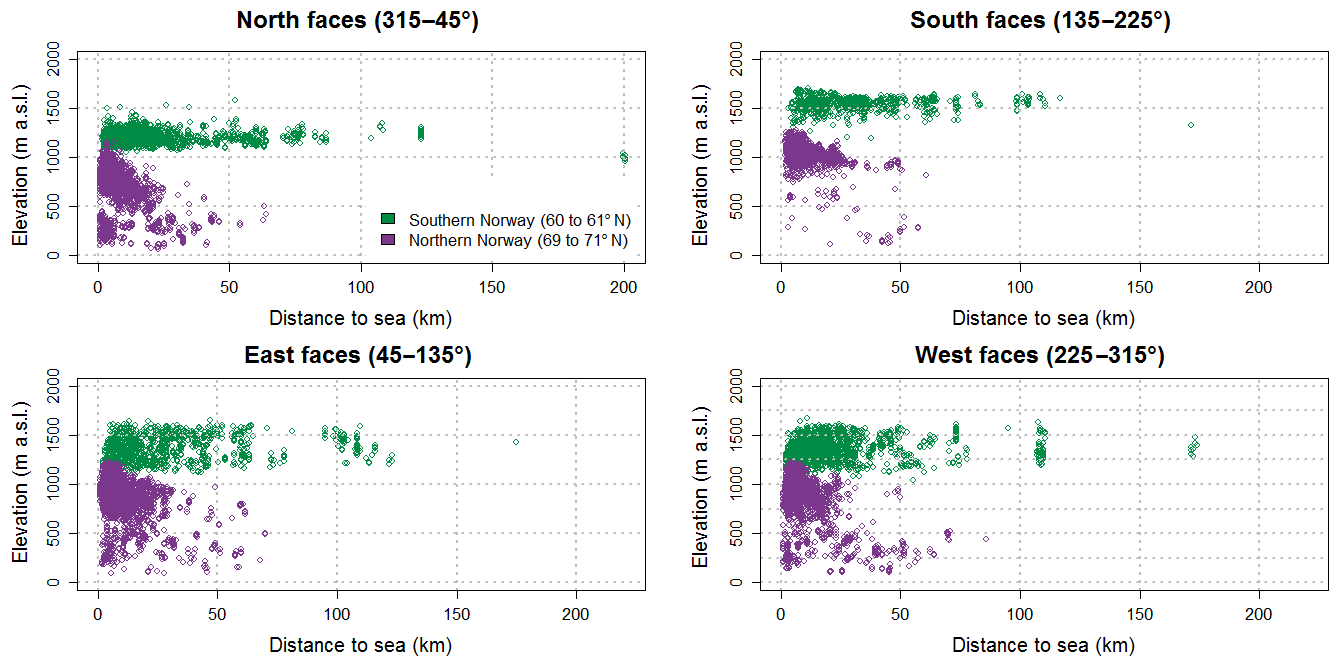
Figure 10Distribution of the lower limit of discontinuous permafrost in southern and northern Norway according to the distance to the sea.
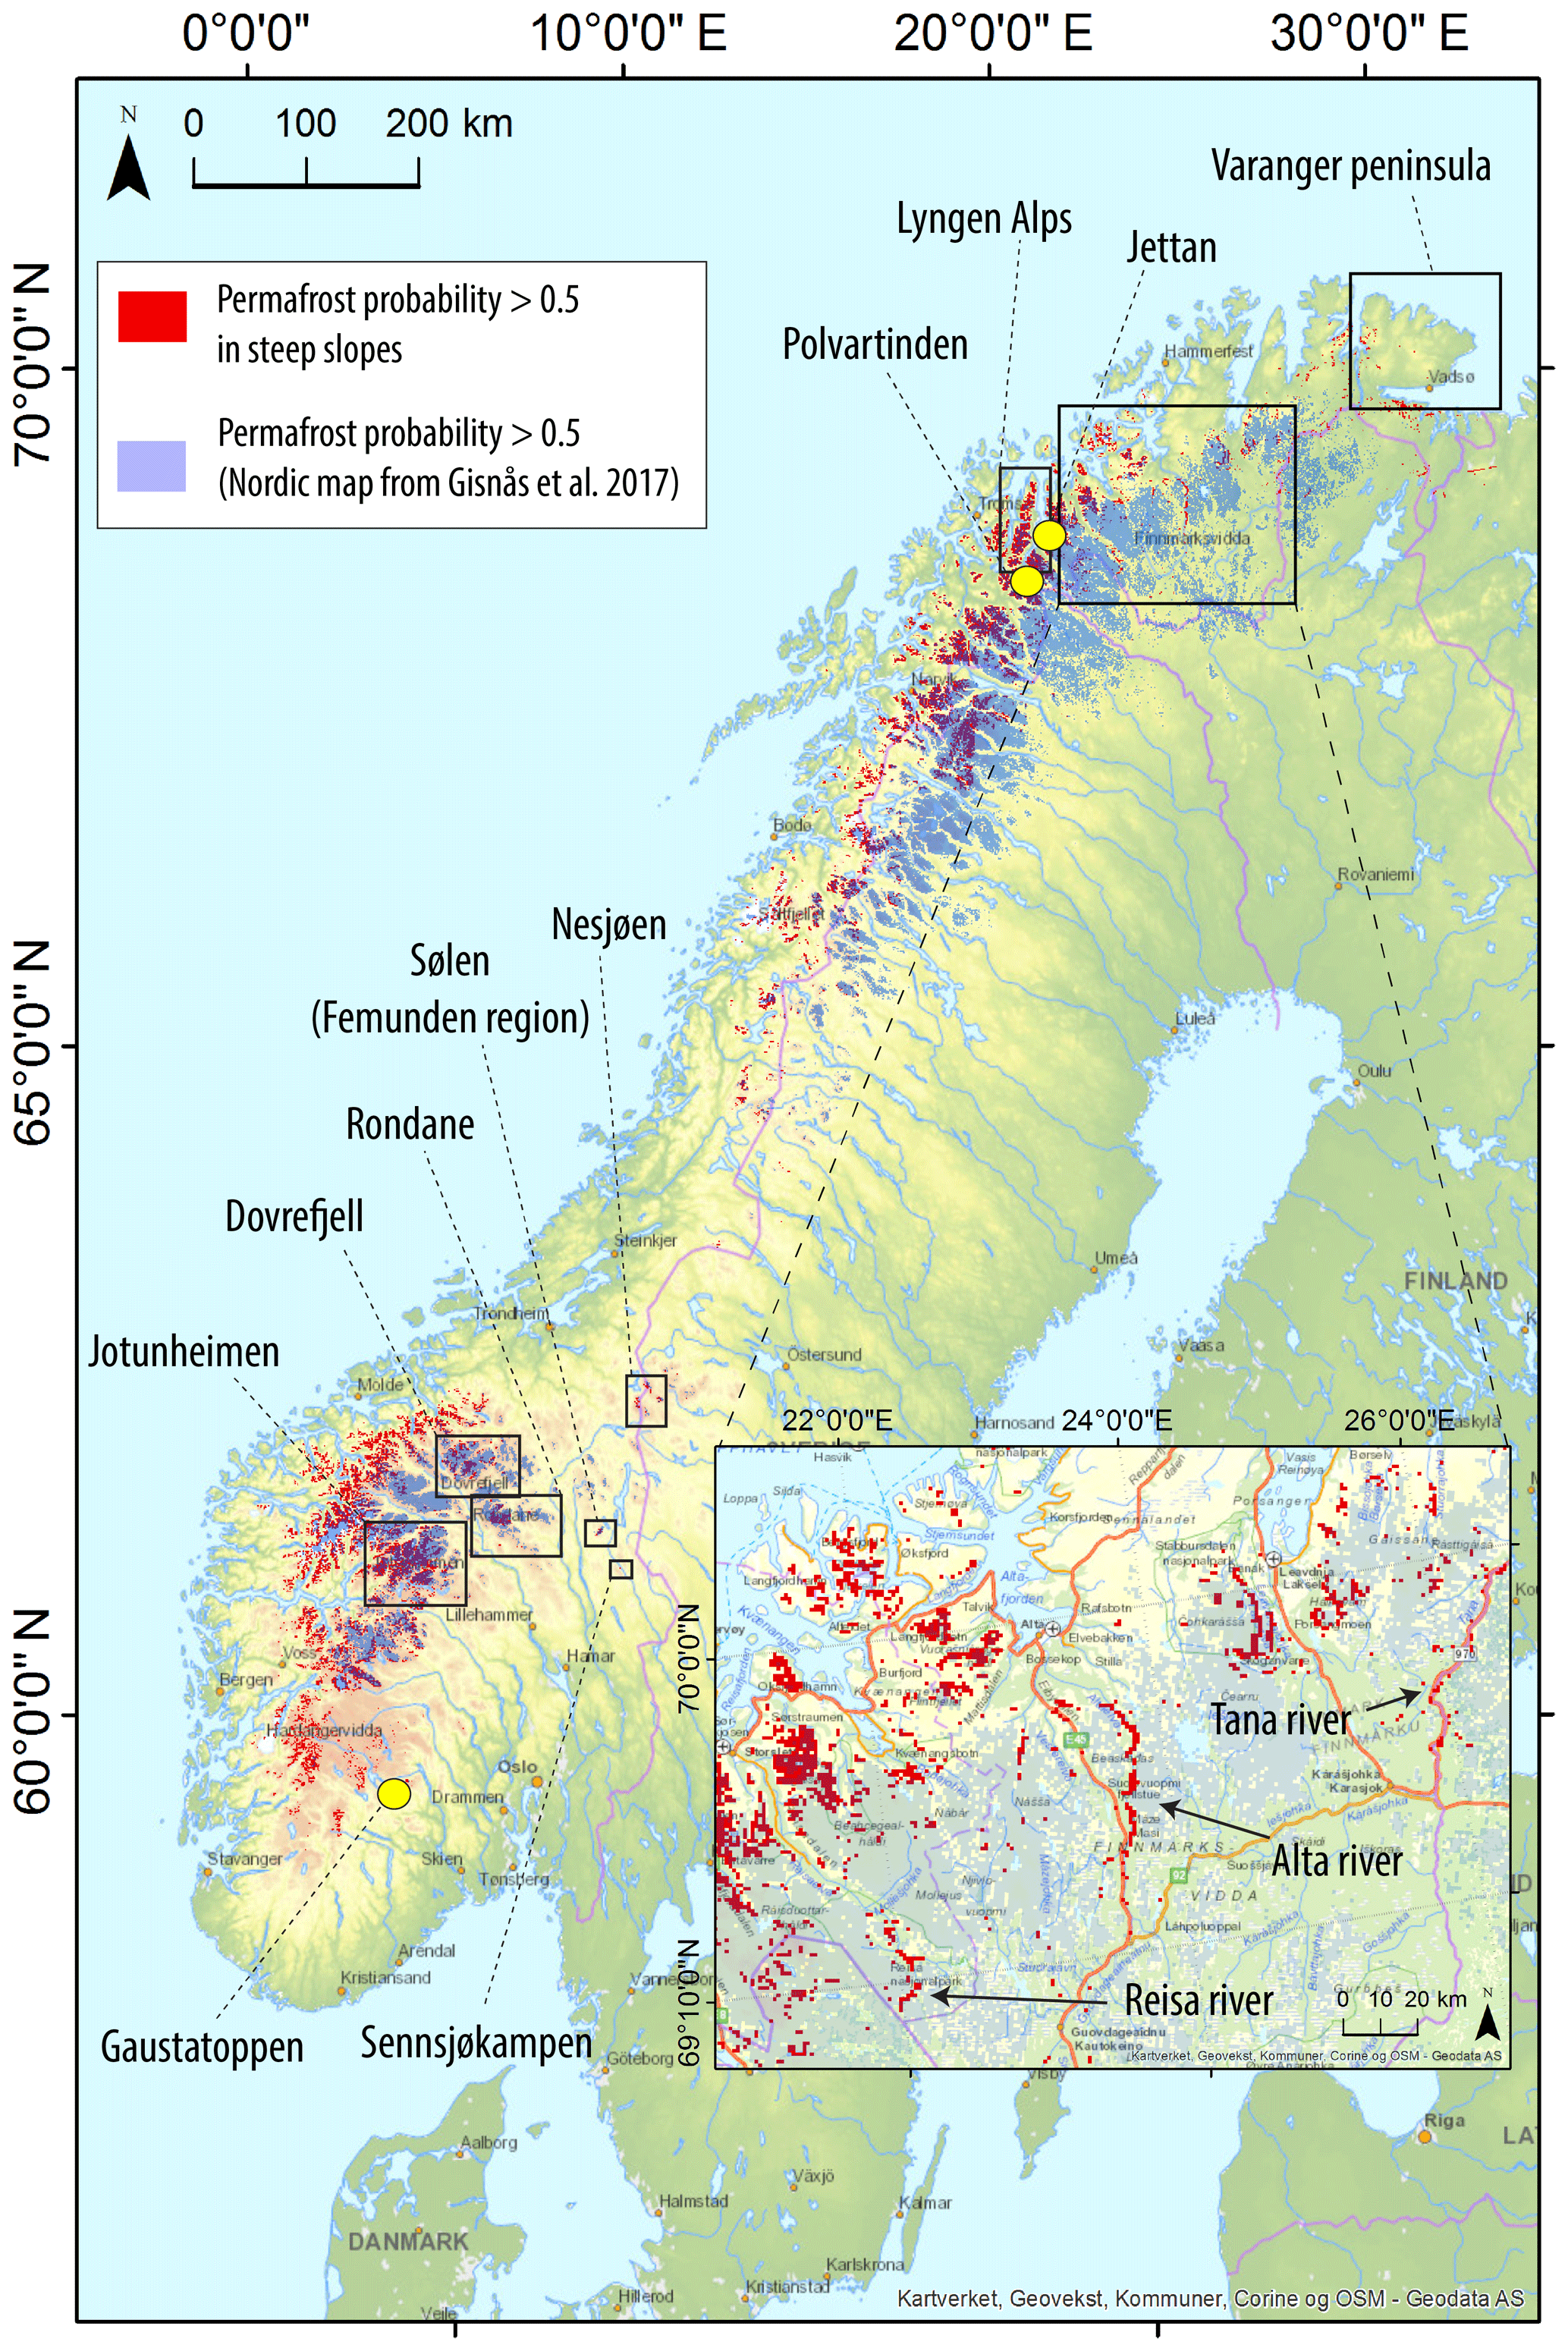
Figure 11Permafrost distribution in steep rock slopes of Norway according to the CryoWall map and in Scandinavia according to the map produced by Gisnås et al. (2017). For steep rock slope permafrost, only the discontinuous and continuous permafrost classes are displayed as the lower limit of discontinuous permafrost corresponds to the 0 ∘C isotherm and covers the main permafrost areas. Areas of interest for the discussion are displayed.
The number of rock slope permafrost observations decreases with continentality (Fig. 10) as most of the rock walls are found close to the coast and in the western mountain massifs of southern Norway such as Jotunheimen, Rondane and Dovrefjell (Fig. 11). The decreasing number of observations in inland areas makes it difficult to draw robust statistical conclusions from the data. This decrease in the number of observations makes a statistical analysis of permafrost distribution according to continentality poorly relevant. Nevertheless, we note that the lowermost occurrences of discontinuous permafrost in north faces of southern Norway are found at the furthest distance from the sea, in Sølen, Sennsjøkampen and the border with Sweden in the Nesjøen area (Figs. 10 and 11). In northern Norway, the lowermost occurrences of discontinuous permafrost are not found near the coast but further inland (about 25 to 50 km away from the sea; Fig. 11). At such a distance, low-elevated rock walls (<200 m a.s.l.) are mostly found in river canyons, such as at the Alta, Reisa and Tana rivers (Fig. 11). It is also noteworthy that, in general, the dominant areas of permafrost rock walls are located west of the main distribution of permafrost in Norway according to e.g. Gisnås et al. (2017).
5.1 Model evaluation
To evaluate the permafrost probability model, we compare the permafrost probability map for the steep slopes of Norway, called the“CryoWall map” in the following, to existing, albeit limited in number, permafrost data and evidence (e.g. ice in rock fall scars) in steep slopes of Norway. Unlike gentle slope permafrost, on which typical landforms occur, such as rock glaciers or palsas and peat plateaus, permafrost in steep slopes only becomes evident by ice in rock fractures or failure scars. In northern Norway, Blikra and Christiansen (2014) observed sporadic permafrost in the fractures of the Jettan rock slide, extending from 400 to 800 m a.s.l., which is corroborated by the CryoWall map (Figs. 11 and 12a). About 45 km south-west of Jettan, the detachment of a 500 000 m3 rock mass uncovered ice in the scar from the east face of Polvartinden (1275 m a.s.l.) in June 2008. Frauenfelder et al. (2018) simulated permafrost in the Polvartinden summit using 2-D numerical modelling tools based on several years of rock wall temperature information. These simulations estimated a lower limit of permafrost (0 ∘C isotherm) at about 650 m, which is the top of the rock slope failure and the lower limit of discontinuous permafrost (also the 0 ∘C isotherm in our approach) suggested by the CryoWall map (Fig. 12b).

Figure 12Permafrost distribution at steep slope sites where permafrost has been previously observed in Norway (a: Blikra and Christiansen, 2014; b: Frauenfelder et al., 2018; c: Etzelmüller et al., 2003b). The CryoWall map has been combined with the 1 km resolution Nordic permafrost map (Gisnås et al., 2017) to display predicted permafrost in all types of terrain.
In southern Norway, Etzelmüller et al. (2003b) report that ice was found during construction work in the 1950s at about 1500–1600 m in the bedrock of Gaustatoppen (1883 m a.s.l.), where the CryoWall map indicates discontinuous permafrost (Fig. 12c). Gaustatoppen is made of Precambrian quartzite; it is prone to macrogelivation and therefore to the producing of geometric blocks (Sellier, 1995). Combined with slopes rarely exceeding 55∘, this results in a significant debris cover, favouring snow accumulation in winter and permafrost persistence, even with a relatively low probability value. Protruding rock outcrops also exist at Gaustatoppen, but they are generally highly fractured and covered by thin snow in winter, which also makes them favourable for permafrost persistence.
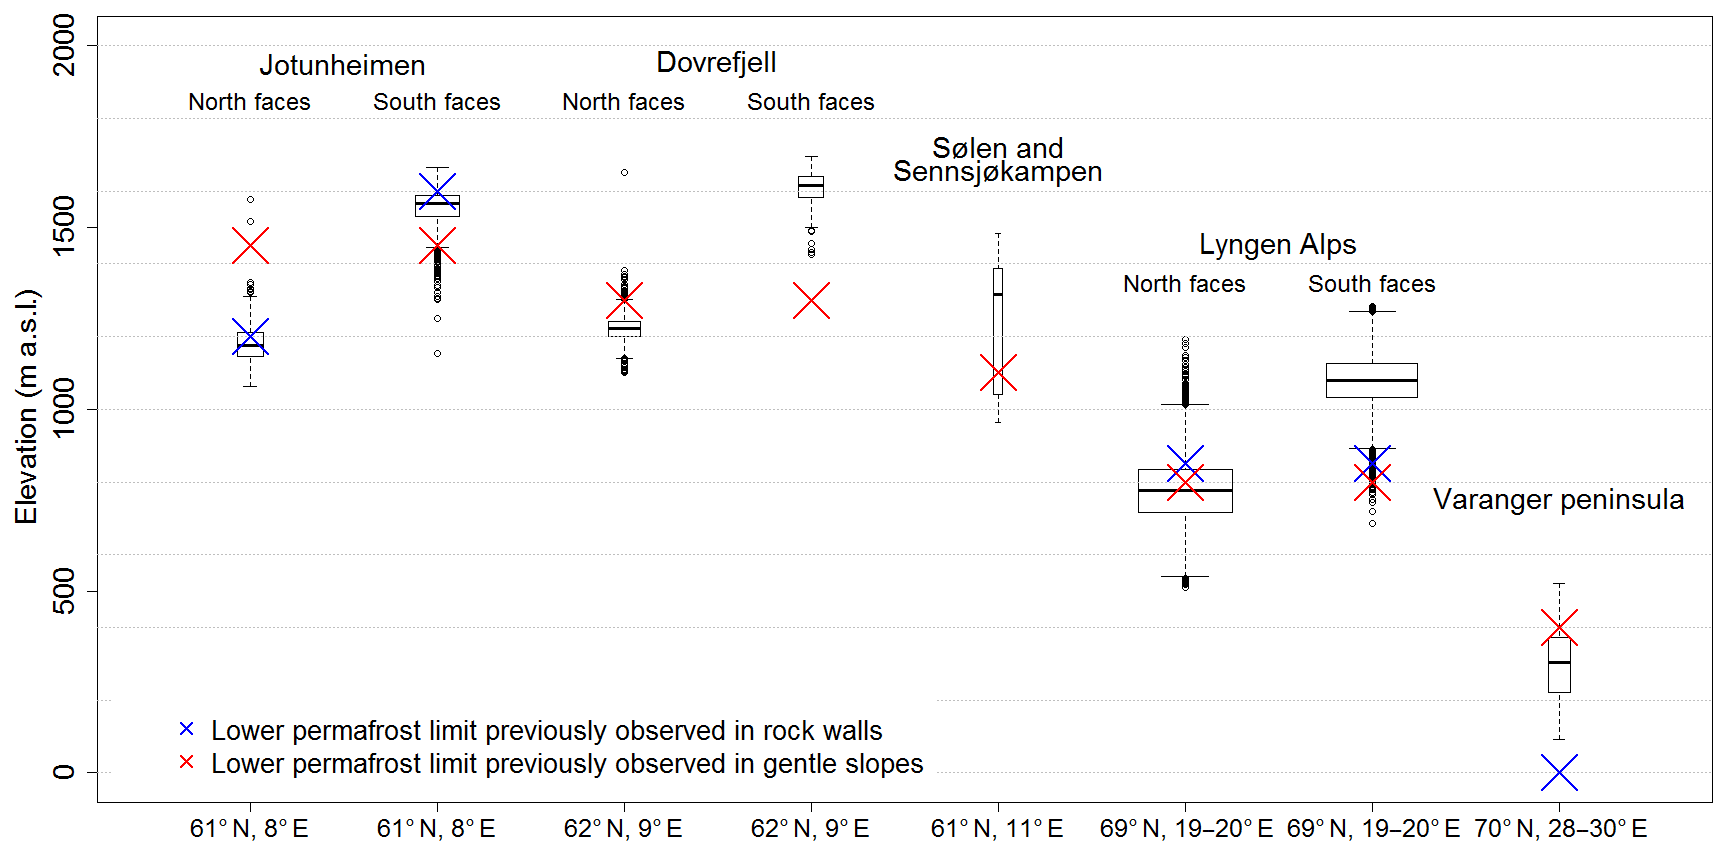
Figure 13Comparison of steep slope permafrost distribution in specific regions with estimations from previous studies (Hipp et al., 2014; Isaksen et al., 2002, 2008, 2011; Farbrot et al., 2011, 2013; Sollid et al., 2003; Westermann et al., 2013; Heggem et al., 2005; Steiger et al., 2016; Gisnås et al., 2017; Borge et al., 2017). The width of the boxes is proportional to the square roots of the number of observations in the respective groups.
In relation to the study by Steiger et al. (2016), our approach is an improvement as (i) we calibrate our model with observations and therefore account for the important influence of topographic aspect, (ii) we use an updated and improved spatial interpolation method for air temperature that has been used to build the SeNorge2 dataset (Lussana et al., 2017), and (iii) we downscale AT using a regional lapse rate instead of using a standard and uniform one. The main pattern of steep slope permafrost distribution is comparable, while local deviations related to sun exposure are substantial. For example, Steiger et al. (2016) suggested a lower limit of rock wall permafrost around 850 m a.s.l. in the Lyngen Alps, which is the limit of the 3rd quartile of observations of the LAL for discontinuous permafrost in north faces and below the 1st quartile of these observations in the north faces (Fig. 13). Steiger et al. (2016) also found a lower limit of rock wall permafrost close to sea level in the Varanger Peninsula (70∘ N), while the CryoWall map suggests discontinuous permafrost above 100 m a.s.l. only (Fig. 13).
Comparison with results from Myhra et al. (2017), who modelled permafrost distribution and evolution since the LIA for four sites in Norway, is limited because of the idealized test cases considered in this study, which do not account for local topographical characteristics and insolation. A comparative figure of the CryoWall map and Myhra et al. (2017) models is provided in the Supplement (Fig. S3).
5.2 Permafrost characteristics in the steep slopes of Norway compared to other areas
Permafrost affecting steep rock slopes has mostly been studied in rock walls of the European Alps (45–46∘ N), where the lower limit of the 0 ∘C isotherm lies around 2800±300 m a.s.l. in north faces and 3800±300 m a.s.l. in south faces of the Bernina and Mont Blanc massifs (Gruber et al., 2004a, b; Magnin et al., 2015b). This difference of about 1000 m of elevation between north and south faces is directly imputed to the solar radiation control, which results in a MARST difference reaching 8 ∘C between the north and south faces of the same elevation. In British Columbia (Canada), north faces are 4 ∘C colder than south faces between 54 and 59∘ N (Hasler et al., 2015). In the Southern Alps of New Zealand, at 43∘ S, differences between north and south faces reaching a maximum of 5 ∘C were reported (Allen et al., 2009). Our study presents MARST measurements at higher latitudes, where smaller and decreasing north–south differences with latitude are observed. This is the result of less and more direct solar radiation in south- and north-facing slopes, respectively, which is reinforced at higher latitude due to the polar night in winter and midnight sun during summer. This also explains the greater difference of the LAL of each permafrost class between south and north faces towards lower latitudes (Fig. 9, Sect. 4.2), where the south faces receive more solar radiation, unbalancing the air temperature controls, while the north-facing slopes receive less direct solar radiation and are more directly controlled by air temperature.
Despite the solar radiation control, which seems to be predominant in the rock slope permafrost distribution patterns from local to continental scales, additional factors may also play a role. The snow that accumulates in various thicknesses in steep slopes has been recognized as a significant factor affecting permafrost conditions at the local scale in the European Alps, as it attenuates both the winter cooling (Haberkorn et al., 2017) and the insolation heating in late winter and spring (Magnin et al., 2017a). In Norway frost coating is common at high-elevated rock walls exposed to supercooled water in clouds and strong wind. These heavy ice accretions and snow deposits on slope ruggedness can certainly result in significant inter-annual variability of MARST in the prevailing wind direction and preferential snow deposition (Frauenfelder et al., 2018). Furthermore, energy exchanges due to latent and sensible heat effects that are relatively more important in high-latitude and maritime settings than in more continental mountain areas possibly affect the permafrost patterns. In the same way, cloudiness, which is generally more important in maritime settings, may also play an important role. This is evidenced by the relatively small north–south difference in the Southern Alps of New Zealand (Allen et al., 2009) that are at a rather low latitude but famous for their high precipitation rates. This is confirmed by Sattler et al. (2016), who have attributed an unusually low permafrost limit in debris slopes in the maritime areas of New Zealand to the frequent cloud cover in summer. Such effects are not easily detectable by means of visual control or statistical analysis and point out the need for more physics-based investigations in order to better understand their respective influence on MARST patterns and permafrost distribution. However, the good fit of observations with the simple linear model indicates that such effects are only of minor relevance for Norway and do not strongly affect the overall permafrost distribution in steep slopes.
5.3 Permafrost characteristics in the steep slopes compared to other permafrost terrains in Norway
The distribution of permafrost has been estimated in various regions of southern and northern Norway by means of bottom temperature of snow cover (BTS) measurements (Haeberli, 1973), rock glacier inventories, ground temperature monitoring, geophysical soundings and numerical models. The locations of the areas mentioned below are displayed on Fig. 11.
In central southern Norway, the LAL of gentle slope permafrost decreases with continentality (Fig. 13), being at ca. 1500 m a.s.l. in Jotunheimen (Isaksen et al., 2002; Farbrot et al., 2011), down to 1300 m a.s.l. in Dovrefjell (Sollid et al., 2003; Isaksen et al., 2011; Westermann et al., 2013), and 1100 m a.s.l. in more eastern continental terrain in the Femunden region (Heggem et al., 2005; Westermann et al., 2013; Gisnås et al., 2017). The CryoWall map confirms this general pattern across continentality (Fig. 10), but this decrease does not follow the same pattern in steep rock slopes as it is strongly dependent on sun exposure (Fig. 13). For example, in Jotunheimen, the lower limit of discontinuous permafrost in south-facing rock walls is at the same elevation as the lower limit of discontinuous permafrost observed in gentle slopes (Fig. S3a), while in Dovrefjell, the lower limit of discontinuous permafrost in gentle slopes rather corresponds to the lower limit of discontinuous permafrost in north-exposed rock slopes (Fig. S3b). In the easternmost region, rock faces are rare and therefore evidence of permafrost distribution in steep rock slopes is sparse and mostly limited to the Sølen and Sennsjøkampen areas (see location in Fig. 11). Discontinuous permafrost is found as low as 960 m a.s.l. in the north face of Sennsjøkampen, and above 1290 m a.s.l. in south, east and west faces of Sølen (Fig. 13), which is generally higher than in surrounding slopes where permafrost generally occurs at much lower elevations (Heggem et al., 2005, Fig. S3c). Thus, there is an increasing discrepancy between permafrost distribution in steep and surrounding gentle slopes across continentality. The eastwards gradient in the lower limit of permafrost in gentle slopes is attributed to a decrease in the altitudinal limit of block fields and snowfall amounts (Farbrot et al., 2011), while in steep rock faces that are more coupled with the atmosphere, this is rather an effect of decreasing air temperature (Fig. 4). In the western maritime parts, thick snow cover prevents intense cooling in winter, a general pattern already suggested by Gruber and Haeberli (2009). This insulating snowpack balances the cooling effect of block fields, while in the eastern continental part, this latter effect is predominant due to reduced snow cover. As a result, in western parts, the overall permafrost conditions in gentle slopes are more in accordance with air temperature (a result of the counter-effects of insulating snow cover and cooling block fields) and therefore with surrounding steep bedrock slopes. Conversely, in the eastern parts, the ground temperature is much lower than the air, and therefore permafrost occurs at much lower elevations than in rock walls.
In northern Norway, the LAL of discontinuous permafrost in gentle slopes and flat terrains lies around 800–900 m a.s.l. in the coastal mountains, such as in the Lyngen Alps (Farbrot et al., 2013; Steiger et al., 2016), and decreases to 300–500 m a.s.l. in the coastal areas and mires in the inner part of Finnmark such as the Varanger Peninsula (Isaksen et al., 2008; Farbrot et al., 2013; Borge et al., 2017). Observations in the coastal rock slopes of the Varanger Peninsula (Fig. 13) show that permafrost can occur at lower elevations than in gentle slopes. The only rock faces existing in the inner part of Finnmark are mostly river canyons such as the Alta and Tana rivers, where discontinuous permafrost occurs between 100 and 600 m a.s.l. (Figs. 10 and 11), favoured by the high confinement and resulting low solar radiation input. The occurrence of permafrost may be underestimated in some places of continental areas due to local temperature inversion, which is smoothed by the regional lapse rate calculation (Fig. 4).
5.4 Implications for landscape development and hazard assessment in Norway
The CryoWall map confirms most of the previous findings in terms of permafrost occurrence and distribution in steep rock slopes inferred from visible ice or numerical modelling experiments in Norway The collected RST time series and CryoWall map may be used to model the permafrost evolution through time using the predicted MARST map or the measured RST as upper boundary conditions for 1-D or 2-D simulations (Hipp et al., 2014; Magnin et al., 2017a, b). The permafrost models and the CryoWall map could then support investigations on large-scale rock slope deformations, slope hazards such as rock falls and the assessment of geomorphological processes. To illustrate some of the research problems our map can contribute to, we give some examples and analysis in the following.
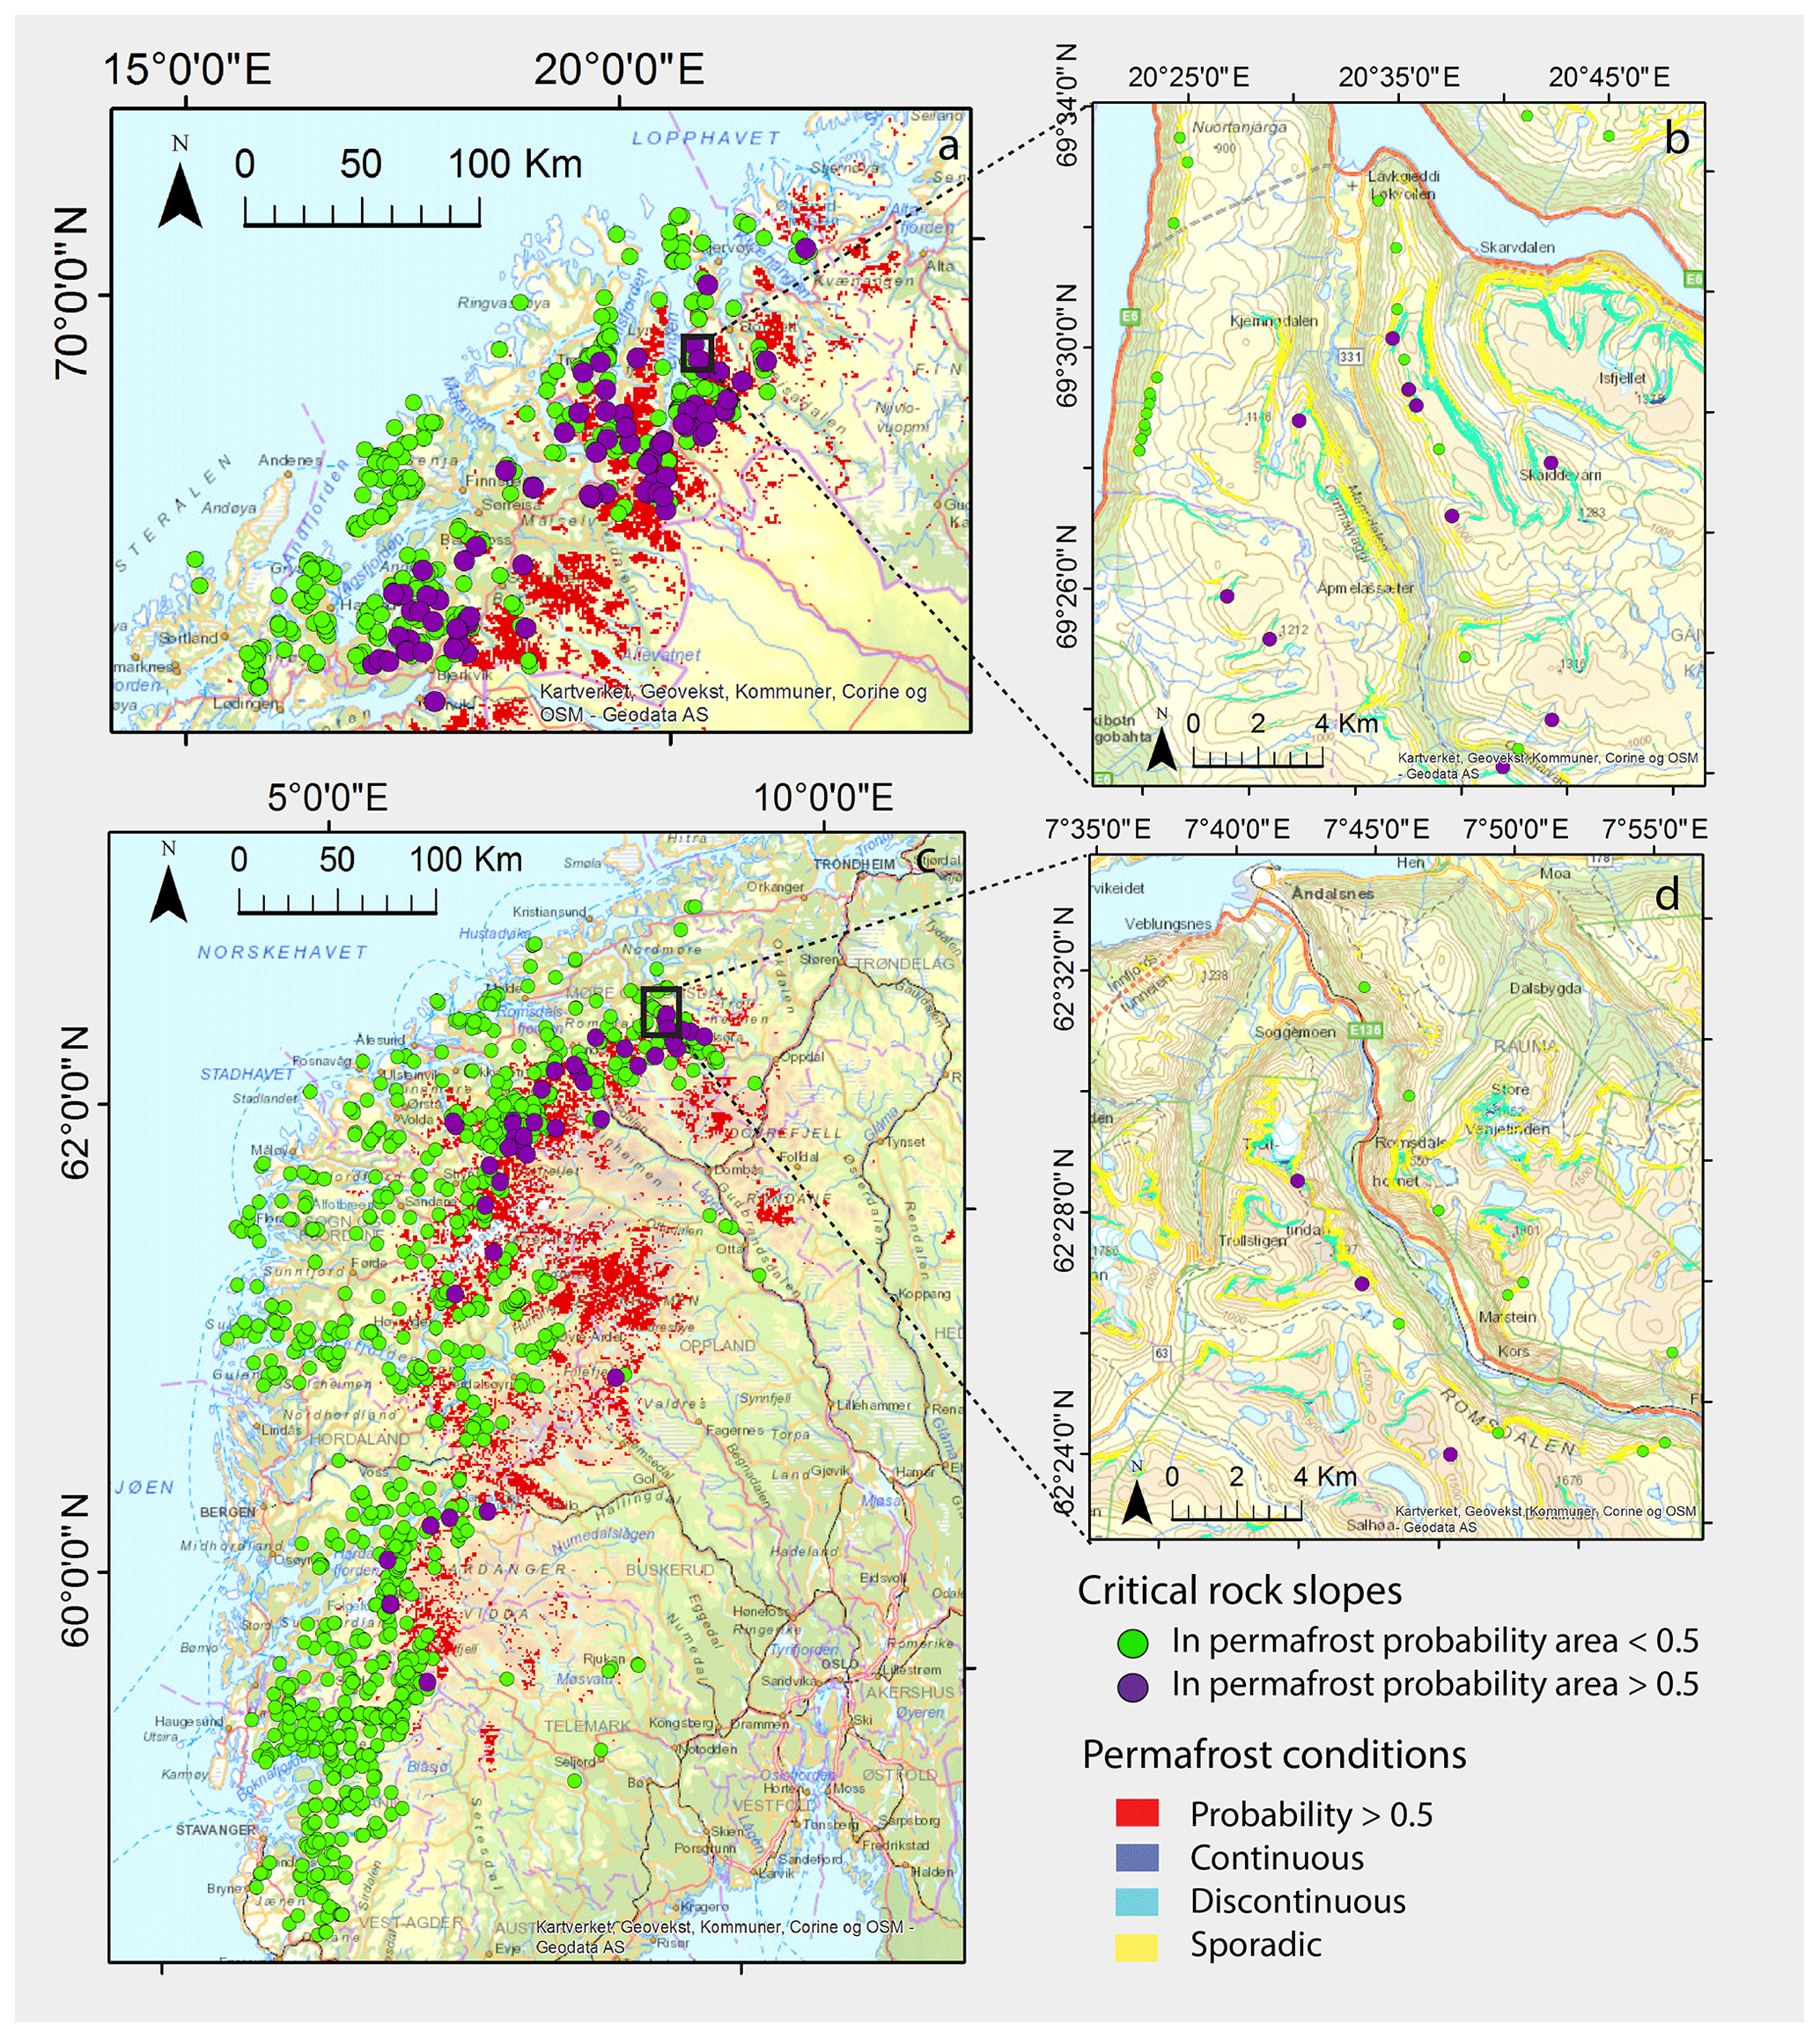
Figure 14Distribution of inventoried ice-cored moraines and active rock glaciers compared to the CryoWall map and the Nordic permafrost map from Gisnås et al. (2017) at 1 km resolution.
Large-scale rock slope deformations in Norway. In the Norwegian mountains, numerous sites with large-scale instabilities have been identified through systematic mapping and surveillance during the last years (e.g. Hermanns et al., 2012; Bunkholt et al., 2013; Oppikofer et al., 2015). Seven sites comprise a high hazard level justifying the installation of an early warning system, two of which have been equipped with RST loggers in this study. We now used the CryoWall map to assess permafrost occurrence at “critical slopes” inventoried by the Geological Survey of Norway (Oppikofer et al., 2015; http://geo.ngu.no/kart/ustabilefjellparti_mobil/, last access: 1 December 2018). The database comprises unstable slopes (postglacial deformation that could lead to catastrophic slope failures), deformed rock slopes that can produce rock falls, potentially unstable slopes (that match the structural inventory for failure but have no signs of deformation) and morphological lineaments along steep slopes that are the result of erosional processes. Each critical slope is recorded as a point at about the middle of the slope. To extract permafrost probability at this point and overcome limitations related to the mismatch between the location of steep areas in the respective slopes and the location of the points, we created a buffer of 200 m around each point to ensure that the point surface areas cover most of the slope, including the steep parts. The maximum permafrost probability contained in the buffer area of each point was then extracted for 1339 registered critical slopes, and 11 % of them are permafrost slopes (probability >0.5). The distribution of these critical slopes is displayed in Fig. 14. This preliminary investigation points out the critical slopes that may deserve further investigation on the potential role of permafrost in their ongoing or possibly future destabilization, especially in the current context of climate change and permafrost degradation. As a further step, the hazard level could be statistically linked to the permafrost probability following a similar approach as the one used by Ravanel et al. (2017) in the Mont Blanc massif.
Landscape development. It is evident that an understanding of the thermal regime within mountain slopes, and its development during the past and future, has a geomorphological relevance (Berthling and Etzelmuller, 2011; Hales and Roering, 2007). Frost weathering and stabilization–destabilization of slopes over long timescales due to climate variability and glaciation cycles work in concert and in certain temperature bands. For example, the frost cracking window, which is known as being between −8 and −3 ∘C with a positive gradient at depth (e.g. Hallet et al., 1991; Hales and Roering, 2007), defines a narrow temperature band in which frost weathering processes are most effective, resulting in ice segregation and subsequent rock falls (e.g. Draebing et al., 2017). On the other hand, deep permafrost aggradation–degradation weakens rock masses, with the possibility of larger-scale slope destabilization on longer timescales (e.g. Krautblatter et al., 2013). Moreover, steep rock walls, often snow free or with little snow cover, can influence the thermal regime of adjacent areas due to lateral heat flux (Myhra et al., 2017), with the possibility to maintain large temperature gradients. All these processes influence material predication and the erosion of mountain ranges and contribute to the periglacial realm being an important environment for weathering (Hales and Roering, 2007; Savi et al., 2015), valley formation (Berthling and Etzelmüller, 2011) and landscape planation (“periglacial buzzsaw”) (e.g. Hales and Roering, 2009; Egholm et al., 2015).
Finally, the RST time series collected for this study may be used for a detailed analysis of RST patterns over different environmental settings (climate, topography) and support the development of a possible straightforward model of rock wall permafrost distribution at the continental scale (Sect. 5.2). This would require a systematic sampling of steep slopes to ensure their representativeness of an idealized case directly coupled with the atmosphere and no specific topographical settings affecting their insolation, as well as further investigation on the atmospheric moisture and cloudiness controls.
From this study the following main conclusions can be drawn.
-
Sporadic permafrost occupies about 20 % of the steep slope surface area in mainland Norway. It can be found as low as 830 m a.s.l. in north faces at 59∘ N and down to sea level in all aspects in northern Norway.
-
Discontinuous permafrost occupies 9 % of the rock wall surface area and can be found in southern Norway (from 59∘ N), mostly above 1300–1400 m a.s.l. in north faces and 1600–1700 in south faces. In northern Norway, it mainly occurs above 750 m a.s.l. in north faces and 1050 m a.s.l. in south faces.
-
Continuous permafrost occupies 2 % of the rock wall surface area between 59 and 69∘ N, with a substantial presence above 1500 m a.s.l. in north faces and 1900 m a.s.l. in south faces of southern Norway. In northern Norway, it is widespread above 1100 m a.s.l. in north faces and 1400 m a.s.l. in south faces.
-
The difference in mean annual rock surface temperature of north- and south-facing slopes at a similar elevation is about 3.5 ∘C in southern Norway and 1.5 ∘C in northern Norway due to the effect of solar radiation in relation to the polar night–midnight sun effect at higher latitudes. The differences are substantially lower than in reported alpine areas of lower latitudes.
-
The lower elevation limit of permafrost decreases by about 500±50 between southern and northern Norway, with a more pronounced decrease for south-exposed slopes (−50 m for every degree northwards for north-exposed slopes against −58 m for the south-exposed ones).
-
The lower elevation limit of permafrost also decreases across continentality, with occurrences of discontinuous permafrost about 200 m lower in eastern Norway than on the west coast of southern Norway and below 200 m a.s.l. in the river canyons of northern Norway.
-
Steep slope permafrost generally occurs lower than in gentle mountain slopes in north faces but at a higher elevation in south faces. This pattern is nevertheless more or less pronounced depending on the regions of Norway.
The CryoWall map is freely accessible via https://archive.sigma2.no/pages/public/datasetDetail.jsf?id=10.11582/2019.00026 (last access: 30 October 2019; Department of Geosciences, University of Oslo, 2019).
The supplement related to this article is available online at: https://doi.org/10.5194/esurf-7-1019-2019-supplement.
FM led the preparation of the paper with guidance from BE and input from SW, KI, PH and RLH. The overall research project was conducted by BE with significant contributions from the other authors. FM, BE, PH and RLH participated in the installation of the rock temperature loggers and data collection. KI provided some meteorological data.
The authors declare that they have no conflict of interest.
Bas Altena, Thorben Dunse, Justyna Czekirda, Jaroslav Obu, Ove Brynildsvold (all University of Oslo), Joel Fiddes (SLF, Switzerland), Amund Mundhjeld (Raubergstulen) and Solveig Winsvold (NVE) helped with either installing rock wall loggers or reading them out. Cristian Lussana (Meteorological Institute of Norway) guided the processing of the SeNorge2 dataset. We especially thank the NVE section for rock slide early warning (“Fjellskredovervaking”) and its leader, Lars Harald Blikra, both in Stranda and in Kåfjord, Troms, for their enthusiastic support during fieldwork and later discussions. We want to thank all mentioned individuals and institutions as well as the two editors and two reviewers for their valuable remarks and suggestions.
This study is part of the CryoWall project (243784/CLE) funded by the Research Council of Norway (RCN). Additional funding, both directly and indirectly, was provided by the University of Oslo, the Geological Survey of Norway, and the Norwegian Water and Energy Directorate (NVE). Part of the work by the Norwegian Meteorological Institute was funded by the Research Council of Norway through the Climate Research Programme KLIMAFORSK (ACHILLES, project no. 235574).
This paper was edited by Simon Mudd and reviewed by two anonymous referees.
Allen, S. K., Gruber, S., and Owens, I. F.: Exploring steep bedrock permafrost and its relationship with recent slope failures in the Southern Alps of New Zealand, Permafrost Periglac., 20, 345–356, https://doi.org/10.1002/ppp.658, 2009.
Berthling, I. and Etzelmüller, B.: The concept of cryo-conditioning in landscape evolution, Quaternary Res., 75, 378–384, 2011.
Blikra, L. H. and Christiansen, H. H.: A field-based model of permafrost-controlled rockslide deformation in northern Norway, Geomorphology, 208, 34–49, https://doi.org/10.1016/j.geomorph.2013.11.014, 2014.
Boeckli, L., Brenning, A., Gruber, S., and Noetzli, J.: A statistical approach to modelling permafrost distribution in the European Alps or similar mountain ranges, The Cryosphere, 6, 125–140, https://doi.org/10.5194/tc-6-125-2012, 2012a.
Boeckli, L., Brenning, A., Gruber, S., and Noetzli, J.: Permafrost distribution in the European Alps: calculation and evaluation of an index map and summary statistics, The Cryosphere, 6, 807–820, https://doi.org/10.5194/tc-6-807-2012, 2012b.
Bohme, M., Oppikofer, T., Longva, O., Jaboyedoff, M., Hermanns, R. L., and Derron, M.-H.: Analyses of past and present rock slope instabilities in a fjord valley: Implications for hazard estimations, Geomorphology, 248, 464–474, 2015.
Borge, A. F., Westermann, S., Solheim, I., and Etzelmüller, B.: Strong degradation of palsas and peat plateaus in northern Norway during the last 60 years, The Cryosphere, 11, 1–16, https://doi.org/10.5194/tc-11-1-2017, 2017.
Bowling, S. R., Khasawneh, M. T., Kaewkuekool, S., and Cho, B. R.: A logistic approximation to the cumulative normal distribution, J. Ind. Engineering Manage., 2, 114–127, https://doi.org/10.3926/jiem.2009.v2n1.p114-127, 2009.
Brown, J., Ferrians, O. J., Heginbottom, J. A., Melnikov, E.S.: International Permafrost Association Circum-Arctic Map of Permafrost and Ground Ice Conditions, Map CP-45. US Geological Survey, available at: https://pubs.er.usgs.gov/publication/cp45 (last access: 25 October 2019), 1997.
Bunkholt, H., Nordahl, B., Hermanns, R. L., Oppikofer, T., Fischer, L., Blikra, L. H., Anda, E., Dahle, H., and Sætre, S. Database of unstable rock slopes of Norway, in: Landslide science and practice, edited by: Margottini, C., Canuti, P., and Sassa, K., 423–428, Springer, Berlin, Heidelberg, Germany, 2013.
Christiansen, H. H., Etzelmüller, B., Isaksen, K., Juliussen, H., Farbrot, H., Humlum, O., Johansson, M., Ingeman-Nielsen, T., Kristensen, L., Hjort, J., Holmlund, P., Sannel, A. B. K., Sigsgaard, C., Åkerman, J., Foged, N., Blirka, L. H., Pernosky, M. A., and Ødegård, R. S.: The thermal state of permafrost in the nordic area during the international polar year 2007–2009, Permafrost Periglac., 21, 156–181, https://doi.org/10.1002/ppp.687, 2010.
Deline, P., Gruber, S., Delaloye, R., Fischer, L., Geertsema, M., Giardino, M., Hasler, A., Kirkbride, M., Krautblatter, M., Magnin, F., McColl, S., Ravanel, L., and Schoeneich. P.: Ice Loss and Slope Stability in High-Mountain Regions, Snow and Ice-Related Hazards, Risks and Disasters, 521–561, https://doi.org/10.1016/B978-0-12-394849-6.00015-9, 2015.
Department of Geosciences, University of Oslo: Permafrost distribution in steep slopes in Norway, Data set, Norstore, https://doi.org/10.11582/2019.00026, 2019.
Draebing, D., Krautblatter, M., and T. Hoffmann.: Thermo-cryogenic controls of fracture kinematics in permafrost rockwalls, Geophys. Res. Lett., 44, 3535–3544, https://doi.org/10.1002/2016GL072050, 2017.
Egholm, D. L., Andersen, J. L., Knudsen, M. F., Jansen, J. D., and Nielsen, S. B.: The periglacial engine of mountain erosion – Part 2: Modelling large-scale landscape evolution, Earth Surf. Dynam., 3, 463–482, https://doi.org/10.5194/esurf-3-463-2015, 2015.
Etzelmüller, B., Berthling, I., and Sollid, J. L.: Aspects and concepts on the geomorphological significance of Holocene permafrost in southern Norway, Geomorphology, 52, 87–104, https://doi.org/10.1016/s0169-555x(02)00250-7, 2003a.
Etzelmüller, B., Berthling, I., and Ødegård, R.: 1-D-DC-resistivity depth soundings in high mountain areas of Southern Norway – a tool in permafrost investigations, Z. Geomorph., Suppl. Bind, 32, 19–36, 2003b.
Etzelmuller, B., Romstad, B., and Fjellanger, J.: Automatic regional classification of topography in Norway, Norw. J. Geol. – Norsk Geol. Tidsskr., 87, 167–180, 2007.
Farbrot, H., Hipp, T. F., Etzelmüller, B., Isaksen, K., Ødegård, R. S., Schuler, T. V., and Humlum, O.: Air and Ground Temperature Variations Observed along Elevation and Continentality Gradients in Southern Norway, Permafrost Periglac., 22, 343–360, https://doi.org/10.1002/ppp.733, 2011.
Farbrot, H., Isaksen, K., Etzelmüller, B., and Gisnås, K.: Ground Thermal Regime and Permafrost Distribution under a Changing Climate in Northern Norway, Permafrost Periglac., 24, 20–38, https://doi.org/10.1002/ppp.1763, 2013.
Fischer, L., Kääb, A., Huggel, C., and Noetzli, J.: Geology, glacier retreat and permafrost degradation as controlling factors of slope instabilities in a high-mountain rock wall: the Monte Rosa east face, Nat. Hazards Earth Syst. Sci., 6, 761–772, https://doi.org/10.5194/nhess-6-761-2006, 2006.
Fischer, L., Amann, F., Moore, J. R., and Huggel, C.: Assessment of periglacial slope stability for the 1988 Tschierva rock avalanche (Piz Morteratsch, Switzerland), Eng. Geol., 116, 32–43, https://doi.org/10.1016/j.enggeo.2010.07.005, 2010.
Frauenfelder, R., Isaksen, K., Lato, M. J., and Noetzli, J.: Ground thermal and geomechanical conditions in a permafrost-affected high-latitude rock avalanche site (Polvartinden, northern Norway), The Cryosphere, 12, 1531–1550, https://doi.org/10.5194/tc-12-1531-2018, 2018.
Gareth, J. Witten, D., Hastie, T., and Tibshirani, R.: An Introduction to Statistical Learning: With Applications in R, Springer Publishing Company, Incorporated, New York, Heidelberg, Dordrecht, London, 426 pp., 2014.
Gisnås, K., Etzelmüller, B., Schuler, T. V., and Westermann, S.: CryoGRID 1.0: Permafrost Distribution in Norway estimated by a Spatial Numerical Model, Permafrost Periglac., 24, 2–19, https://doi.org/10.1002/ppp.1765, 2013.
Gisnås, K., Westermann, S., Schuler, T. V., Melvold, K., and Etzelmüller, B.: Small-scale variation of snow in a regional permafrost model, The Cryosphere, 10, 1201–1215, https://doi.org/10.5194/tc-10-1201-2016, 2016.
Gisnås, K., Etzelmüller, B., Lussana, C., Hjort, J., Sannel, A. B. K., Isaksen, K., Westermann, S., Kuhry, P., Christiansen, H. H., Frampton, A., and Åkerman, J.: Permafrost Map for Norway, Sweden and Finland, Permafrost Periglac., 28, 359–378, https://doi.org/10.1002/ppp.1922, 2017.
Gruber, S. and Haeberli, W.: Mountain Permafrost, Permafrost soils, edited by: Margesin, R., Springer, Berlin, Heidelberg, Germany, 33–44, https://doi.org/10.1007/978-3-540-69371-0, 2009.
Gruber, S., Hoelzle, M., and Haeberli, W.: Permafrost thaw and destabilization of Alpine rock walls in the hot summer of 2003, Geophys. Res. Lett., 31, L13504, https://doi.org/10.1029/2004GL020051, 2004a.
Gruber, S., Hoelzle, M., and Haeberli, W.: Rock-wall temperatures in the Alps: modelling their topographic distribution and regional differences, Permafrost Periglac., 15, 299–307, https://doi.org/10.1002/ppp.501, 2004b.
Haberkorn, A., Phillips, M., Kenner, R., Rhyner, H., Bavay, M., Galos, S. P., and Hoelzle, M.: Thermal regime of rock and its relation to snow cover in steep alpine rock walls: Gemsstock, Central Swiss Alps, Geogr. Ann. A, 97, 579–597, https://doi.org/10.1111/geoa.12101, 2015.
Haberkorn, A., Wever, N., Hoelzle, M., Phillips, M., Kenner, R., Bavay, M., and Lehning, M.: Distributed snow and rock temperature modelling in steep rock walls using Alpine3D, The Cryosphere, 11, 585–607, https://doi.org/10.5194/tc-11-585-2017, 2017.
Haeberli, W.: Die Basis-Temperatur der winter-lichen Schneedecke als moglicher Indikator fur die Verbreitung von Permafrost in den Alpen, Zeitschrift fur Gletscherkunde und Glazialgeologie, 9, 221–227, 1973.
Haeberli, W., Huggel, C., Kääb, A., Zgraggen-Oswald, S., Polkvoj, A., Galushkin, I., Zotikov, I., and Osokin, N.: The Kolka-Karmadon rock/ice slide of 20 September 2002: an extraordinary event of historical dimensions in North Ossetia, Russian Caucasus, J. Glaciol., 50), 533–546, https://doi.org/10.3189/172756504781829710, 2004.
Hales, T. C. and Roering, J. J.: Climatic controls on frost cracking and implications for the evolution of bedrock landscapes, J. Geophys. Res.-Earth, 112, F02033, https://doi.org/10.1029/2006JF000616, 2007.
Hales, T. C. and Roering, J. J.: A frost “buzzsaw” mechanism for erosion of the eastern Southern Alps, New Zealand, Geomorphology, 107, 241–253, https://doi.org/10.1016/j.geomorph.2008.12.012, 2009.
Hallet, B., J. Walder, and Stubbs, C. W.: Weathering by segregation ice growth in microcracks at sustained sub-zero temperatures: Verification from an experimental study using acoustic emissions, Permafrost Periglac., 2, 283–300, 1991.
Hanson, S. and Hoelzle, M.: The thermal regime of the active layer at the Murtèl rock glacier based on data from 2002, Permafrost Periglac., 15, 273–282, https://doi.org/10.1002/ppp.499, 2004.
Harris, C., Haeberli, W., Mühll, D. V., and King, L.: Permafrost monitoring in the high mountains of Europe: the PACE Project in its global context, Permafrost Periglac., 12, 3–11, https://doi.org/10.1002/ppp.377, 2001.
Hasler, A., Gruber, S., Font, M., and Dubois, A.: Advective Heat Transport in Frozen Rock Clefts: Conceptual Model, Laboratory Experiments and Numerical Simulation, Permafrost Periglac., 22, 378–389, https://doi.org/10.1002/ppp.737, 2011a.
Hasler, A., Gruber, S., and Haeberli, W.: Temperature variability and offset in steep alpine rock and ice faces, The Cryosphere, 5, 977–988, https://doi.org/10.5194/tc-5-977-2011, 2011b.
Hasler, A., Geertsema, M., Foord, V., Gruber, S., and Noetzli, J.: The influence of surface characteristics, topography and continentality on mountain permafrost in British Columbia, The Cryosphere, 9, 1025–1038, https://doi.org/10.5194/tc-9-1025-2015, 2015.
Heggem, E. S., Juliussen, H., and Etzelmüller, B.: Mountain permafrost in Central-Eastern Norway, Norsk Geogr. Tidsskr. – Norw. J. Geogr., 59, 94–108, https://doi.org/10.1080/00291950510038377, 2005.
Hermanns, R., Hansen, L., Sletten, K., Böhme, M., Bunkholt, H., Dehls, J., Eilertsen, R., Fischer, L., L'Heureux, J-.S., Høgaas, F., Nordahl, B., Oppikofer, T., Rubensdotter, L., Solberg, I.-L., Stalsberg, K., and Molina, F. X. Y.: Systematic geological mapping for landslide understanding in the Norwegian context, Landslide and engineered slopes: protecting society through improved understanding, Taylor & Francis Group, London, UK, 265–271, 2012.
Hermanns, R. L., Dahle, H., Bjerke, P. L., Crosta, G. B., Anda, E., Blikra, L. H., Saintot, A., Longva, O., and Eiken, T.: Rock slide dams in Møre og Romsdal county, Norway: Examples for the hazard and potential of rock slide dams, in: Landslide science and practice, 6: Risk Assessment, Management and Mitigation, edited by: Margottini, C., Canuti, P., and Sassa, K., Springer-Verlag, Berlin Heidelberg, Germany, 3–12, https://doi.org/10.1007/978-3-642-31319-6, 2013.
Hermanns, R. L., Oppikofer, T., Roberts, N. J., and Sandøy, G.: Catalogue of historical displacement waves and landslide-triggered tsunamis in Norway, Engineering Geology for Society and Territory-Volume 4, Springer International Publishing, Switzerland, 63–66, ISBN 3319086596, 2014.
Hermanns, R. L, Schleier, M., Bohme, M. Blikra, L. H., Gosse, J., Ivy-Ochs, S., and Hilger, P.: Rock-avalanche activity in W and S Norway peaks after the retreat of the Scandinavian Ice Sheet, in: Advancing Culture of Living with Landslides, edited by: Mikoš, M., Vilimek, V., Yin, Y., and Sassa, K., Springer, Cham, Switzerland, 331–338, 2017.
Hilger, P., Hermanns, R.. L., Gosse, J. C., Jacobs, B., Etzelmüller, B., and Krautblatter, M.: Multiple rock-slope failures from Mannen in Romsdal Valley, western Norway, revealed from Quaternary geological mapping and 10Be exposure dating, The Holocene, 28, 1841–1854, https://doi.org/10.1177/0959683618798165, 2018.
Hipp, T., Etzelmüller, B., Farbrot, H., Schuler, T. V., and Westermann, S.: Modelling borehole temperatures in Southern Norway – insights into permafrost dynamics during the 20th and 21st century, The Cryosphere, 6, 553–571, https://doi.org/10.5194/tc-6-553-2012, 2012.
Hipp, T., Etzelmüller, B., and Westermann, S.: Permafrost in Alpine Rock Faces from Jotunheimen and Hurrungane, Southern Norway, Permafrost Periglac., 25, 1–13, https://doi.org/10.1002/ppp.1799, 2014.
Huggel, C., Zgraggen-Oswald, S., Haeberli, W., Kääb, A., Polkvoj, A., Galushkin, I., and Evans, S. G.: The 2002 rock/ice avalanche at Kolka/Karmadon, Russian Caucasus: assessment of extraordinary avalanche formation and mobility, and application of QuickBird satellite imagery, Nat. Hazards Earth Syst. Sci., 5, 173–187, https://doi.org/10.5194/nhess-5-173-2005, 2005.
Huggel, C., Allen, S., Deline, P., Fischer, L., Noetzli, J., and Ravanel, L.: Ice thawing, mountains falling – are alpine rock slope failures increasing?, Geology Today, 28, 98–104, https://doi.org/10.1111/j.1365-2451.2012.00836.x, 2012.
Isaksen, K., Hauck, C., Gudevang, E., Ødegård, R. S., and Sollid, J. L.: Mountain permafrost distribution in Dovrefjell and Jotunheimen, southern Norway, based on BTS and DC resistivity tomography data, Norsk Geogr. Tidsskr. – Norw. J. Geogr., 56, 122–136, https://doi.org/10.1080/002919502760056459, 2002.
Isaksen, K., Farbrot, H., Blikra, L. H. Johansen, B., and Sollid, J. L.: Five-year ground surface temperature measurements in Finnmark, northern Norway, Proceedings of the Ninth International Conference on Permafrost, edited by: Kane, D. L. and Hinkel, K. M., Institute of Northern Engineering, University of Alaska Fairbanks, Fairbanks, Alaska, USA, 789–794, 2008.
Isaksen, K., Ødegård, R. S., Etzelmüller, B., Hilbich, C., Hauck, C., Farbrot, H., Eiken, T., Hygen, H. O., and Hipp, T. F.: Degrading Mountain Permafrost in Southern Norway: Spatial and Temporal Variability of Mean Ground Temperatures, 1999–2009, Permafrost Periglac., 22, 361–377, https://doi.org/10.1002/ppp.728, 2011.
Kellerer-Pirklbauer, A.: Potential weathering by freeze-thaw action in alpine rocks in the European Alps during a nine year monitoring period, Geomorphology, 296, 113–131, https://doi.org/10.1016/j.geomorph.2017.08.020, 2017.
King, L.: High mountain permafrost in Scandinavia, 4th International Conference on Permafrost, Proceedings, National Academy Press, Washington, DC, USA, 612–617, 1983.
King, L.: Zonation and ecology of high mountain permafrost in Scandinavia, Geogr. Ann. A, 68, 131–139, 1986.
Kleman, J. and Hättestrand, C.: Frozen-bed Fennoscandian and Laurentide ice sheets during the Last Glacial Maximum, Nature, 402, 63–66, 1999.
Kleman, J., Stroeven, A. P., and Lundqvist, J.: Patterns of Quaternary ice sheet erosion and deposition in Fennoscandia and a theoretical framework for explanation, Geomorphology, 97, 73–90, 2008.
Korup, O.: Linking landslides, hillslope erosion, and landscape evolution, Earth Surf. Proc. Land., 34, 1315–1317, https://doi.org/10.1002/esp.1830, 2009.
Krautblatter, M., Funk, D., and Günzel, F. K.: Why permafrost rocks become unstable: a rock–ice-mechanical model in time and space, Earth Surf. Proc. Land., 38, 876–887, https://doi.org/10.1002/esp.3374, 2013.
Lussana, C., Tveito, O. E., and Uboldi, F.: Three-dimensional spatial interpolation of 2 m temperature over Norway, Q. J. Roy. Meteor. Soc., 144, 344–364, https://doi.org/10.1002/qj.3208, 2017.
Magnin, F., Deline, P., Ravanel, L., Noetzli, J., and Pogliotti, P.: Thermal characteristics of permafrost in the steep alpine rock walls of the Aiguille du Midi (Mont Blanc Massif, 3842 m a.s.l), The Cryosphere, 9, 109–121, https://doi.org/10.5194/tc-9-109-2015, 2015a.
Magnin, F., Brenning, A., Bodin, X., Deline, P., and Ravanel, L.: Modélisation statistique de la distribution du permafrost de paroi?: application au massif du Mont Blanc, Géomorphologie: relief, processus, environnement, 21, 145–162, https://doi.org/10.4000/geomorphologie.10965, 2015b.
Magnin, F., Westermann, S., Pogliotti, P., Ravanel, L., Deline, P., and Malet, E.: Snow control on active layer thickness in steep alpine rock walls (Aiguille du Midi, 3842 m a.s.l., Mont Blanc massif), Catena, 149, 648–662, 2017a.
Magnin, F., Josnin, J.-Y., Ravanel, L., Pergaud, J., Pohl, B., and Deline, P.: Modelling rock wall permafrost degradation in the Mont Blanc massif from the LIA to the end of the 21st century, The Cryosphere, 11, 1813–1834, https://doi.org/10.5194/tc-11-1813-2017, 2017b.
Mamot, P., Weber, S., Schröder, T., and Krautblatter, M.: A temperature- and stress-controlled failure criterion for ice-filled permafrost rock joints, The Cryosphere, 12, 3333–3353, https://doi.org/10.5194/tc-12-3333-2018, 2018.
McColl, S. T.: Paraglacial rock-slope stability,- Geomorphology, 153-154, 1–16, 2012.
Myhra, K. S., Westermann, S., and Etzelmüller, B.: Modelled Distribution and Temporal Evolution of Permafrost in Steep Rock Walls Along a Latitudinal Transect in Norway by CryoGrid 2D, Permafrost Periglac., 28, 172–182, https://doi.org/10.1002/ppp.1884, 2017.
Noetzli, J. and Gruber, S.: Transient thermal effects in Alpine permafrost, The Cryosphere, 3, 85–99, https://doi.org/10.5194/tc-3-85-2009, 2009.
Noetzli, J., Gruber, S., Kohl, T., Salzmann, N., and Haeberli, W.: Three-dimensional distribution and evolution of permafrost temperatures in idealized high-mountain topography, J. Geophys. Res.-Earth, 112, F02S13, https://doi.org/10.1029/2006JF000545, 2007.
Ødegård, R. S., Sollid, J. L., and Liestøl, O.: Ground temperature measurements in mountain permafrost, Jotunheimen, southern Norway, Permafrost Periglac., 3, 231–234, https://doi.org/10.1002/ppp.3430030310, 1992.
Oppikofer, T., Nordahl, B., Bunkholt, H., Nicolaisen, M., Jarna, A., Iversen, S., Hermanns, R. L., Böhme, M., and Yugsi Molina, F. X.: Database and online map service on unstable rock slopes in Norway – From data perpetuation to public information, Geomorphology, 249, 69–81, https://doi.org/10.1016/j.geomorph.2015.08.005, 2015.
Ravanel, L., Magnin, F., and Deline, P.: Impacts of the 2003 and 2015 summer heatwaves on permafrost-affected rock-walls in the Mont Blanc massif, Sci. Total Environ., 609, 132–143, https://doi.org/10.1016/j.scitotenv.2017.07.055, 2017.
R Core Team: R: A language and environment for statistical computing. R Foundation for Statistical Computing, Vienna, Austria, 2013.
Romstad, B., Harbitz, C. B., and Domaas, U.: A GIS method for assessment of rock slide tsunami hazard in all Norwegian lakes and reservoirs, Nat. Hazards Earth Syst. Sci., 9, 353–364, https://doi.org/10.5194/nhess-9-353-2009, 2009.
Sattler, K., Anderson, B., Mackintosh, A., Norton, K., and de Róiste, M.: Estimating Permafrost Distribution in the Maritime Southern Alps, New Zealand, Based on Climatic Conditions at Rock Glacier Sites, Front. Earth Sci., 4, 4, https://doi.org/10.3389/feart.2016.00004, 2016.
Savi, S., Delunel, R., and Schlunegger, F.: Efficiency of frost-cracking processes through space and time: An example from the eastern Italian Alps, Geomorphology, 232, 248–260, https://doi.org/10.1016/j.geomorph.2015.01.009, 2015.
Sellier, D.: Le felsenmeer du Mont Gausta (Telemark, Norvège): environnement, caractères morphologiques et significations paléogéographiques, Géogr. Phys. Quatern., 49, 185–205, https://doi.org/10.7202/033036ar, 1995.
Sollid, J., Isaksen, K., Eiken, T., and Ødegård, R.: The transition zone of mountain permafrost on Dovrefjell, southern Norway, in: Proceedings, vol. 2, Eigth International COnference on Permafrost, 21–25 July 2003, Zurich, Switzerland, edited by: Phillips, M., Springmann, S. M., and Arenson, L. U., Swets & Zeitlinger, Lisse, the Netherlands, ISBN 9058095827, 1085–1090, 2003.
Sosio, R., Crosta, G. B., and Hungr, O.: Complete dynamic modeling calibration for the Thurwieser rock avalanche (Italian Central Alps), Eng. Geol., 100, 11–26, https://doi.org/10.1016/j.enggeo.2008.02.012, 2008.
Steiger, C., Etzelmüller, B., Westermann, S., and Myhra, K. S.: Modelling the permafrost distribution in steep rock walls, Norw. J. Geol., 4, 329–342, https://doi.org/10.17850/njg96-4-04, 2016.
Westermann, S., Schuler, T. V., Gisnås, K., and Etzelmüller, B.: Transient thermal modeling of permafrost conditions in Southern Norway, The Cryosphere, 7, 719–739, https://doi.org/10.5194/tc-7-719-2013, 2013.