the Creative Commons Attribution 4.0 License.
the Creative Commons Attribution 4.0 License.
 | 25 Jan 2019
Long-term erosion of the Nepal Himalayas by bedrock landsliding: the role of monsoons, earthquakes and giant landslides
Robert Behling
Christoff Andermann
Jens M. Turowski
Luc Illien
Sigrid Roessner
Niels Hovius
In active mountain belts with steep terrain, bedrock landsliding is a major erosional agent. In the Himalayas, landsliding is driven by annual hydro-meteorological forcing due to the summer monsoon and by rarer, exceptional events, such as earthquakes. Independent methods yield erosion rate estimates that appear to increase with sampling time, suggesting that rare, high-magnitude erosion events dominate the erosional budget. Nevertheless, until now, neither the contribution of monsoon and earthquakes to landslide erosion nor the proportion of erosion due to rare, giant landslides have been quantified in the Himalayas. We address these challenges by combining and analysing earthquake- and monsoon-induced landslide inventories across different timescales. With time series of 5 m satellite images over four main valleys in central Nepal, we comprehensively mapped landslides caused by the monsoon from 2010 to 2018. We found no clear correlation between monsoon properties and landsliding and a similar mean landsliding rate for all valleys, except in 2015, where the valleys affected by the earthquake featured ∼5–8 times more landsliding than the pre-earthquake mean rate. The long-term size–frequency distribution of monsoon-induced landsliding (MIL) was derived from these inventories and from an inventory of landslides larger than ∼0.1 km2 that occurred between 1972 and 2014. Using a published landslide inventory for the Gorkha 2015 earthquake, we derive the size–frequency distribution for earthquake-induced landsliding (EQIL). These two distributions are dominated by infrequent, large and giant landslides but under-predict an estimated Holocene frequency of giant landslides (> 1 km3) which we derived from a literature compilation. This discrepancy can be resolved when modelling the effect of a full distribution of earthquakes of variable magnitude and when considering that a shallower earthquake may cause larger landslides. In this case, EQIL and MIL contribute about equally to a total long-term erosion of mm yr−1 in agreement with most thermo-chronological data. Independently of the specific total and relative erosion rates, the heavy-tailed size–frequency distribution from MIL and EQIL and the very large maximal landslide size in the Himalayas indicate that mean landslide erosion rates increase with sampling time, as has been observed for independent erosion estimates. Further, we find that the sampling timescale required to adequately capture the frequency of the largest landslides, which is necessary for deriving long-term mean erosion rates, is often much longer than the averaging time of cosmogenic 10Be methods. This observation presents a strong caveat when interpreting spatial or temporal variability in erosion rates from this method. Thus, in areas where a very large, rare landslide contributes heavily to long-term erosion (as the Himalayas), we recommend 10Be sample in catchments with source areas > 10 000 km2 to reduce the method mean bias to below ∼20 % of the long-term erosion.
- Article
(4207 KB) - Full-text XML
-
Supplement
(1044 KB) - BibTeX
- EndNote


In some locations erosion rates appear to increase with measurement time. A possible explanation is that rare, catastrophic erosion events dominate the long-term erosional budget (Kirchner et al., 2001). This explanation implies that a full understanding of sediment fluxes and landscape dynamics and their relations with tectonic and climatic forcing can only be realized with erosion estimates covering long timescales while any short-term measurements are not representative of these dynamics. To test and quantify this hypothesis, it is necessary to constrain both the erosion associated with continuous, unexceptional forcing and with extreme forcing events. In the Nepal Himalayas many studies have characterized erosion rates over different timescales. Short-term (1–10 years) average erosion rates based on fluvial sediment measurements in Nepal vary between 0.1 and 2 mm yr−1 for small (100–3000 km2) catchments (Gabet et al., 2008) but are typically as high as 1–2 mm yr−1 for principal catchments draining the mountain belt (Andermann et al., 2012; Struck et al., 2015; Morin et al., 2018). Catchment-wide mean erosion rates derived from 10Be concentrations in river sediment from across the Himalayas typically yield erosion rates of 0.5–2 mm yr−1 (Vance et al., 2003; Godard et al., 2012, 2014; Scherler et al., 2014; Portenga et al., 2015; Abrahami et al., 2016), averaged over ∼300–1200 years. Uncertainty remains substantial given that each study reports a number of outliers (< 0.1 or > 2 mm yr−1), possibly due to recent landsliding or incomplete mixing. On geological timescales (0–2 Myr), fission track data inverted with thermomechanical models indicate exhumation rates of 2–3 mm yr−1 in the High Himalayas of central Nepal (Wobus et al., 2005, 2006; Hermann et al., 2010; Thiede and Ehlers, 2013) and possibly up to 5 mm yr−1 (Burbank et al., 2003; Whipp et al., 2007). This ensemble entails an increase in erosion rates with increasing measurement timescales, as well as a high spatial variability in erosion rates at short and intermediate timescales. Although well established, the origin of these features is poorly understood and may be attributed to an inadequate average of extreme events over short timescales, even if climatic variations since the Pleistocene may also have modulated erosion.
In steep terrain, which is prevalent throughout the Himalayas, mass wasting is considered to be the dominant erosional processes on hillslopes and the main source of sediment to rivers (Burbank et al., 1996; Hovius et al., 1997, 2000; Gabet et al., 2004; Struck, et al., 2015; Morin et al., 2018). Most landslides are triggered by elevated pore pressure due to heavy rainfall or snowmelt (Van Asch et al., 1999; Iverson, 2000) or by ground shaking caused by shallow earthquakes (Keefer, 1984; Marc et al., 2016a; Tanyaş et al., 2017). Tracking pore pressure at the landslide scale is difficult, but studies of landslides or landslide populations triggered by rainfall have reported a non-linear, often power-law, increase in the landslide density or total area or volume with rainfall metrics such as intensity, duration and especially total rainfall (Burtin et al., 2013; Chen et al., 2013; Saito et al., 2014; Marc et al., 2018). For earthquakes, a linear scaling of landslide density with peak ground acceleration beyond a threshold acceleration is consistent with the spatial pattern and total area and volume of landslide populations caused by earthquakes (Meunier et al., 2007, 2013; Marc et al., 2016a, 2017). Temporal coincidence of these two independent forcings enhances landsliding, and it has been shown that landslide susceptibility to rainfall is elevated in the epicentral zone of large, shallow earthquakes, followed by a progressive decay to pre-seismic values (Marc et al., 2015). Thresholds and non-linear scaling reported in various studies imply that long-term erosion is influenced by the frequency–intensity distribution of the triggering events (seismic or meteorologic) associated with a given climatic and tectonic setting (e.g. Marc et al., 2016b). In turn, the landslide size distribution can be characterized by power-law behaviour beyond a cut-off size and is often heavy-tailed when converted to volume (see Hovius et al., 1997; Stark and Hovius, 2001; Malamud et al., 2004). This implies a disproportionate role of rare, large events in setting long-term erosion rates. The rollover and divergence from power-law behaviour has been interpreted as an effect of resolution censoring (Stark and Hovius, 2001) or as emerging for mechanical reasons (Stark and Guzzetti, 2009; Frattini and Crosta, 2013; Milledge et al., 2014).
Independently of the trigger, landslide occurrence may be due, to an extent, to an increased propensity to slope failure due to rock mass weakening and the development of discontinuities, for example, due to weathering, mineralization, or mechanical fatigue (see Lacroix and Amitrano, 2013; Riva et al., 2018). However, here we will not focus on these aspects, since systematically monitoring and quantifying these predisposing factors remains challenging. Instead, we aim to quantify the long-term landslide erosion caused by earthquake and monsoon occurrence and its dependence on rare and large landslides. It is generally accepted that in the Himalayas, widespread landsliding is driven by the annual summer monsoon (Monsoon-Induced Landsliding, MIL) (e.g. Gabet et al., 2004; Andermann et al., 2012; Struck et al., 2015), with its prolonged intense rainfall and by less frequent high-magnitude forcing events, such as earthquakes (Schwanghart et al., 2016; Stolle et al., 2017; Roback et al., 2018). However, until now the influence of monsoon properties on annual landsliding has remained poorly constrained, in part because comprehensive landslide mapping is limited (e.g. Dahal and Hasegawa, 2008). In contrast, the intense effort of landslide mapping throughout Nepal following the 2015 Gorkha earthquake allows for the first time an estimate of the contribution of earthquake-induced landsliding (EQIL) to long-term erosion in the Nepal Himalayas. The mapping of the landslides due to monsoon rainfall following the earthquake offers an opportunity to constrain the seismic perturbation of the landscape. Finally, to assess if rare, giant landslides (> km3) contribute significantly to erosion and can explain the discrepancy between short- and long-term erosion (Weidinger, 2011; Zech et al., 2009), it is necessary to constrain the size–frequency distribution of landslides associated with the different triggers. In the Himalayas, glaciers do not seem to contribute much to the erosion budget of the range (Morin et al., 2018), likely because in spite of having significant local effects on the erosion dynamics (e.g. Heimsath and McGlyyn, 2008), they have a very limited areal extent, even during ice ages. Thus, we consider that a quantitative understanding of role and behaviour of landsliding in the Himalayas can be obtained without investigating glacial and periglacial areas.
Here we use several multi-temporal landslide inventories from the High Himalayas of Nepal to constrain the erosion associated with recent monsoons and the Gorkha earthquake and its aftermath. With a 50-year record of large landslides and an estimate of earthquake recurrence time, we constrain the size–frequency distribution of both MIL and EQIL. We show that it is consistent with a ∼10 000-year record of dated giant landslide deposits, constraining the maximum landslide size and allowing the quantification of long-term landslide erosion due to tectonic and climatic forcing. We find that landslide erosion is dominated by the largest landslides and that, when integrated over the relevant size or frequency range, it matches independent erosion rate estimates obtained over various timescales (year, kyr, Myr). Hence, the size and recurrence time of the largest landslides in a mountain belt has important implications for the interpretation of erosion patterns derived from techniques averaging over short (e.g. fluvial sediment budget) to intermediate (e.g. 10Be) timescales.
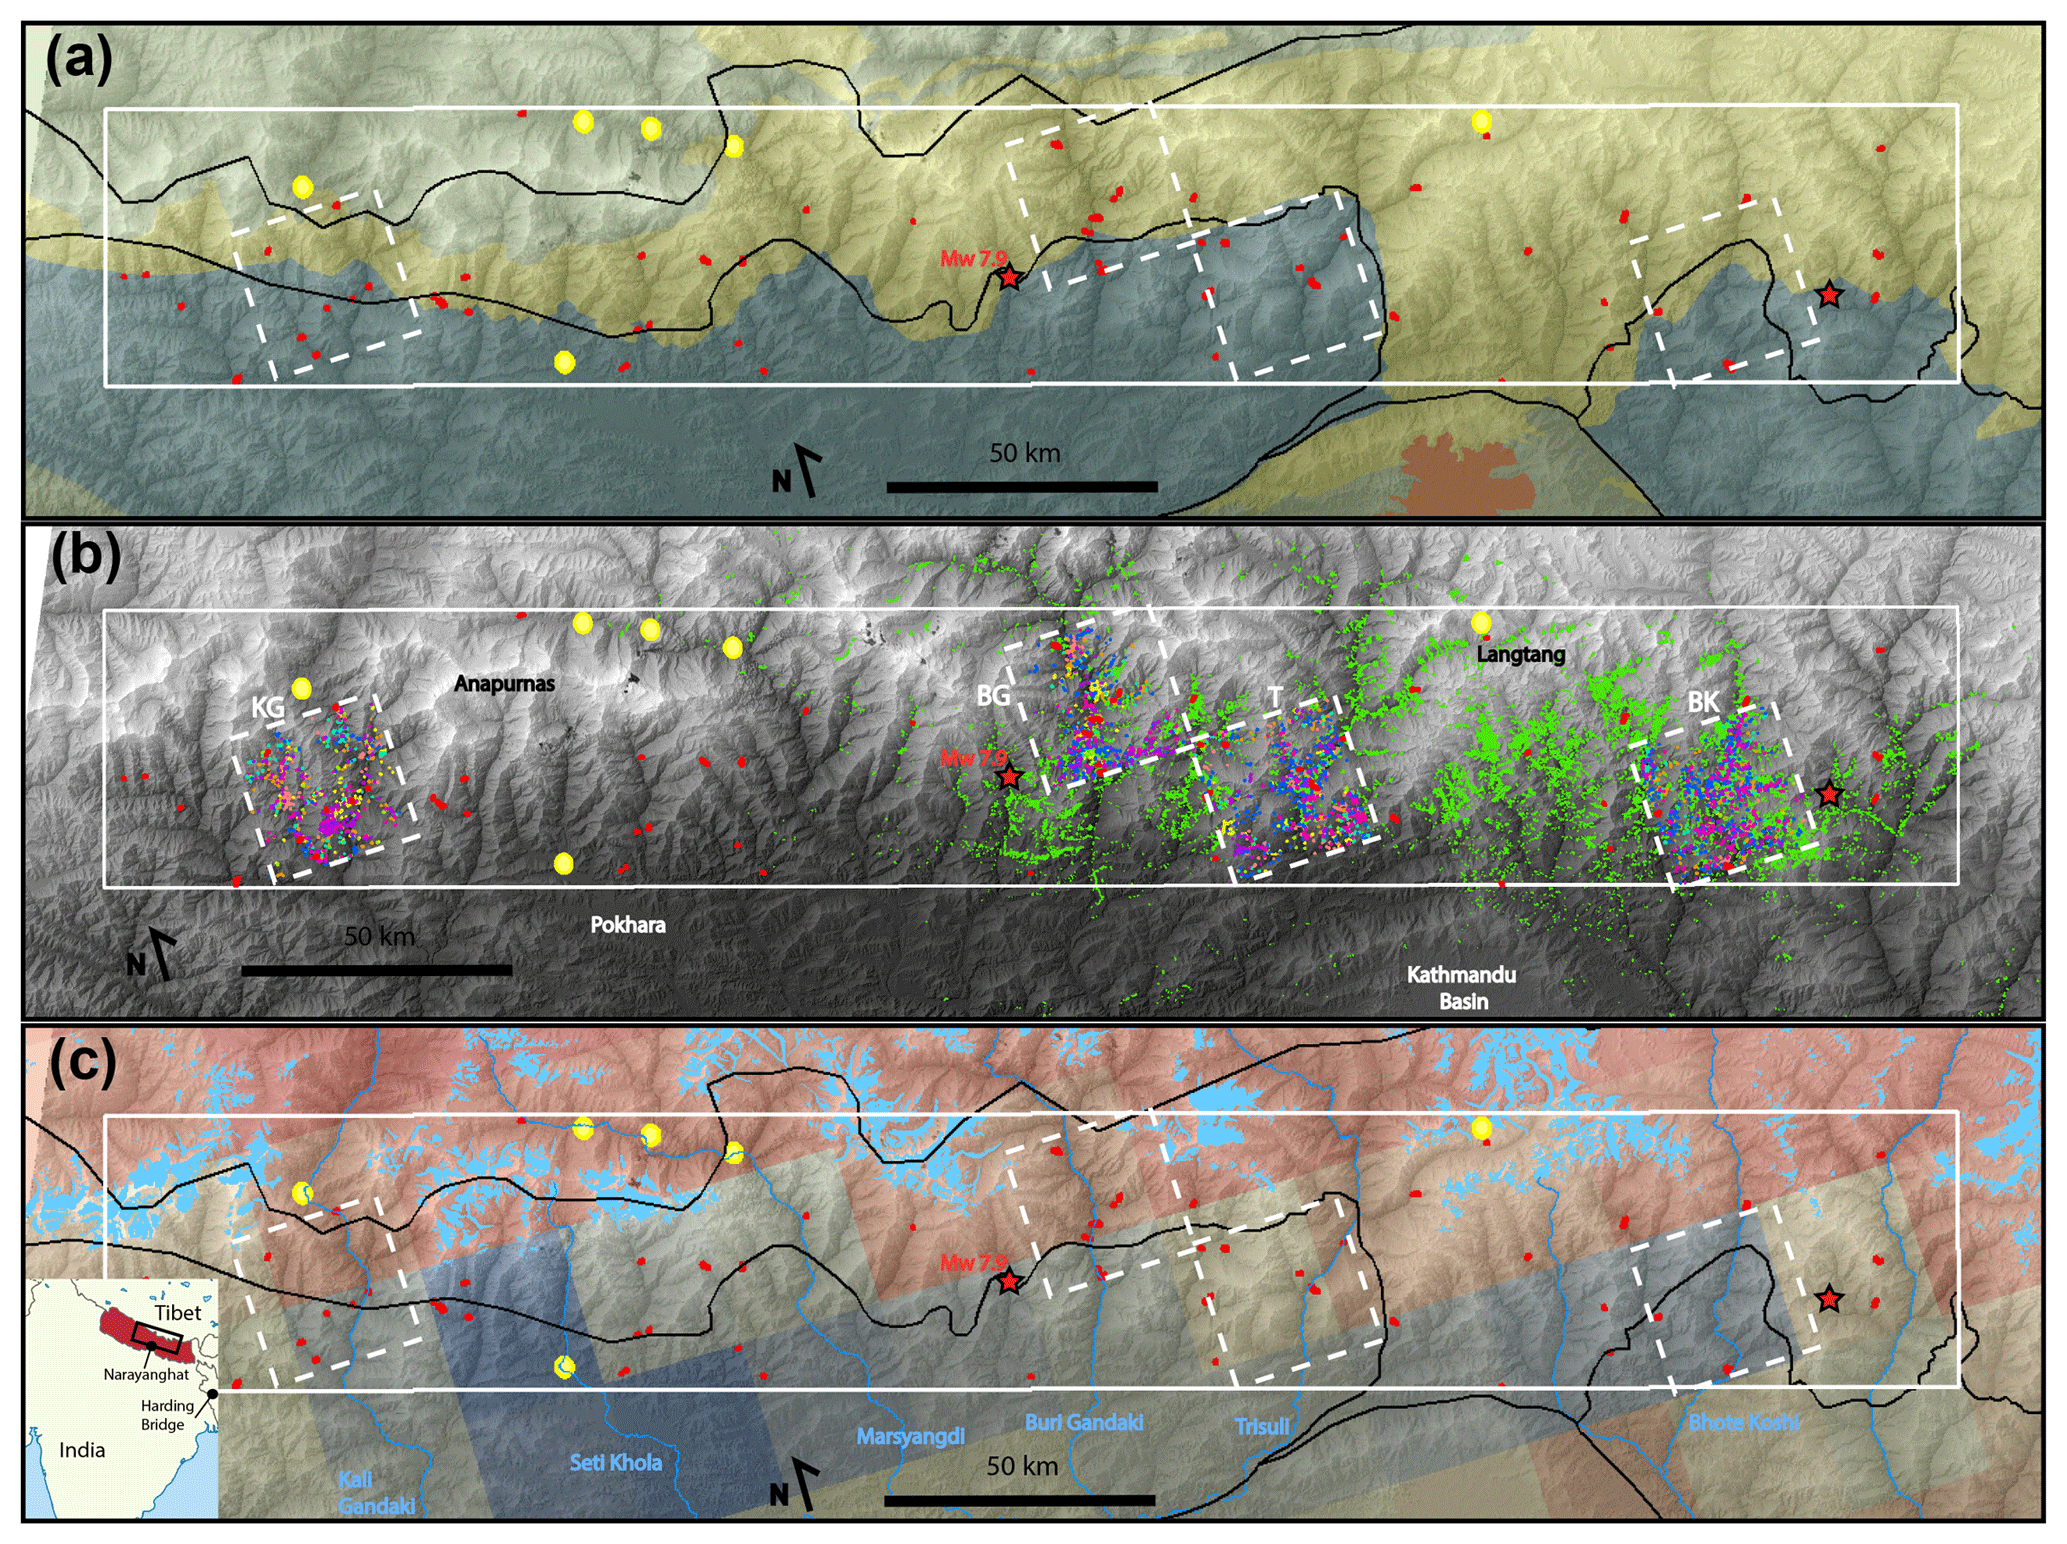
Figure 1Hill-shaded digital elevation model of central Nepal, with the main geological units (Thetyan sedimentary sequence in grey, High Himalayan sequence in yellow, Lesser Himalayas sequence in blue, Quaternary deposit in red) (a), the different landslide inventories used in this study (b), and the mean annual precipitation, main rivers (blue lines) as well as glacier extents (light blue polygons) (c), within a section of the High Himalayas (white box). In all panel we show the epicentre of the Gorkha earthquake (Mw 7.9) and of its largest aftershock (Mw 7.3) as red stars, the footprint of the RapidEye images used to map monsoon-induced landslides from 2010 to 2017 as white dashed boxes, large (> 0.8 km2) landslides mapped between 1972 and 2014 in red, and the known giant landslide deposit (> 1 km3) as yellow dots. In (b) we show earthquake-induced landslides reported by Roback et al. (2018) in green and monsoon-induced landslides of each year with a separate colour. In (a) and (c) the two main fault systems (South Tibetan Detachment, STD, in the north and Main Central Thrust, MCT, in the south) are shown with thick black lines. In (c) the annual rainfall was estimated from the 0.25∘ daily rainfall product APHRODITE derived from an extensive gauge network (Yatagai et al., 2012) and the glaciers are from the RGI consortium (2017).
2.1 Landslide inventories: satellite imagery, landslide mapping and dated deposit compilation
We mapped landslides triggered during eight monsoon seasons (2010–2017), and by the Gorkha earthquake (25 April 2015) and its largest aftershock (12 May 2015) using a series of 5 m resolution RapidEye (RE) images (Supplement Table S1, Fig. 1). We focus on four study areas, delimited by RE satellite image tiles (4552225, 4552106, 4552007 and 4551910), each ∼25 by 25 km and together representing 2300 km2 of mapped area as well as 210 km2 of (peri-) glacial terrain where the absence of vegetation did not allow mapping. Indeed, the change from a vegetation signature to a rock debris signature is very conspicuous in multispectral imagery, even for sparse vegetation, whereas textural or spectral changes in rocky/sedimentary surfaces remain challenging to detect and interpret. We chose the four tiles to cover the High Himalayan section with steep relief and focused erosion. One RE tile, covering a part of the Kali Gandaki catchments (KG), lies outside of the area affected by the 2015 Mw 7.8 Gorkha earthquake and is used as a benchmark for non-seismic erosion rates. The three other tiles, located over the Buri Gandaki (BG), Trisuli (T) and Bhote Koshi (BK) catchments cover representative sections of the rupture zone of the Gorkha earthquake. The BK area is also less than 20 km away from the epicentre of the Mw 7.3 aftershock of 12 May 2015 that was reported to have triggered additional failures in this area (Fig. 1). We used the map of coseismic landslides by Roback et al. (2018) and refined the mapping in the BK area, where available imagery allowed differentiation between failures due to the Gorkha earthquake and the large aftershock.
To obtain our landslide maps, we used, in a first step, a landslide mapping algorithm (Behling et al., 2014, 2016) applied to time series optical remote-sensing data. The approach comprises automated preprocessing routines (e.g. geometric co-registration and masking of clouds, water and snow) and multi-temporal change detection methods, resulting in potential landslide objects, which are assigned a probability of actually being a landslide. The change detection builds on the analysis of temporal NDVI (Normalized Difference Vegetation Index) trajectories, representing footprints of vegetation cover changes over time. The limited amount of imagery did not allow for accounting for and removing seasonal variations in the NDVI signatures, but most of the scenes are in the post-monsoon season when vegetation cover is highest, limiting such variations (Table S1). Landslide-specific trajectories are characterized by the short-term destruction of vegetation cover and longer-term revegetation resulting from landslide-related disturbance and dislocation of fertile soil cover. In combination with the slope gradient and parallelism to rivers, which enhance the exclusion of anthropogenic (building, field clearings) and flood-related disturbance, respectively, this approach enables the automated identification of landslides of different sizes and shapes and at different stages of development (e.g. fresh occurrences and reactivation of existing landslides) under varying natural conditions.
The output of the algorithm was visually inspected, and necessary corrections were applied manually. A specific concern was the adequate splitting and redating of multiple adjacent landslides bundled into single polygons by the algorithm. In our case, the splitting of amalgamated polygons is not only important for correct volume estimates (Marc and Hovius, 2015) but also for the attribution of each polygon to the appropriate triggering period. Manual splitting, or remapping when needed, were based on inspection and comparison of the multispectral imagery and on the topographic context. Another important step was the removal of erroneously detected landslides, for example, debris and clearings related to road construction or to fields near villages. Then, polygons related to debris flows and/or significant fluvial channel disturbance were reduced to their source and run-out areas upslope of channels with permanent discharge, as visible in the RE imagery. Thus, the mapping of debris flow areas and their erosional impact is limited to hillslopes and excludes areas of alluviation or flooding mostly affected by depositional processes. Nevertheless, the volume of such debris flows is difficult to estimate based on our mapping information (see Sect. 2.2). Lastly, in the Trisuli RE tile, we noticed through visual inspection at least four large (0.1 to 0.4 km2) hillslope segments that had downslope displacements of several metres in some years but seemed immobile in others. We do not include these mobile hillslope segments in our analysis as they did not yet fail practically, but they may contribute to the sediment export from this catchment in the future. Potential links between annual movements and the monsoon rainfall are unclear and further investigation would require proper quantification of the block movement history, which is beyond the scope of this work.
The selected areas and time periods covered by RE imagery may not be large enough to robustly constrain the mean frequency of very large and rare landslides. To obtain a regional handle on the occurrence of such landslides, we compared a series of cloud-free Landsat images (Table S2), covering an area of 11 750 km2 in central Nepal (after excluding ∼3700 km2 of (peri-) glacial areas where reliable mapping was not possible). The four RE tiles are located within this larger High Himalayan region, which stretches ∼315 km long and ∼48 km wide from Dhaulagiri to the Bhote Koshi valley (Fig. 1). This area encompasses several lithological units, a climatic gradient (with enhanced precipitation south of the high peaks and a rain shadow behind), localized glaciated areas and a likely uplift gradient (Fig. S1 or 1). However, the overall result of these heterogeneities on landsliding is unclear, and we start by assuming subparts of our study area (e.g. RE tiles, region of coseismic landsliding) have a similar behaviour and can be compared applying only an areal normalization, and we will discuss the validity and caveats of this assumption at the end. Within the larger region, we mapped all new landslides larger than ∼0.08 km2 between 1972 and 2014 (Fig. 1). A direct comparison of the newest and oldest images (2014 and 70–80s) did not allow the detection of all failures because of partial revegetation, occasional shadows or successive phases of failure at the same site. Therefore, we combined imagery obtained approximately every decade from 1972 to 2014 to have a full coverage of the area of interest with a very low proportion (< 5 %) of areas obscured by cloud or topographic shadows (Table S2). We note that, with the exception of the 12 landslides mapped on the last images and two obscured in the first images taken after their occurrence, we could constrain revegetation rates (i.e. the time required for vegetation to recolonize most of the scarp and make it indistinguishable from the surroundings in the available imagery) for the 35 remaining large landslides in our dataset. Only 10 of these were not distinguishable on the second image after their occurrence, meaning that they had fully revegetated in less than about 12 years. The other 25 (70 %) had revegetation times longer than 11 years and longer than 20 years in 11 cases. It is thus unlikely that a substantial number of large landslides could have remained undetected because they occurred and revegetated between two mapping frames. Therefore, we consider that the inventory is representative of the mean frequency of large landslides over the 4 last decades.
Table 1Summary of the age volume and location of the giant deposits considered in our study area. All of them are considered single failures, except for the Sabche deposits that may have been deposited through three main events. See text for more details.
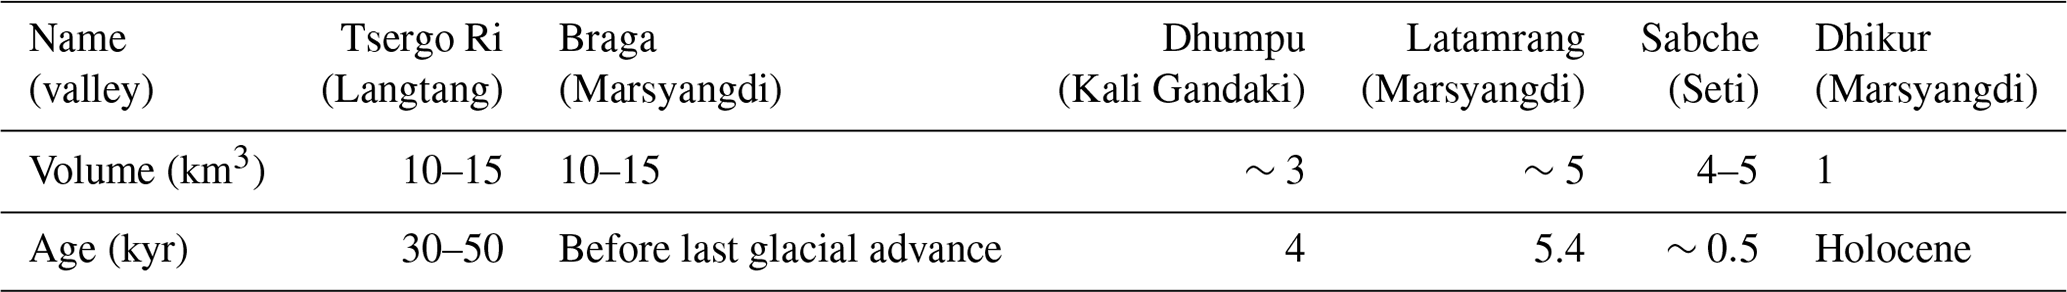
The last dataset we use is a literature compilation of giant landslides deposits, with volumes typically > 1 km3, that can be used to constrain the age and size of the largest landslide events in the Himalayas (Fig. 1). The Tsergo Ri (Langtang) and Braga (Manang) landslides are the largest reported events, with estimated volumes of 10–15 km3 (Weidinger et al., 2002; Weidinger, 2006; Fort, 2011). However, these two landslides have been significantly eroded during the last glacial period, and it is unclear if the imprint of other landslides has been reliably preserved. Nevertheless, they are good examples of single giant landslides – one a peak collapse (Tsergo Ri) and the other the collapse of the northern flank of the Annapurna (Braga) – and they can be used to constrain the likely maximum landslide size and a minimum probability of occurrence since the last glacial. A more complete picture exists for absolute or relative dating of very large landslide deposits of Holocene age, along the portion of the range covered by our Landsat inventory. We found reference to deposits of three giant landslides around the Annapurna range dated to within the last ∼5000 years: the Dhumpu (Upper Kali Gandaki) (∼3 km3), Latamrang (Marsyangdi) (∼5 km3) and Sabche (Pokhara) (∼4–5 km3) landslides, respectively (Fort, 2011; Zech et al., 2009; Pratt-Sitaula et al., 2004; Shwanghart et al., 2016). To these we add the Dhikur (Marsyangdi) landslide (∼1 km3), which is considered post-glacial in the absence of an absolute date (Weidinger, 2006; Fort, 2011). The six deposits mentioned above represent a complete list of giant landslides (> 1 km3) present in our area and discussed in the literature (Table 1), and in a twice longer swath (from Dolpo to Sikkim), only three other deposits > 1 km3 are known and attributed to giant landslides: the Ringmo, Khumjung and Dzongri deposits, which are all considered to be interglacial (Fort, 2011; Weidinger and Korup, 2009). Other massive terrace deposits in valleys in the High Himalayas result from catastrophic sedimentary events (e.g. Cenderelli and Wohl, 1998; Pratt-Sitaula et al., 2007; Lave et al., 2017), but their conditions of formations are diverse (glacial lake outburst floods, multiple debris flow, giant landslide evacuation) and relating them to individual landslides challenging. Importantly, to accurately estimate the frequency of a given landslide size, deposits should be attributable to single landslides and not result from cumulative deposition. Geomorphological and petrographic evidence suggests single failures for all events in our catalogue (Weidinger et al., 2002; Weidinger, 2006; Fort, 2011), except for the Sabche landslide, where dating and morphology of the sediment suggest three major deposition events over 300 years (Schwanghart et al., 2016). This case could be a major, single landslide with prolonged debris flow transport or correspond to three sub-events with an average volume of ∼1.5 km3. Based on our literature survey, we consider that at least four giant landslides (1–5 km3) occurred in our study region during the Holocene, although the deposits may originate from up to six giant failures. The actual upper limit of giant landslide frequency is hard to constrain, given that in spite of their size and impact on the landscape, their deposits are not always recognizable from remotely sensed imagery (Weidinger and Korup, 2009), and remote valleys that are less well investigated may still hold some undiscovered deposits.
2.2 Volume estimation and run-out correction
Landslide plan view area, A, and perimeter, P, were directly obtained from each mapped polygon. These values represent the total area disturbed by a landslide, including the scar, run-out and deposit areas, because a systematic delineation of the scar was not possible from most of the available imagery. Hence, estimates of landslide volume, which are based on area, may be excessive slides with long run-out. We applied a correction for run-out proposed by Marc et al. (2018), allowing the estimation of the landslide width, scar area and volume. First, assuming that each landslide has an elliptical shape, its mean width, W, is computed based on P and A. With 418 landslide polygons, mapped from medium- (10 to 30 m) and high-resolution (1 m) imagery, Marc et al. (2018) found that 72 % and 96 % of the widths estimated with this method were within 30 % to 50 %, respectively, of the actual (measured) scar width. The bias was randomly distributed across a wide range of area (102–105 m2), aspect ratio (2–30) and environment (with landslides from Japan, Colombia, Brazil and Taiwan). Second, the scar area is estimated as As =1.5 W2, using the mean length / width ratio of a worldwide database composed of 277 landslide scars with volumes ranging from 1000 m3 to 1 km3 (Domej et al., 2017). We note that the distribution of estimated landslide scar sizes, based on our geometric correction of the landslides triggered by the Gorkha earthquake, is similar to the one derived from scar outlines independently mapped from satellite imagery (Roback et al., 2018, Fig. S1). However, our estimates of scar area are about 50 %–100 % larger than those of Roback et al. (2018), as their mapping was conservatively limited to the very upper part of the landslides, with a length / width ratio often less than 1. Finally, we converted landslide scar area, As, into volume, V, with the relation , with parameters for shallow landslide scars (; log10) and bedrock landslide scars (; log10) for As < 104 m2 and As > =104 m2 , respectively (Larsen et al., 2010). For reference, we also computed landslide volume with the whole landslide area and using whole landslide parameters (; log10) for landslides with A < 105 m2 and bedrock landslide parameters (; log10) for larger landslides (Larsen et al., 2010). In this study, all analyses of landslide area and volume are performed after the run-out correction, while results without this correction are presented in the Supplement (Figs. S2, S3).
Uncertainties in this approach include the 1σ variability in the coefficient and exponent of the landslide area–volume relations given above and an assumed standard deviation of 20 % of the mapped landslide area (Marc et al., 2016a, 2018). These uncertainties were propagated into the volume estimates assuming a Gaussian distribution of errors. The standard deviation of the total landslide volume, for entire catalogues or for local subsets, was calculated assuming that the volume of each individual landslide is unrelated to that of any other in the dataset, thus ignoring possible covariance. Although an estimated 2σ for single landslides is typically from 60 % to 100 % of the individual volume, the 2σ uncertainty for the total volume of inventories with 100–1000 landslides is typically below 10 %–20 % (Marc et al., 2016a, 2018).
2.3 Spatio-temporal frequency of landsliding for the estimation of long-term erosion rates
Long-term erosion rates can be derived by integrating the spatio-temporal frequency (yr−1 km−2) of landslides from the smallest to the maximum landslide size (Hovius et al., 1997). To estimate landslide size–frequency distributions, we computed a histogram of landslide area (whole or scar), using log-spaced bins and then normalized by the mapped area, Amap (see Sect. 2.1), and the timespan during which landslides occurred, Tmap. We computed the size–frequency distribution for four inventories: the landslides induced by the Gorkha earthquake as mapped by Roback et al. (2018), the 2010–2017 monsoons mapped from RE imagery, the 1972–2014 monsoons mapped from Landsat imagery and the compilation of giant (> 1 km3) landslide deposits in central Nepal.
Here, we review Amap and the considerations leading to the values of Tmap for each of the inventories. For the earthquake inventory we use Amap=7000 km2, that is the area of intense landsliding across the high Himalayas, ignoring sparse landsliding in the lesser Himalayas and the Siwaliks (Martha et al., 2016; Roback et al., 2018). For an earthquake trigger, Tmap must represent an average earthquake recurrence time. Studies of paleo-ruptures in central Nepal, constrained by historical damage or dated fault scarps, have revealed complex earthquake intervals (Mugnier et al., 2013; Bollinger et al., 2014, 2016). Specifically, data from historical reconstructions, accounting for blind ruptures, suggest that at least six large earthquakes affected central Nepal in the last ∼1000 years, possibly eight if we consider ruptures from eastern and western Nepal that may have propagated to central Nepal (Mugnier et al., 2013; Bollinger et al., 2016). However, these ruptures have poorly constrained magnitudes, varying from Mw∼7.5 to 8.5, and have uncertain return times (Mugnier et al., 2013). Dated deformation of river terraces in the last 4500 years indicates relatively regular surface rupturing of the Main Frontal Thrust (MFT) by great earthquakes every 650–850 years (Bollinger et al., 2014). If they were similar to the Bihar rupture, the most recent event on the MFT, then the corresponding earthquakes would have had Mw∼8.1–8.4 (Bollinger et al., 2014). Hence, we consider a ∼750-year return time of great surface rupturing earthquakes of Mw∼8.3 and use a Gutenberg–Richter law with a b value of 1, consistent with instrumental and historical data in Nepal (Avouac, 2015), to estimate a return time of ∼300 years for a Mw 7.9 event. The additional contributions to mass wasting by more frequent earthquakes with an intermediate magnitude (i.e. Mw∼7) as well as infrequent giant earthquakes (Mw 8.5) are likely to be important but cannot be constrained from currently available landslide inventories, and we will discuss a correction based on modelling results.
For the RE inventory, Amap=2300 km2. The landslide area histogram must be normalized by the number of monsoon years (= 8) covered by the imagery. However, if some years are significantly affected by the occurrence of the Gorkha earthquake, then they may not be representative of the monsoon forcing and should be excluded, reducing Tmap for this dataset. Below (see Sect. 3.1.3), we constrain the duration of the influence of this earthquake on rainfall-induced landslide rates.
For the Landsat inventory, we mapped an area Amap=11 750 km2 along the range, using imagery spanning from 1972 to 2014. However, we use Tmap=46 years, to include the 1968 Labubesi landslide (Weidinger, 2011), which is clearly visible in the 1972 imagery. It is the second-largest failure of this inventory (0.6 km2). In doing so, there is a possibility that we slightly underestimate the frequency of smaller landslides in this catalogue, but we probably obtain a better average of the larger ones by considering this additional failure and the slightly longer time span.
The compilation of Holocene giant landslide deposits is considered representative of the whole area of interest with Amap=11 750 km2 and Tmap=10 000 years, yielding a range of frequency of ∼3 to 6.10−8 yr−1 km−2. Assuming a typical volume of ∼3 km3, the scar areas of these giant landslides can be back-estimated based on A–V relationships (see Sect. 2.2) to a range of 11 to 26 km2.
To estimate the long-term erosion due to landsliding in the Nepal Himalayas, we convert mapped landslide area to volume (see Sect. 2.2) and numerically integrate the size–frequency relations for landslide scars with surface areas until the maximum scar size, back-estimated as 40 km2 from the largest deposit in the area (10–15 km3 in Langtang; Weidinger et al., 2002).
3.1 Landslide inventories and erosion across timescales
3.1.1 Seismically triggered landslides
In the RE tile over BK, we mapped 953 landslides attributed to the Gorkha earthquake and a further 167 due to the large Mw 7.3 aftershock on 12 May 2015. With the run-out correction proposed in Sect. 2.2, we estimate a total scar area of 1.25 and 0.14 km2 (i.e. a density of 2000 and 230 m2 km−2) and a total volume of 3.1 and 0.22 Mm3 (i.e. 5 and 0.35 mm of erosion), respectively. In KG, we detected only five new landslides in May 2015, which could have been triggered by the earthquake or by pre-monsoon rainfall in April of that year. This is consistent with other studies that do not report coseismic landsliding in this area (Martha et al., 2016; Roback et al., 2018). In the BG and T areas, about 2400 and 1600 coseismic landslides were reported by Roback et al. (2018), consistent with the new failures visible in the RE imagery, although some landslide outline polygons appear distorted, likely due to orthorectification issues of the imagery they used. After run-out correction, we estimate a total scar area of 2.0 and 2.1 km2 (i.e. a density of 4200 and 3300 m2 km−2) and a total volume of 8.3 and 11 Mm3 (i.e. 17 and 18 mm of erosion) in the BG and T areas, respectively. Next, we examine how landsliding due to instantaneous seismic forcing compares with the steady landslide flux due to annual monsoons.
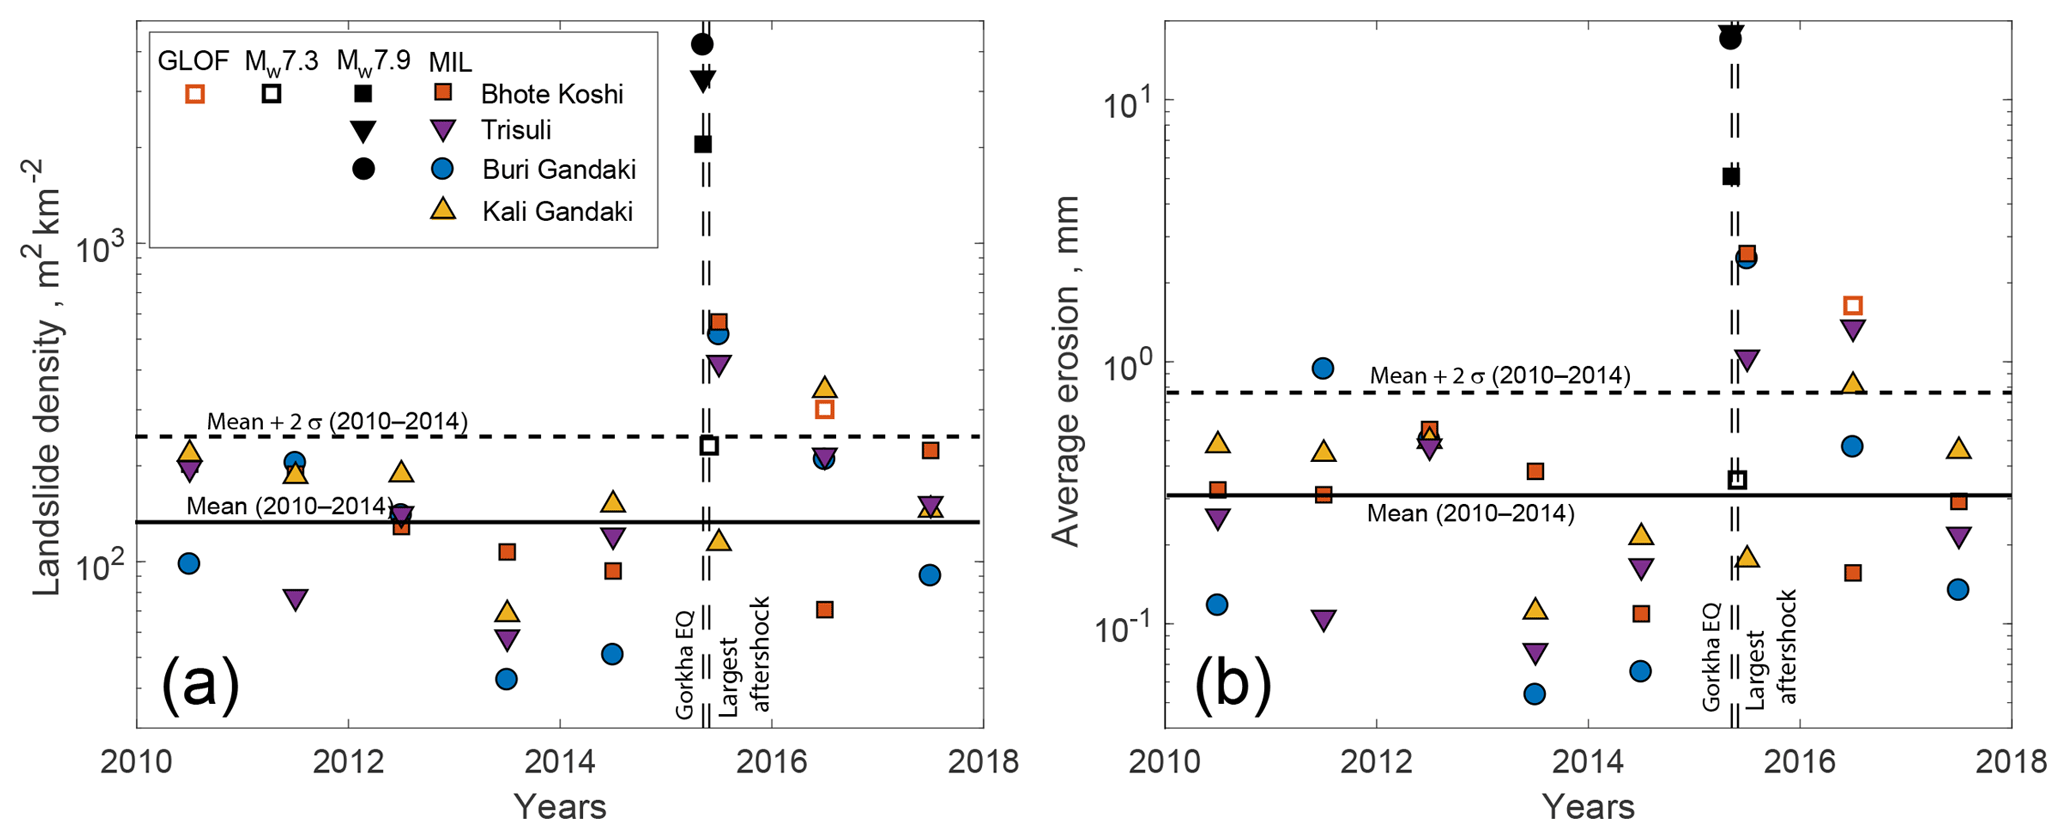
Figure 2Landslide density (a) and average erosion (b) associated with the 2010–2017 monsoons in RapidEye mapping areas BG, BK, T and KG. Large landslides in KG (2013 and 2015) and BK (2014) have been removed (see text for details). Solid black squares represent the coseismic landsliding due to the Gorkha earthquake (EQ) in BK, BG and T, while open black squares represent the landslides induced by the 12 May 2015 aftershock in the BK valley. Open orange squares indicate the 2016 BK landsliding including bank collapses that are mostly due to a glacier lake outburst flood (GLOF) in that year (Cook et al., 2018). The solid and dashed black lines in (a) and (b) are the mean values of all catchments and the mean +2σ from 2010 to 2014. Volume conversion leads to 1σ uncertainties between 5 % and 30 % of the total average erosion volume, which is relatively small compared to the data scatter.
3.1.2 Monsoon-driven landsliding
In the four areas covered by our RE imagery, from west to east KG, BG, T and BK, we mapped a total of 4937 landslides, with a cumulative area of 14.6 km2 in the eight monsoon seasons between 2010 and 2017.
The 2015 Gorkha earthquake may have changed the propensity for rainfall-induced slope failure in subsequent years, as observed in other epicentral areas (see Marc et al., 2015). Therefore, we limit our initial analysis of monsoon-driven landsliding to the 5 years preceding the earthquake. In this time window, the total area of landslide scars activated by each monsoon, normalized by mapping area, is very similar in the four catchments, ranging from ∼50 to 200 m2 km−2 with a mean of 133±57 (± 1σ unless specified) m2 km−2 for the four mapping tiles combined (Fig. 2). Landslide volume density and erosion are more scattered, ranging from 100 to 1000 m3 km−2 (i.e. 0.1–1.0 mm erosion), with a mean of 310±230 m3 km−2. For these years, variations in landslide rate appear uncorrelated between catchments, except for 2012 and 2013, which had rather above and below average landslide rates for most areas, respectively. Notably, we do not find any correlation between measures of monsoon strength derived from satellite measurements (i.e. GSMaP rainfall estimates; see Kubota et al., 2006; Ushio et al., 2009) in each catchment (six measures were taken into account, i.e. total rainfall during different periods: between May and October(1), June and October (2), during days above an intensity threshold in these periods (3, 4) and during the wettest sequence of 20 or 40 days (5, 6)) and landslide rates (Fig. S4). Nevertheless, at the rates observed in the four mapping areas during the period 2010–2014, 10–20 years of monsoon-induced landsliding would suffice to match the landsliding caused by the 2015 Gorkha earthquake in the BK, while the 12 May aftershock caused an amount of landsliding in the BK equivalent to one or two monsoon seasons (Fig. 2). In BG and T, the earthquake-induced landsliding is equivalent to ∼40 to 60 years of the mean landslide rates caused by the 2010–2014 monsoons.
Importantly, the stable average landslide rate, across catchments and through time, was obtained by excluding the single largest landslides in 2013 and 2015 in KG and in 2014 in BK (Jure landslide). These landslides are difficult to attribute to any given monsoon season because they appear to have been caused by progressive destabilization. For the 2013 and 2014 landslides, small-scale landsliding occurred around the scarps in preceding years, while the 2015 landslide was reported to have developed significant cracks at its crest during the earthquake that year. Further, these landslides depart significantly from the probability density distribution defined by the RE inventory (Sect. 3.1.4) and we further discuss their origin in Sect. 4.1.
Two of the large landslides mentioned above are also identified in our multi-decadal mapping from Landsat images. The 2014 BK (Jure) and 2013 KG landslides feature amongst 49 landslides ranging from 0.08 km2 to about 0.8 km2. After run-out correction, their scar areas are between 0.02 km2 and 0.4 km2. They are relatively uniformly distributed across the whole area of interest (Fig. 1). Despite the low resolution of the Landsat imagery, we could identify in the appropriate time intervals several large failures described in the literature such as the reactivation of the Satuiti landslide before the 1990 and between 2002 and 2011 (Gallo et al., 2014) and the Labubesi (BG, 1968), Dharbang (1988) and Tatopani (KG, 1998) landslides, which each caused notable river damming (Weidinger, 2011). The Satuiti landslide oscillates between slow and rapid downslope movement with widespread collapses during periods of acceleration (Gallo et al., 2014). The river blocking landslides mentioned above are also considered to be at least in part related to specific geomechanical conditions, with important roles for rock mass fabric, stress release and erosion (Weidinger, 2011). The 2014 Jure landslide in BK is the largest single failure to have occurred in our observation window since 1970, clearly demonstrating that its probability of occurrence would be greatly overestimated based on its inclusion in the 8-year record from our RE mapping.
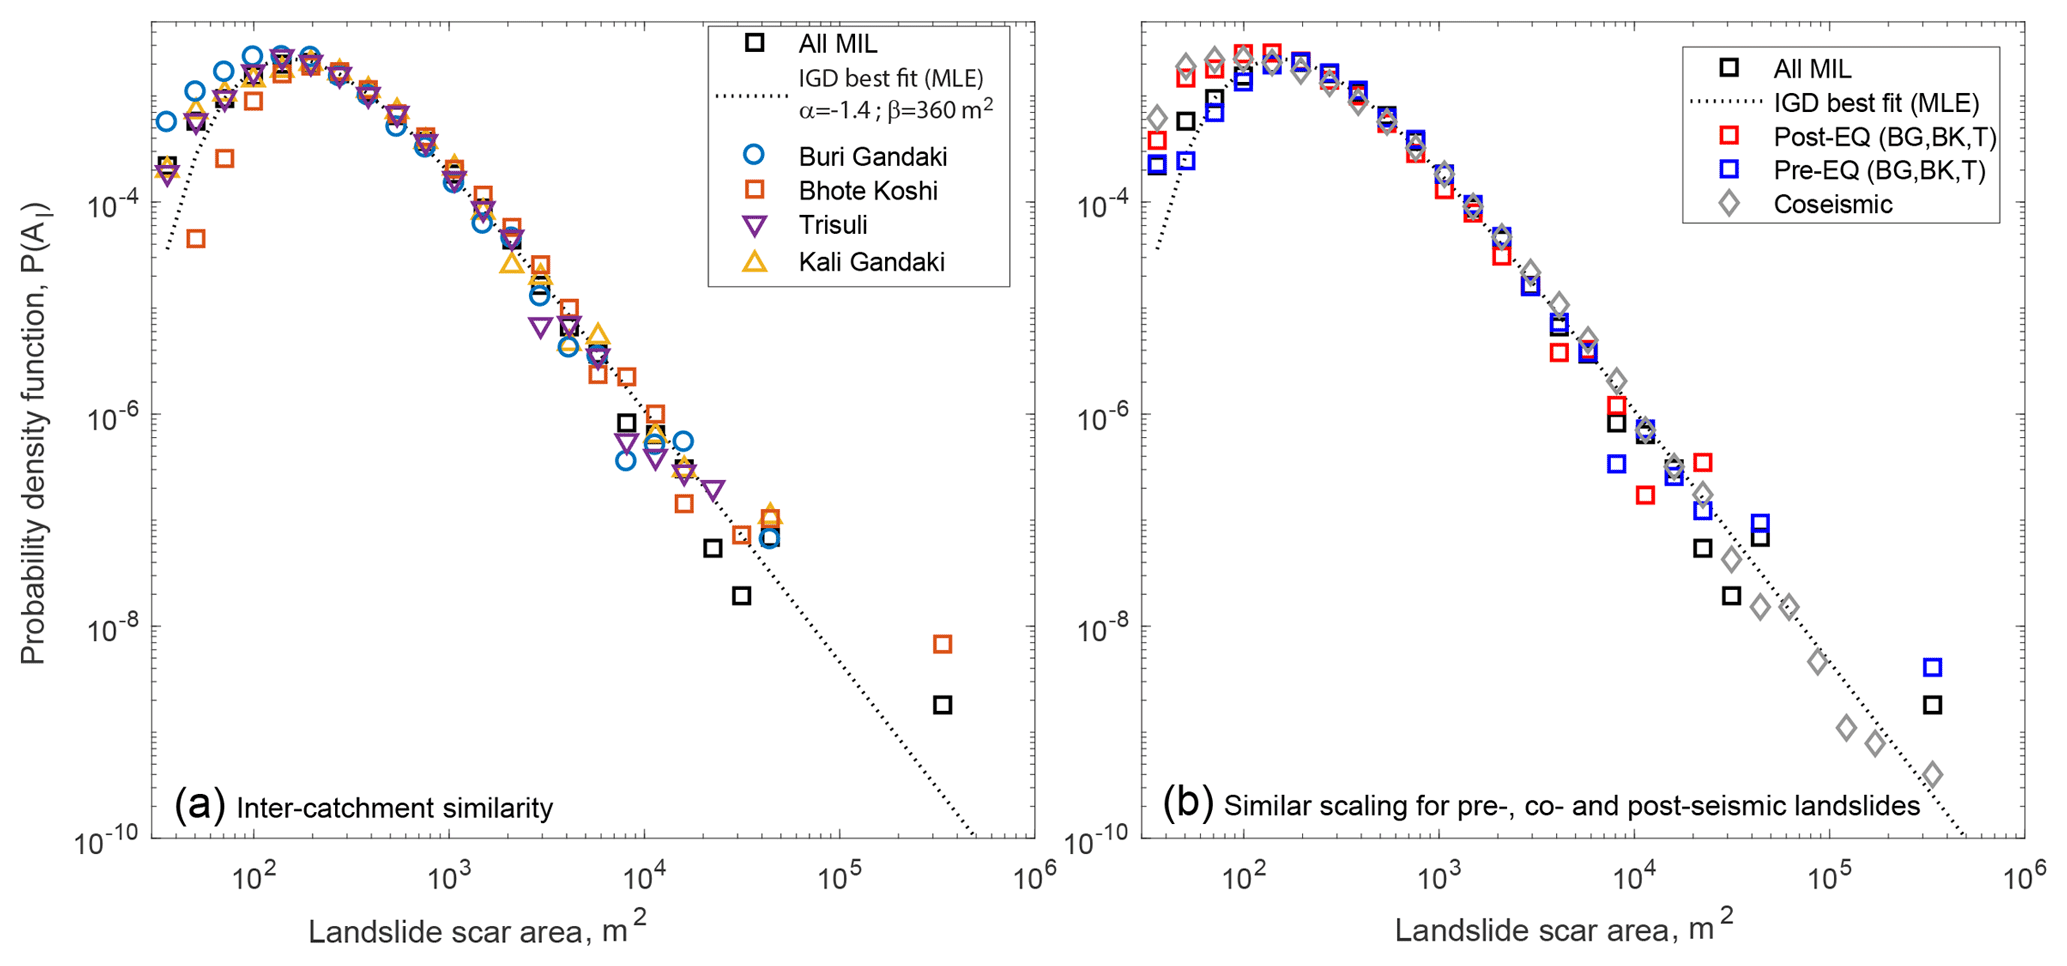
Figure 3Probability density functions of landslide scar area for different landslide populations. In both panels, black squares are for the monsoon-induced landslides (MILs) mapped in the four RapidEye tiles in the period 2010–2017 and dotted curves show the same best-fit associated inverse gamma distribution (IGD), with the two parameters given in the inset. In (a), data are subdivided by mapping area. In (b), the coseismic landslides (from Roback et al., 2018) normalized for run-out, are in grey, while landslides from the monsoon 2010–2014 and 2015 in the Buri Gandaki, Bhote Koshi and Trisuli mapping areas are in red and blue, respectively.
3.1.3 Earthquake perturbations of monsoon-driven landsliding
The 2015 monsoon season started shortly after the Gorkha earthquake and the large 12 May aftershock and caused exceptional landsliding in the three RE mapping areas (Trisuli, Bhote Koshi and Buri Gandaki) significantly affected by strong ground motion and coseismic landsliding. Landsliding in T, BK and BG reached 400 to 600 m2 km−2 and 1000 to 2500 m3 km−2, ∼3–6 times the 2010–2014 average (Fig. 2). Only 20 %–30 % of these landslides overlapped with recognized coseismic landslides, implying potential reactivation, confirming that the elevated landslide rate during the 2015 monsoon was due mostly to new landslides in weakened but previously stable slopes, as observed after other earthquakes (Marc et al., 2015). In contrast, at 110 m2 km−2 and 180 m3 km−2, the landslide rate in KG was slightly below the 2010–2014 average in this area. For other large, shallow earthquakes, elevated propensity to rainfall-induced slope failure has been reported to last from 0.5 to 4 years (Marc et al., 2015). The 2016 monsoon was stronger than usual and solicited above-average landsliding in the KG and T but not clearly in the BK and BG (Fig. 2). In 2016, the BK area was also affected by a glacier lake outburst flood that caused intense channel bank erosion and collapse of fringing hillslopes (Cook et al., 2018). Landslide rates in 2016 were 2 orders of magnitude higher than the pre-earthquake mean in a corridor (i.e. in the lower half of the slopes) along the Bhote Koshi main stem. However, if all landslides in this corridor are attributed to the flood and not taken into consideration, then the remaining landsliding is below the pre-earthquake average rate of monsoon-driven mass wasting (Fig. 2). In 2017, all catchments were within the pre-earthquake range. Analysing landslide density, that is total number normalized by the mapping area, would yield the same conclusions (Fig. S5).
Thus, after the 2015 earthquake, landslide susceptibility was significantly elevated during the 2015 monsoon but had recovered in 2017. Without an empirical correction for the variability in landsliding due to monsoon strength, it is unclear, yet, if the landsliding in 2016 was still affected by the earthquake. For now, we can only delimit the recovery between a few months and 1.5 years. A better understanding of the variability in landsliding in response to monsoon rainfall is required to refine this estimate.
3.1.4 Landslide size distributions
To understand the long-term erosion caused by landsliding, it is essential to quantify the frequency of small and large landslides and how it varies through our study area and with rainfall and seismic triggers. Size distributions of monsoon-induced landslide scars exhibit a typical probability density distribution (e.g. Stark and Hovius, 2001), with a characteristic power-law decay from 103 to 105 m2 and a rollover between 100 and 300 m2. Following Malamud et al. (2004) and using a maximum likelihood estimation (MLE), we can fit an inverse gamma distribution to each dataset with an almost identical mode and scaling exponent (i.e. , where P is a probability density function) (95 % confidence interval from MLE) (Fig. 3). Applying the method of Clauset et al. (2009), we find a power-law tail beyond a threshold area of ∼1200 m2 with (1σ for 150 bootstrap replicate determinations of α). The landslide scar area distribution derived from the catalogue of Roback et al. (2018) can be described by an identical exponent, but with a larger threshold area of ∼2500 m2. We also note that the 2015 landslides in BK, BG and T have similar size distributions to the ones found for these RE mapping areas in 2010–2014, with and (Fig. 3). This means that after the earthquake the landslide susceptibility was increased equally at all length scales relevant to mass wasting, consistent with what has been reported for other earthquakes (Marc et al., 2015).
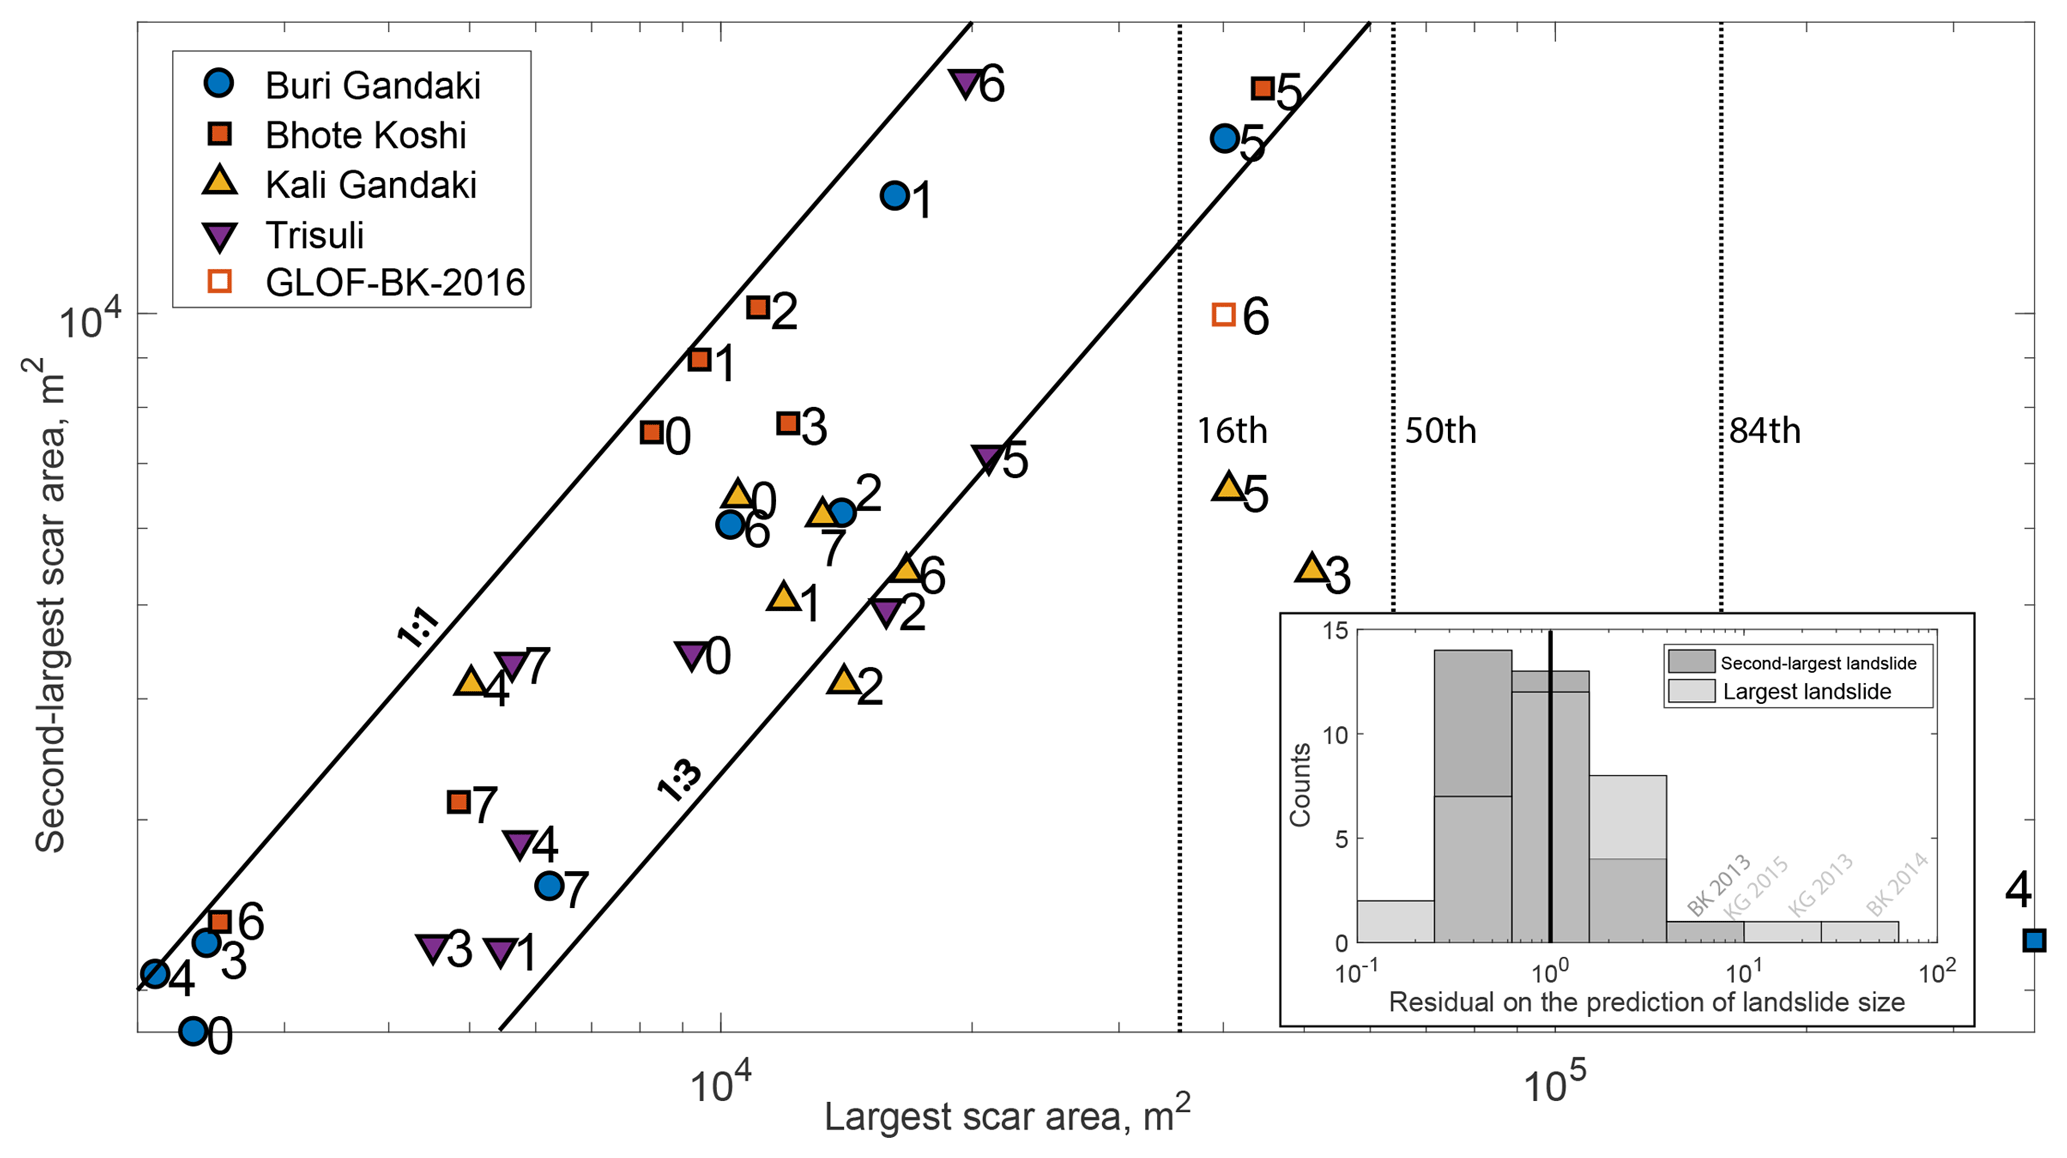
Figure 4Area of the second-largest landslide scar plotted against the area of the largest landslide scar for monsoons in the period 2010–2017 and four RapidEye mapping areas. The number associated with each symbol indicates the monsoon year relative to 2010. The 2016 Bhote Koshi inventory including the landslides attributed to the glacier lake outburst flood is shown as an open square; 1:1 and 1:3 lines are shown as solid black lines, while the three vertical dashed lines indicate the 16th, 50th and 84th percentiles of the landslide scar area from the 46-year long inventory of landslides with a whole area > 0.08 km2. The largest landslides in 2013 KG, 2014 BK and 2015 KG are 10–100 times larger than the rest of the landslide population triggered that year. Inset: histogram of the residual (ratio) between predicted (as a function of landslide number; see Malamud et al., 2004) and observed largest or second-largest landslide size. The black vertical line indicates correct prediction. For most years/catchments the predictions are within a factor of 3 of the observed largest size, except for BK 2014 and KG 2013 and 2015. When considering the second-largest landslides, these sub-inventories become unexceptional.
Finally, we note that for a number of monsoon seasons, the largest landslides seem distinct from the rest of the distribution. This is particularly clear when comparing the scar areas of the largest and second-largest landslides for each monsoon season and RE mapping area (Fig. 4). In T and BG, the largest landslide is never more than 3 times larger than the second largest, and for most monsoon seasons their sizes are very similar. In contrast the largest landslides in the 2013 and 2015 KG and the 2014 and 2016 BK inventories are 10 to 100 times larger than the second-largest ones. For the 2016 BK inventory, removing the large bank collapses likely caused by the glacier lake outburst flood resolves this discrepancy. With an adequate sampling of the size–frequency distribution, we would expect the maximum landslide area (Amax) in a random subset to increase with the total number of landslides in that subset. For an inverse gamma distribution with parameters α and β, the theoretical total landslide number is , with Γ the gamma function (see Eq. 25 in Malamud et al., 2004). The same expression holds for the second-largest landslide, if a prefactor of 2 is added to the right-hand side of this equation (Malamud et al., 2004). This prediction agrees within a factor of 2 with the size of the second-largest landslide scar for almost all monsoon seasons (Fig. 4 inset) but the largest landslide in the subsets with outliers discussed above (i.e. 2013 and 2015 in KG and 2014 and 2016 in BK) would require drawing 10 to 100 times more landslides to be consistent with this distribution.
3.2 Long-term sediment mobilization by landslide
Using essential landslide population characteristics gleaned from our combined datasets, we can now estimate long-term erosion by landsliding due to seismic and monsoon forcing based on the absolute frequency (yr−1 km−2) of landslides of all sizes.
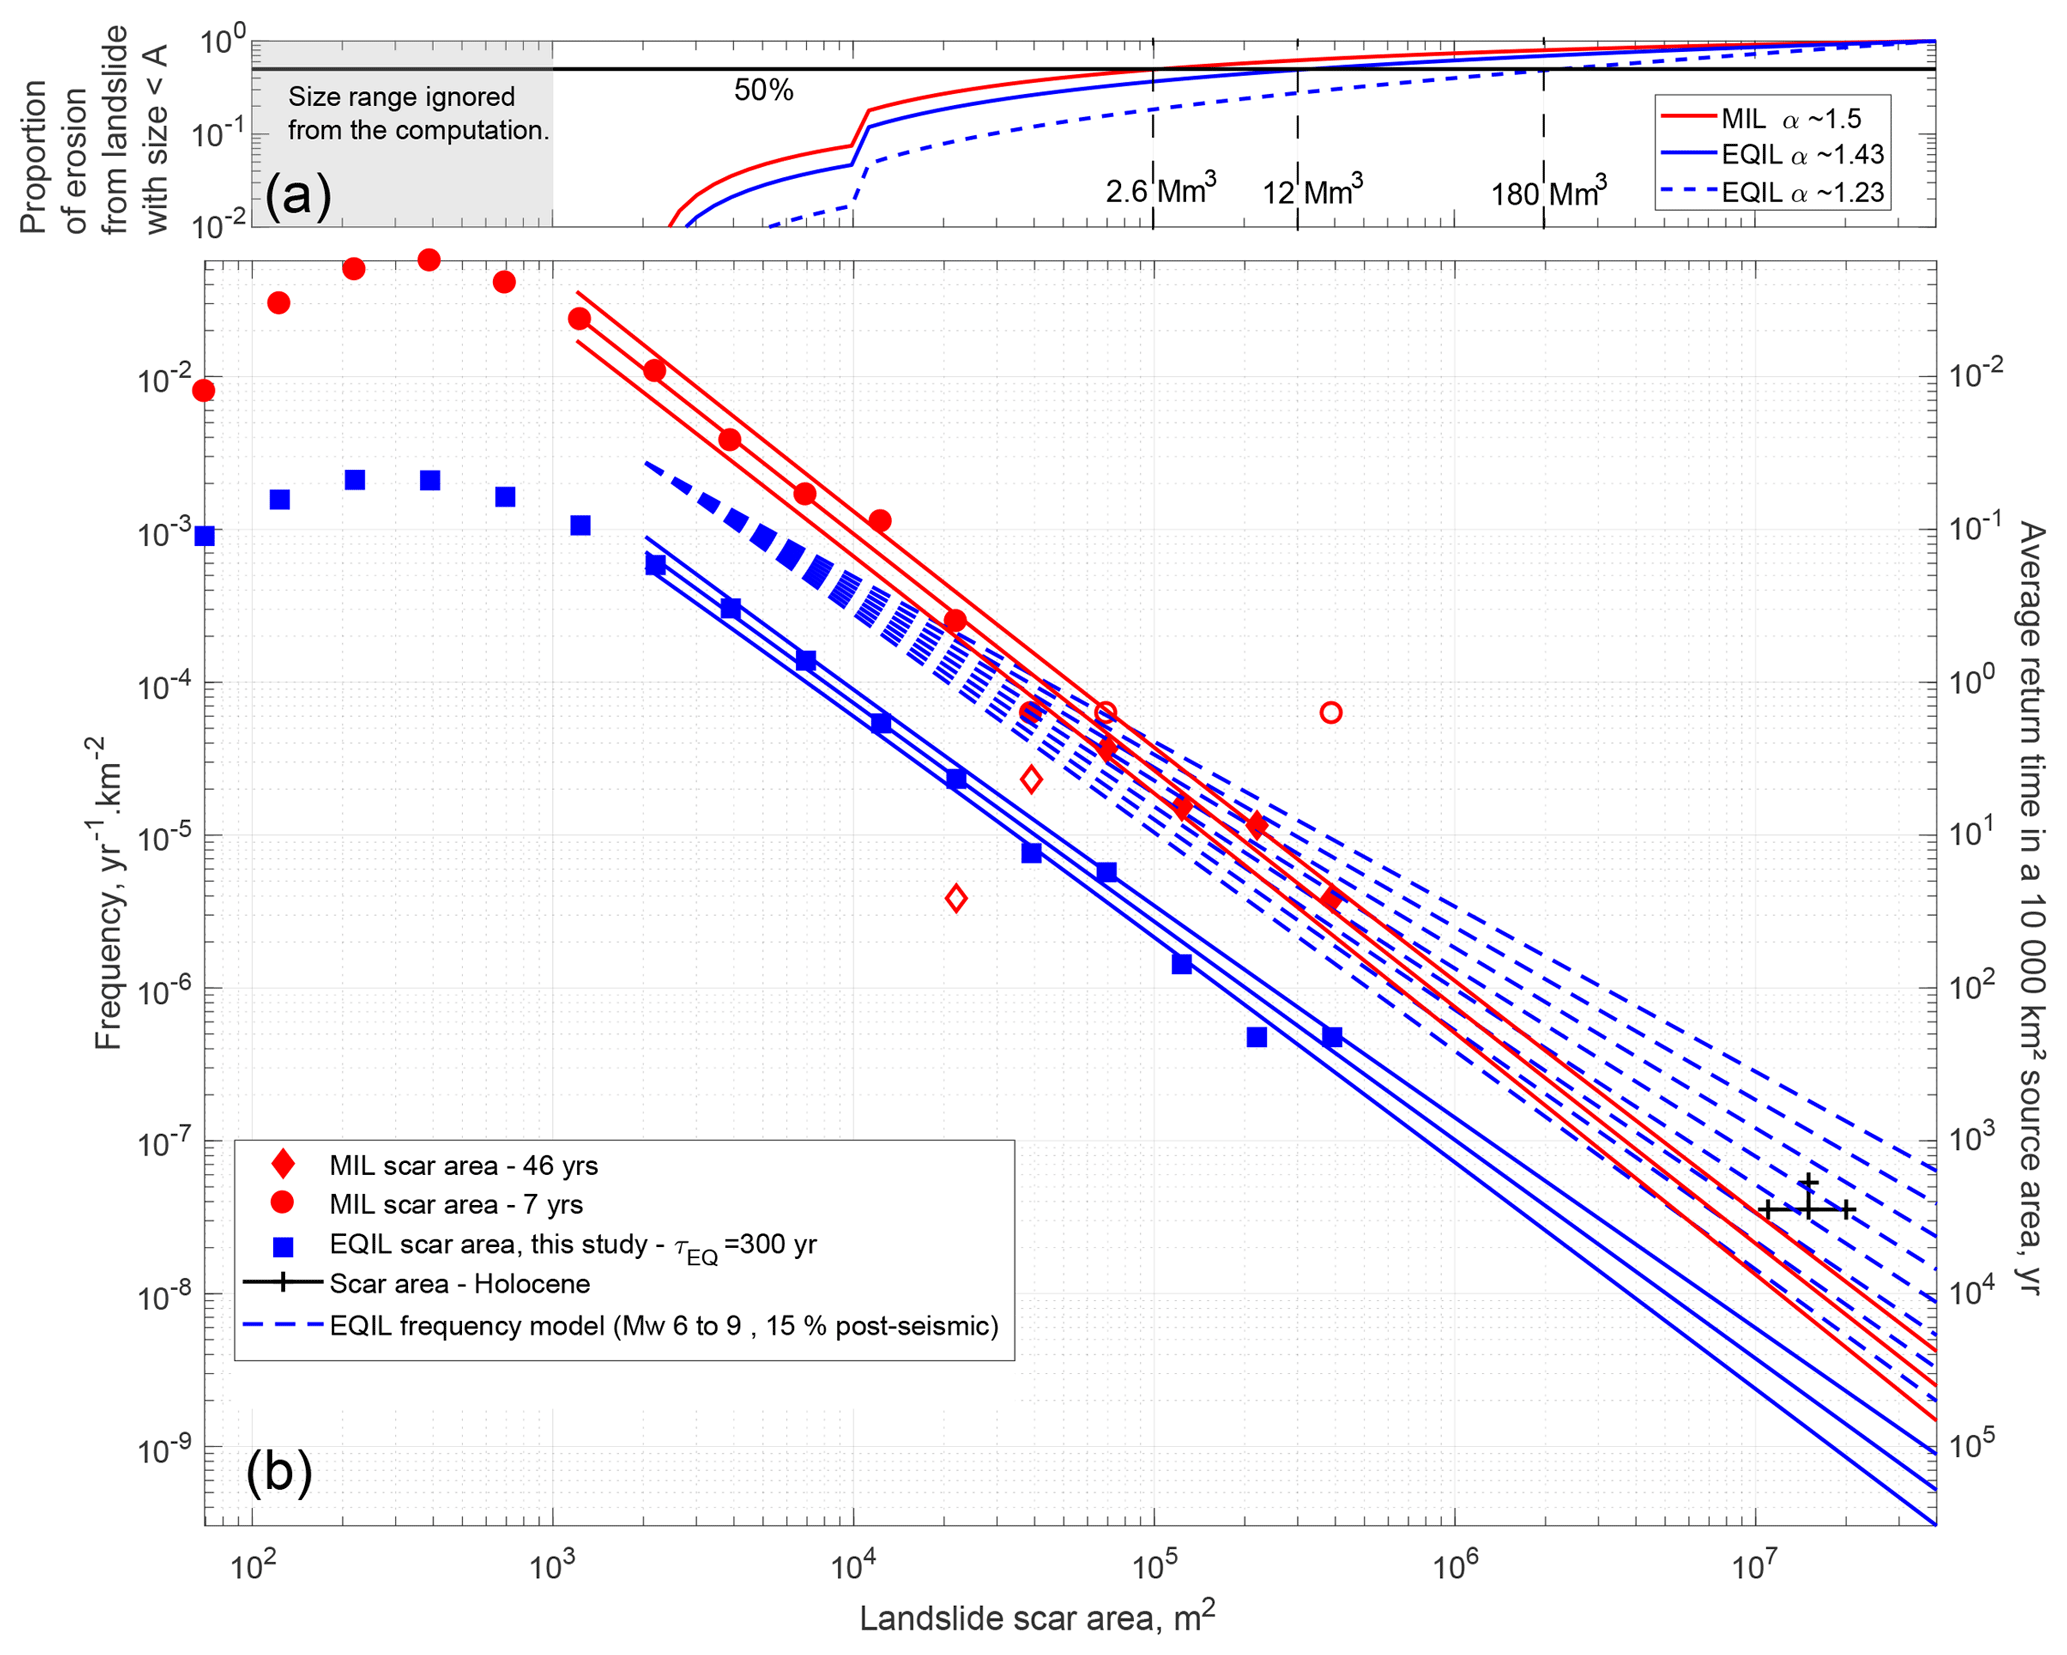
Figure 5(a): Proportion of total erosion due to a landslide scar larger than a given scar size against scar size. As a proportion it is independent of the absolute erosion rate (i.e. the landslide mean frequency) but only depends on α, explaining the almost identical curves for MIL (α∼1.5) and EQIL (α∼1.43). (b) Size–frequency distributions for the scar areas of landslides induced by the 2015 Gorkha earthquake, recent monsoons (2010–2017, except 2015) and large landslides in the last ∼46 years. The estimated size and frequency of giant landslides during the Holocene is shown in black. The blue and red lines are the least-square power-law fits with 1σ uncertainty range of the landslide frequency for the Gorkha catalogue and the combined monsoon catalogues (7-year catalogue up to 0.07 km2 and 46-year catalogue for larger landslides, i.e. ignoring the open symbols), respectively. The blue dashed lines are modelled scenarios for the representative earthquake-induced landslide size–frequency distribution. They include a correction for post-seismic landsliding (+15 %) and a factor ∼3 increase to account for the contribution of Mw 6 to 9 earthquakes.
3.2.1 Frequency of earthquake- and monsoon-induced landslides
Based on the comprehensive inventory of landslide polygons mapped by Roback et al. (2018), the frequency of earthquake-induced landslides varies from 10−2 km−2 yr−1for the modal scar area of ∼300 m2 to 10−6 km−2 yr−1 for 0.3 km2 scars (Fig. 5). The frequency decays with increasing landslide size as a power law with exponent αEQ∼1.42 in the size range from ∼2000 to 300 000 m2. Note that this is consistent with a probability density function exponent (i.e. α+1) of 2.4. Extrapolating this power-law trend to the size of observed giant landslides (10–20 km2), we obtain a frequency of km−2 yr−1 (confidence interval for 1σ range of the fitting parameters). This is ∼10–30 times lower than our frequency estimate from dated giant landslide deposits (Fig. 5).
To obtain a landslide size–frequency distribution representative of monsoon forcing, we exclude the post-seismic period during which landslide susceptibility was elevated. This period appears to have been mostly limited to 2015 and accordingly we use a catalogue describing 7 years of monsoon-induced landslides mapped from RE images. The anomalous mass wasting of the 2015, monsoon could be attributed to earthquake-induced effects. However, including these landslides in the seismic budget is not straightforward, and this is kept for discussion. The comprehensive mapping from RE imagery covering the most recent monsoon seasons constrains the distribution of intermediate-size landslides well (300 to 10 000 m2), but inadvertently overestimates the frequency of large (> 105 m2) landslides (Fig. 5). The multi-decadal catalogue of large landslides mapped from Landsat images allows the extension of the range of the landslide size–frequency distribution. The complementarity of the two monsoon datasets is borne out by the fact that the power-law decay of the RE catalogue, defined between ∼1000 and 70 000 m2 by αM∼1.5, predicts within ∼1σ uncertainty the frequency of larger landslides with scar areas of 0.07, 0.1, 0.2 and 0.4 km2 (Fig. 5) as determined from the Landsat catalogue. In the latter, smaller landslides exhibit a rollover likely emerging for mechanical reasons (Stark and Guzzetti, 2009; Frattini and Crosta, 2013; Milledge et al., 2014) given that it occurs for sizes below 500 m2, substantially larger than our resolution limit (i.e. a few pixels or ∼100 m2). Nevertheless, the power-law best fit combining both datasets has αM∼1.55 (consistent with the power-law best fit to the 7-year RE data and uncertainty obtained following Clauset et al., 2009). Using this scaling exponent, we obtain a frequency of km−2 yr−1 for giant landslides. This is ∼3–5 times below the frequency estimates of dated deposits (Fig. 5).
The Holocene giant landslides are not specifically attributed to a trigger mechanism, and their estimated frequency has uncertainties. Nevertheless, expected frequencies of MIL and EQIL alone or summed do not reach the lower frequency estimates for giant landslides. This implies either that another process is the main driver of giant landsliding or that we have underestimated the frequency of EQIL and/or MIL, as discussed in Sect. 4.1 and 4.2.
3.2.2 Long-term contributions
Integrating the best-fit frequency from 2000 m2 to the maximal landslide size, we obtain a long-term erosion rate from EQIL and MIL of 0.1 [0.08–0.14] mm yr−1 and 0.8 [0.6–1.2] mm yr−1, respectively. According to this approach, the total landslide erosion is about 0.9 [0.7–1.3] mm yr−1, with a modest 11 % due to EQIL. Given the value of the best-fit landslide size–frequency scaling exponent, about 70 % of the total landslide erosion in this estimate comes from landslides with scar areas larger than 0.02 km2 (∼0.3 Mm3) and 40 % from ones larger than 0.3 km2 (∼10 Mm3) (Fig. 5a). For both MIL and EQIL, we numerically computed the long-term erosion associated with landslides smaller than 1000 m2 (i.e. in the rollover of the size–frequency distribution) and found it to be less than 5 % of the long-term erosion due to the large landslides following a power-law behaviour. The largest landslide has a frequency of km−2 yr−1 (Fig. 5), implying a mean recurrence time τ=30 kyr within a 10 000 km2 region. A steady erosion rate is expected for measurements integrating over a few τ, unless the boundary conditions relevant to slope failure change. On shorter timescales, erosion proceeds at spatially and temporally variable rates.
4.1 Size–frequency distribution and controls on monsoon-driven landsliding
The long-term erosion associated with MIL and EQIL was derived with the assumption that the landslide size–frequency distributions defined by the 7-year RE and 46-year Landsat datasets and by the Gorkha landslide inventory, respectively, are representative of the entire area of interest and for timescales of 10 to 100 kyr. If the landslide size–frequency distribution reflects landscape mechanical and topographic properties (Stark and Guzzetti, 2009; Frattini and Crosta, 2013), then the similarity of the distributions in all datasets supports our earlier assumption that the four RE mapping areas as well as the area affected by coseismic landsliding are not significantly different (in terms of landslide dynamics) and that our wider area of investigation can be considered homogeneous. Within this area, we can quantify the variability due to earthquake activity and estimate the resulting landsliding on 10–100 kyr timescales using existing models, as detailed in the next section. However, on these longer timescales monsoon properties have certainly varied, and it is hard to determine how this may have affected the landslide size–frequency distribution, given that we have not found a connection between monsoon meteorological properties and landslide statistics in the last 8 years. This negative result may be due to the rainfall estimate we used, derived from satellites, which do not capture localized intense rainfall events that may be important for landsliding and explain landslide clusters occurring in different subparts of the RE images from one year to another. Alternatively, annual landsliding may be weakly related to hydro-meteorological properties because of a moderate monsoon variability compared to a system exposed to the extreme weather associated with typhoons or possibly because preconditioning factors are dominant relative to the rainfall forcing. Indeed, we have observed that recent, large landslides can depart significantly from the size–frequency distribution evaluated over short timescales (Fig. 4) but that they sit well within the regional landslide statistics compiled over longer timescales (Fig. 5). From a mechanistic point of view, the failure of the large 2013 and 2015 KG and 2014 BK landslides may have been controlled by progressive mechanical weakening (Weidinger, 2011; Lacroix and Amitrano, 2013) rather than by monsoon-driven pore-pressure changes, which govern the occurrence of shallow landslides in soil and regolith. This would imply that on short timescales the hazard posed by large landslides correlates weakly with the properties of the monsoon and that on long timescales the power-law tail of the MIL size–frequency distribution may depend more on processes modulating rock mass degradation (e.g. weathering, damage) than on variations in mean or extreme rainfall. These degradation processes operate at long timescales (1–10 kyr; Lacroix and Amitrano, 2003), and if they dominated large-scale landsliding, then they could yield a rather constant size distribution over the timescales of integration. This may not be true if variations in glacial, tectonic or climatic processes have modulated these degradation processes, spatially or temporally, across the Himalayas. Thus, assessing potential bias in the MIL size distribution and long-term erosion may require the quantification of the relative impacts of monsoon properties as well as the progressive degradation of hillslope stability on regional landsliding.

Figure 6Mean landslide erosion (dash–dot line), earthquake contribution to long-term erosion relative to a Mw 7.9 earthquake (solid line), earthquake frequency (crossed line) and earthquake-induced landslide distribution area normalized by a reference area (or area of interest, AOI) of 105 m2 (dotted line), plotted against earthquake magnitude. For each variable the upper, middle and lower curves are for a seismic source depth of 10, 12.5 and 15 km, respectively.
4.2 The contribution of earthquake-triggered landslides to long-term erosion
Accounting for landsliding induced by a Mw 7.9 earthquake, similar to the Gorkha earthquake and with a return time of ∼300 years yields only a modest EQIL contribution (11 %) to long-term erosion (Sect. 3.2.2) and an underestimation of the frequency of giant landslides (Sect. 3.2.1). Even if the uncertainty on the recurrence time of an earthquake of this magnitude is substantial (at least ∼50 years), it is not likely to significantly reduce the order of magnitude difference between MIL and EQIL frequency. Neither do the elevated landslide rates that persist for some time after an earthquake. In the case of the Gorkha earthquake, this transient landslide pulse equated to about 4–6 years of monsoon-induced landsliding in a period of about 1 year (Fig. 2). For a 300-year return time of a Gorkha-sized earthquake (Sect. 2.3), this pulse may represent 1.3 % to 2 % of the long-term MIL or up to ∼13 %–18 % of the long-term EQIL. Although non-negligible, it still leaves EQIL long-term erosion far behind MIL erosion. This may be a fact of nature in the central Nepal Himalayas, but we recognize two potentially significant controls on a larger contribution of EQIL to long-term erosion.
The first control is earthquake size. Both smaller and larger earthquakes than the 2015 Mw 7.9 Gorkha earthquake occur along the Himalayan front, triggering substantial landsliding. Examples include the 2011 Mw 6.9 earthquake in Sikkim, the 2005 Mw 7.5 Kashmir earthquake, and the 1950 Mw 8.6 Assam event (e.g. Mathur, 1953; Sato et al., 2007; Chakraborty et al., 2011). To estimate the contribution of earthquakes of all magnitudes compared to the mass wasting due to the 2015 Mw 7.9 event, we combined a Gutenberg–Richter distribution of earthquakes, consistent with seismicity in Nepal (Avouac, 2015), with a seismologically consistent model for the volume of earthquake-induced landslides (Marc et al., 2016a) and the area within which they occurred (Marc et al., 2017). The model accounts for seismic moment, fault type, source depth and surface topography and predicted the total landslide volume associated with the Gorkha earthquake to within a factor of 2 of the volume estimated from comprehensive landslide maps (Marc et al., 2016a; Martha et al., 2016; Roback et al., 2018). The long-term erosion rate due to all earthquakes of a given magnitude along a portion of the Himalayan front can be written as
with Emw the mean erosion per earthquake (i.e. total landslide volume divided by affected area), P(aff)mw the probability that a given unit surface area (1 km2) is affected and Fmw the earthquake frequency (Fig. 6). Assuming all earthquakes distribute randomly within a portion of the mountain front, i.e. a ∼600 km long band spanning from the Siwaliks to the high range (∼150 km) with a reference area of 105 km2, we approximate P(aff)mw by the area affected by EQIL over this reference area. We assume that, except for magnitude, all earthquakes are similar to the Gorkha earthquake, occurring on a reverse fault at a depth of 15 km under a landscape with a modal slope of 28∘, thus neglecting variations in topography, climate and lithology. The model predicts that rare, large earthquakes (Mw > 7.5) do not cause significantly more erosion than frequent intermediate ones (Mw∼6.8) because the increase in landslide volume with earthquake size is mainly associated with an increase in affected area not landslide density (Fig. 6). However, each large earthquake represents a considerable fraction of the Himalayan front, while many intermediate-size earthquakes are required to cover the same fraction. The final result is that, intermediate earthquakes (Mw 6.8) dominate the long-term erosion, being ∼20, 2 and 4 times more important than earthquakes of Mw 6, Mw 7.9 and Mw 8.6, respectively, but that other earthquake sizes contribute substantially to total long-term erosion. Hence, to obtain the total earthquake contribution, we must integrate from Mw∼6 to the maximal earthquake magnitude. The largest Himalayan earthquake on instrumental record is the 1950 Mw 8.6 Assam earthquake, but closure of the tectonic slip budget may well require larger earthquakes of up to Mw 9 or more to occur (Avouac, 2015; Stevens and Avouac, 2016). For maximum earthquake magnitudes of Mw 8.6 and 9, the cumulative contribution of earthquakes to long-term erosion should be about 2.9 and 3.1 times that of Mw 7.9 earthquakes (Fig. 5). In both cases, increasing the Gutenberg–Richter exponent, bGR, to 1.1 leads to a larger contribution by small to intermediate earthquakes and an increase in the total EQIL erosion by about 15 %. The opposite would be true for smaller values of bGR.
The second control on EQIL is earthquake depth. The Gorkha earthquake may also not have been representative, as it was relatively deep (15 km) and did not rupture the surface (Avouac et al., 2015). In contrast, paleo-seismological investigations have shown that large surface-rupturing earthquakes (> 100 km long) have occurred along the Himalayan range (Mugnier et al., 2013; Bollinger et al., 2014). Earthquakes shallower than the Gorkha event would likely produce stronger ground motions and thus trigger more landslides and also potentially more large landslides. This would be consistent with the attribution of giant landslides (> km3) in the Pokhara area to medieval earthquakes (Schwanghart et al., 2016) and suggests that earthquakes may contribute a non-negligible proportion of the largest landslides in the region. Further, analyses of a global database of 11 EQIL inventories showed a linear increase in the exponent of landslide size probability density function, αEQ+1, from 1.9 to 3 with seismic source depth from ∼3 to 20 km (i.e. ) (Marc et al., 2016a). The landslide population of the Gorkha earthquake has a size–frequency scaling exponent (for whole landslide areas) with a source at 15 km, consistent with this trend. The earthquakes in the global database were all larger than Mw 6.5, and accordingly their ground shaking can be considered to be controlled mainly by attenuation. Therefore, a shallower source would yield larger strong motion, capable of mobilizing deeper and larger landslides (Marc et al., 2016a; Valagussa et al., 2019). Such difference is especially expected for out-of-sequence earthquakes, propagating on the Main Central Thrust (MCT), while in-sequence rupture will propagate further south on the Main Himalayan Thrust (MHT) flat zone, away from our study area. Nevertheless, depth is only one of the controls on seismic ground shaking and the resulting proportion of large landslides and other geophysical aspect may modulate them, such as stress drop and rupture dynamics (Causse and Song, 2015).
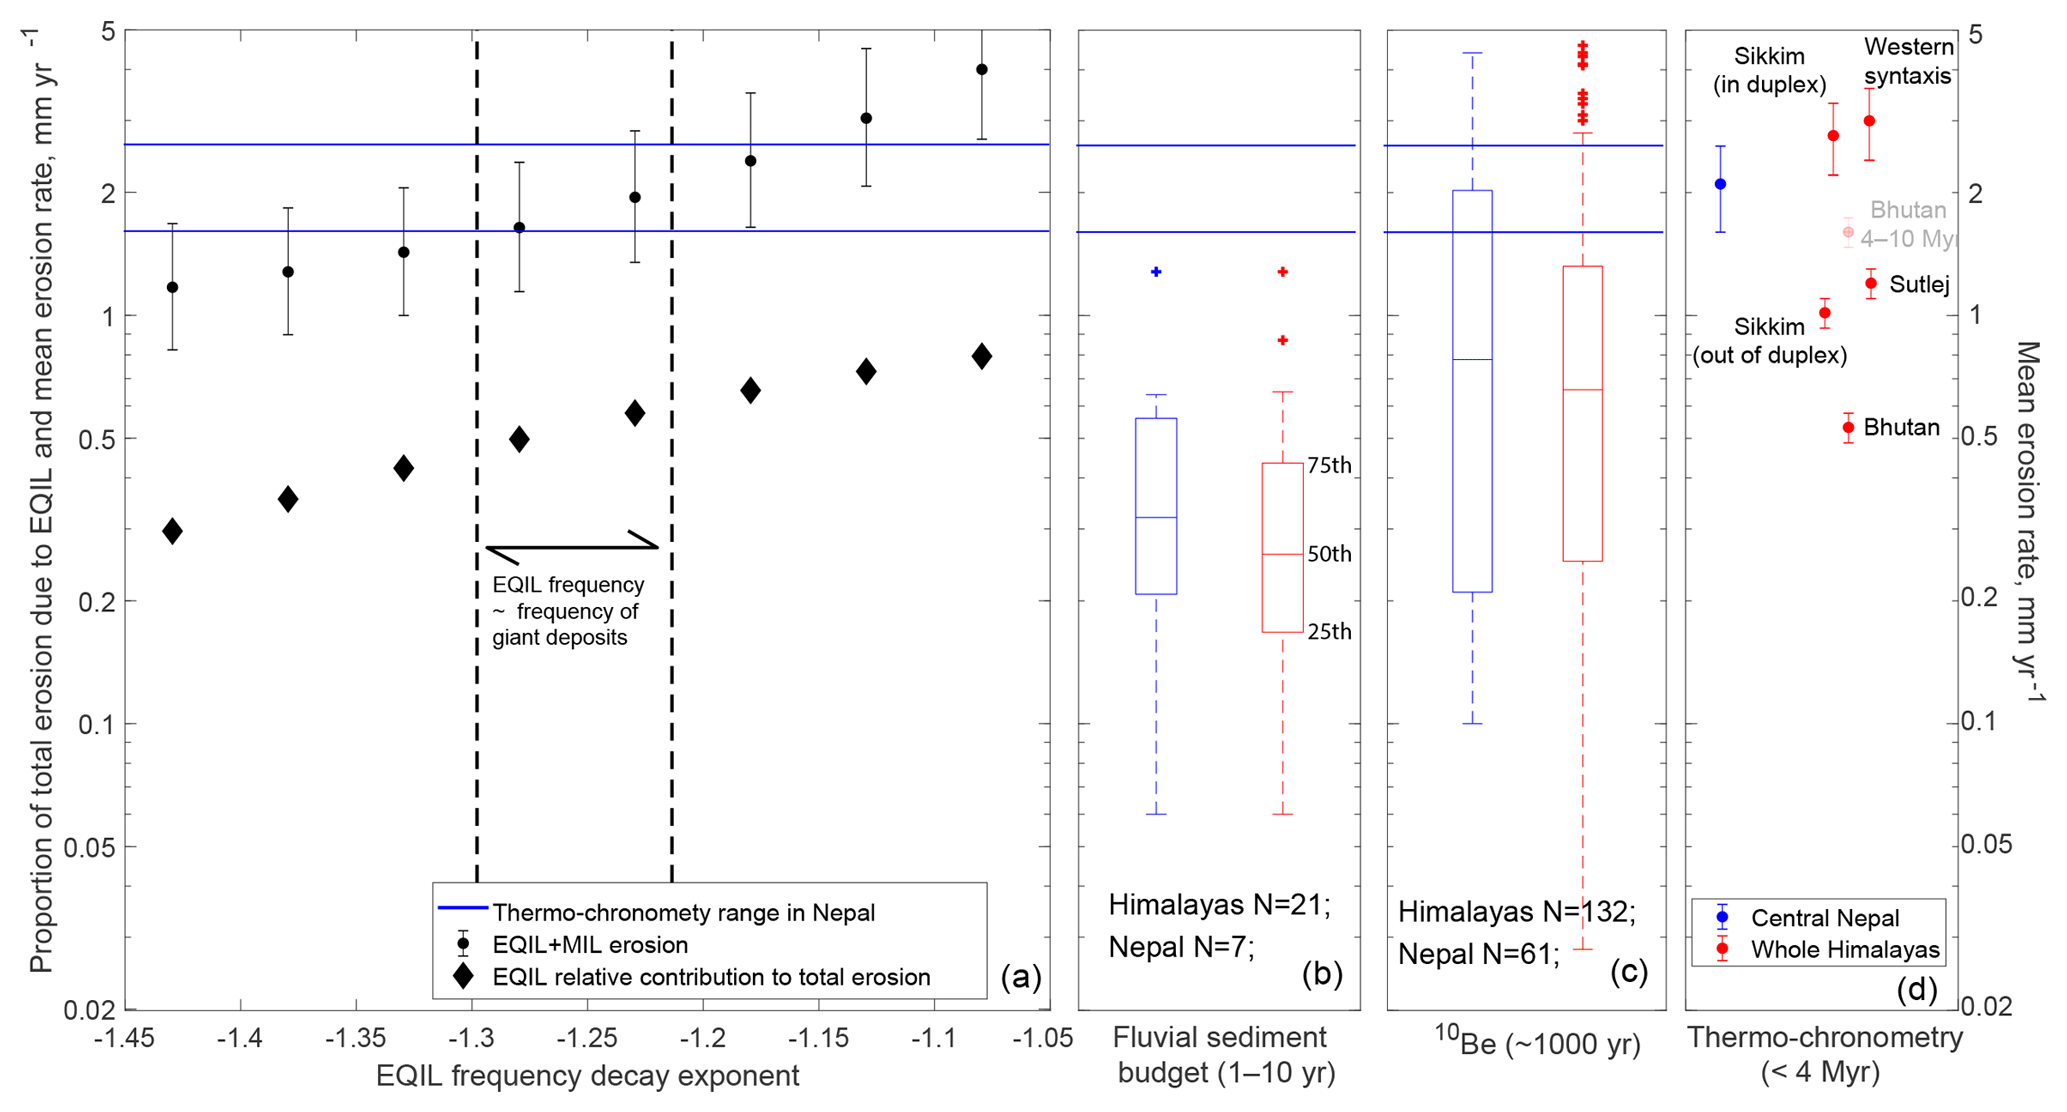
Figure 7Long-term erosion rates (circles with uncertainty bars) obtained by integrating and summing the earthquake and monsoon best-fit distributions (converted into volume), as a function of the modelled decay exponent of the size distribution of EQIL (a). EQIL distribution takes into account all earthquake magnitudes as well as the post-seismic landslide contribution. The proportion of erosion due to earthquakes in the different scenarios is shown by the black diamonds. Erosion rates estimated from fluvial sediment budget (1- to 10-year scale, b), 10Beryllium catchment-wide concentration (1000-year scale, c) and thermo-chronometric methods (million-year scale, d) in central Nepal (blue) and the Himalayan arc (red). In (a) and (b), we visualize the data for catchments between 100 and 5000 km2, thus excluding main rivers draining large areas. Sediment budgets are from Rao et al. (1997) (Chenab), Ali and De Boer (2007) (western syntaxis), Gabet et al. (2008) (central Nepal), and Wulf et al. (2012) (Sutlej). 10Be measurements are from Wobus et al. (2005) and Godard et al. (2012, 2014) for central Nepal, Scherler et al. (2014) in the Sutlej, Portenga et al. (2015) in Bhutan, and Abrahami et al. (2016) in Sikkim. Box plots show 25, 50 and 75 percentiles, whiskers are the furthest data within a distance equal 1.5 times the interquartile range beyond the boxlimit, and data beyond whiskers are shown as crosses. For thermo-chronometric data we report the mean and standard deviation of the denudation of the models best explaining the age compilation done by Thiede and Ehlers (2013) for the Greater Himalayas sequence in the western syntaxis, the Sutlej, central Nepal and Bhutan. In Sikkim, erosion estimates for within and without a zone interpreted as a duplex are from Landry et al. (2016) and Abrahami et al. (2016), respectively.
We propose a quantitative correction of the EQIL size–frequency distribution, accounting for a range of earthquake magnitudes, post-seismic elevated landsliding and a higher proportion of large landslides as a consequence of stronger ground shaking. The two former effects are modelled as an increased frequency at all sizes by a factor 3.3, equal to the erosion from all earthquakes Mw 6 to 9 normalized by the erosion caused by Mw 7.9 earthquakes (assuming a source depth of 12.5 km and bGR=1; Fig. 6) and by a factor of 1.15, assuming the proportion of post-seismic landsliding relative to coseismic landsliding is constant with magnitude. We explore the effect of a higher proportion of large landslides by computing EQIL long-term erosion with a progressively increasing proportion of large landslides relative to a fixed frequency of small landslides (Fig. 5). For example, assuming landslide scar frequency and whole landslide frequency had similar decays for the cases studied by Marc et al. (2016a) (as we found it to be the case for the Gorkha earthquake), a decrease from αEQ∼1.4 to 1.2 could be caused by source depth reduction from 15 to 12 km. With these corrections and for αEQ∼1.23–1.28, we find that the EQIL frequency matches the long-term frequency of giant landslides, and that EQIL would contribute 50 %–58 % of a total erosion of 1.6[1.1–2.4] to 1.9[1.3–2.8] mm yr−1 (Figs. 5, 7). It being the only range of scenarios matching the estimated giant landslide frequency, we consider that αEQ∼1.23–1.28 is most likely to represent long-term earthquake-induced landsliding. Modelling the landslide erosion associated with a repeating earthquake similar to the Wenchuan earthquake, Li et al. (2017) proposed that the EQIL erosion rate amount to 55 %–130 % of the long-term fission track exhumation rate. Given exhumation rate also showed a focus on the front of the range, where most earthquakes and EQIL occur, they considered the long-term erosion to be dominated by EQIL, different from the rather balanced contribution between seismic and non-seismic forcing that we report (Fig. 7). In the Wenchuan area rainfall contributions to landsliding were not constrained, and it is unclear if the rainfall there is less effective in mobilizing landslide than the monsoon or if its impact was underestimated. Thus, refined estimates of the relative contribution of earthquakes to long-term landslide erosion depend on understanding their ability to trigger very large landslides as well as adequately constraining the contribution of non-seismic landslides.
4.3 Implications for erosion rates across different timescales
The stochastic nature of landsliding implies variations in the erosion rate averaged over different timescales, associated with the occasional occurrence of very large slope failures and with variations in the strength of seismic and monsoon forcing. A general caveat is that these rates represent mobilization of bedrock into sediment deposited on lower portions of the hillslope and in channels. In contrast, erosion rates derived from sediment budget and 10Be refer to the materials transported by the rivers. Small landslides (As < =104) have small volumes and likely deposit relatively fine-grained materials (mostly from shallow, weathered soil and regolith) that should be remobilized and transported by rivers within one to a few monsoons. Thus, to the extent that ∼50 % and 90 % of our RE catalogue had their largest or second-largest landslide size at about 104 m2, we likely have short-term sediment export on the same order as landslide rates. On millennial timescales, the evacuation of sediments must depend on river transport capacity and the remobilization of debris on hillslopes, likely linked to hydro-climatic forcing (Pratt et al., 2002; Cook et al., 2018). A recent modelling study suggest that fast (10–100-year) evacuation of most of any large landslide deposit should be achievable due to river morphology self-adjustment (Croissant et al., 2017). However, the variable state of the export of giant deposits (> 80 % preserved for Latamrang and Dhumpu (5 kyr) deposits but ∼25 % for the Braga (pre-LGM) deposit; Weidinger, 2006), as well as evidence of substantial sediment storage in the high range (Pratt-Sitaula et al., 2004; Blöthe and Korup, 2013; Stolle et al., 2019) suggest complex evacuation dynamics. As a result, landslide erosion rates may be similar to or significantly larger than 10Be depending on whether landslide evacuation over the last ∼1 kyr was efficient or not. Nevertheless, the estimated total modern storage in the central Himalayas is ∼100 km3 within an area of > 105 km2 (Blöthe and Korup, 2013), equivalent to a mean cover of 1m, or about 500 years of landslide erosion, while fission track indicates that ∼2 mm yr−1 of erosion has been sustained for 10 Myr or more, clearly indicating that, on million-year timescales, landslide deposits are effectively transported and storage is extremely minor.
We obtain landslide erosion rates that increase across timescales, from highly stochastic low rates of 0.1–1 mm yr−1 for recent monsoons (Fig. 2) to an expected steady rate of at least 1.2[0.8–1.7] mm yr−1 but more likely 1.9[1.1–2.8] mm yr−1, with shallower earthquakes triggering more large landslides than the Gorkha event (Fig. 7), over large areas and on 100 kyr timescales. This range of rates matches independent estimates from fluvial sediment budget on the annual to decadal scale, between 0.2 and 0.6 mm yr−1 (Gabet et al., 2008), on the one hand, and those from fission track, between 1.6 and 2.6 mm yr−1 (Thiede and Ehlers, 2013), on the other. These rates were determined in the Greater and Lesser Himalayas in central Nepal. 10Be-derived erosion estimates in similar zones, mostly ranged between 0.2 and 2 mm yr−1 (Wobus et al., 2005; Godard et al., 2012, 2014), averaging over ∼300–3000 years in catchments typically covering 1/10th of our study area (∼1000 m2). These values lie between the short-term and the long-term erosion estimates for landsliding, and they are consistent with an integration of landslide frequency over a landslide size range commensurate with the spatial and temporal scales sampled by the cosmogenic radionuclides. For example, sampling a drainage area of 1000 km2 and resolving 500 to 1000 years of erosion is equivalent to integrating up to a landslide frequency of ∼1 to 2.10−6 km−2 yr−1, equivalent to a maximum landslide size of ∼0.5 to 1 km2 (25 to 68 Mm3) for both MIL and EQIL corrected for magnitude distribution (Fig. 5). The latter yields an erosion rate dominated by MIL of 0.7[0.5–1] to 0.8[0.6–1.1] mm yr−1, for magnitude-corrected EQIL frequency of αEQ=1.43 and 1.23, respectively. The larger variations around these values found in 10Be studies may be attributed to variations in the timing and size of the last large landslide in a catchment (in addition to potential bias or mixing issues; e.g. Lupker et al., 2012; Portenga et al., 2015). Although data quantity in different subparts of the orogen is unequal, a similar picture is emerging from other areas (western syntaxis, Sutlej, Sikkim), except perhaps in Bhutan where long-term exhumation from thermo-chronometry may not be larger than 10Be (our Fig. 7; Portenga et al., 2015; Thiede and Ehlers, 2013).
The general good agreement between our landslide erosion estimates and independent constraints on erosion over timescales ranging from 100 to 105 years suggests that in the High Himalayas, bedrock landsliding can be considered the principal erosion agent and sediment supply mechanism to river on decadal to geological timescales. Landslide dominant influence requires the hillslopes to be coupled to rivers able to evacuate sediments and maintain steep slopes as is the case in the Himalayas. Our findings are consistent with reports from other active mountain belts that landsliding drives sediment production on decadal to centennial scales (Hovius et al., 1997; Blodgett and Isaacks, 2007; Morin et al., 2018). For the first time, we extend this insight to a ∼100 kyr timescale.
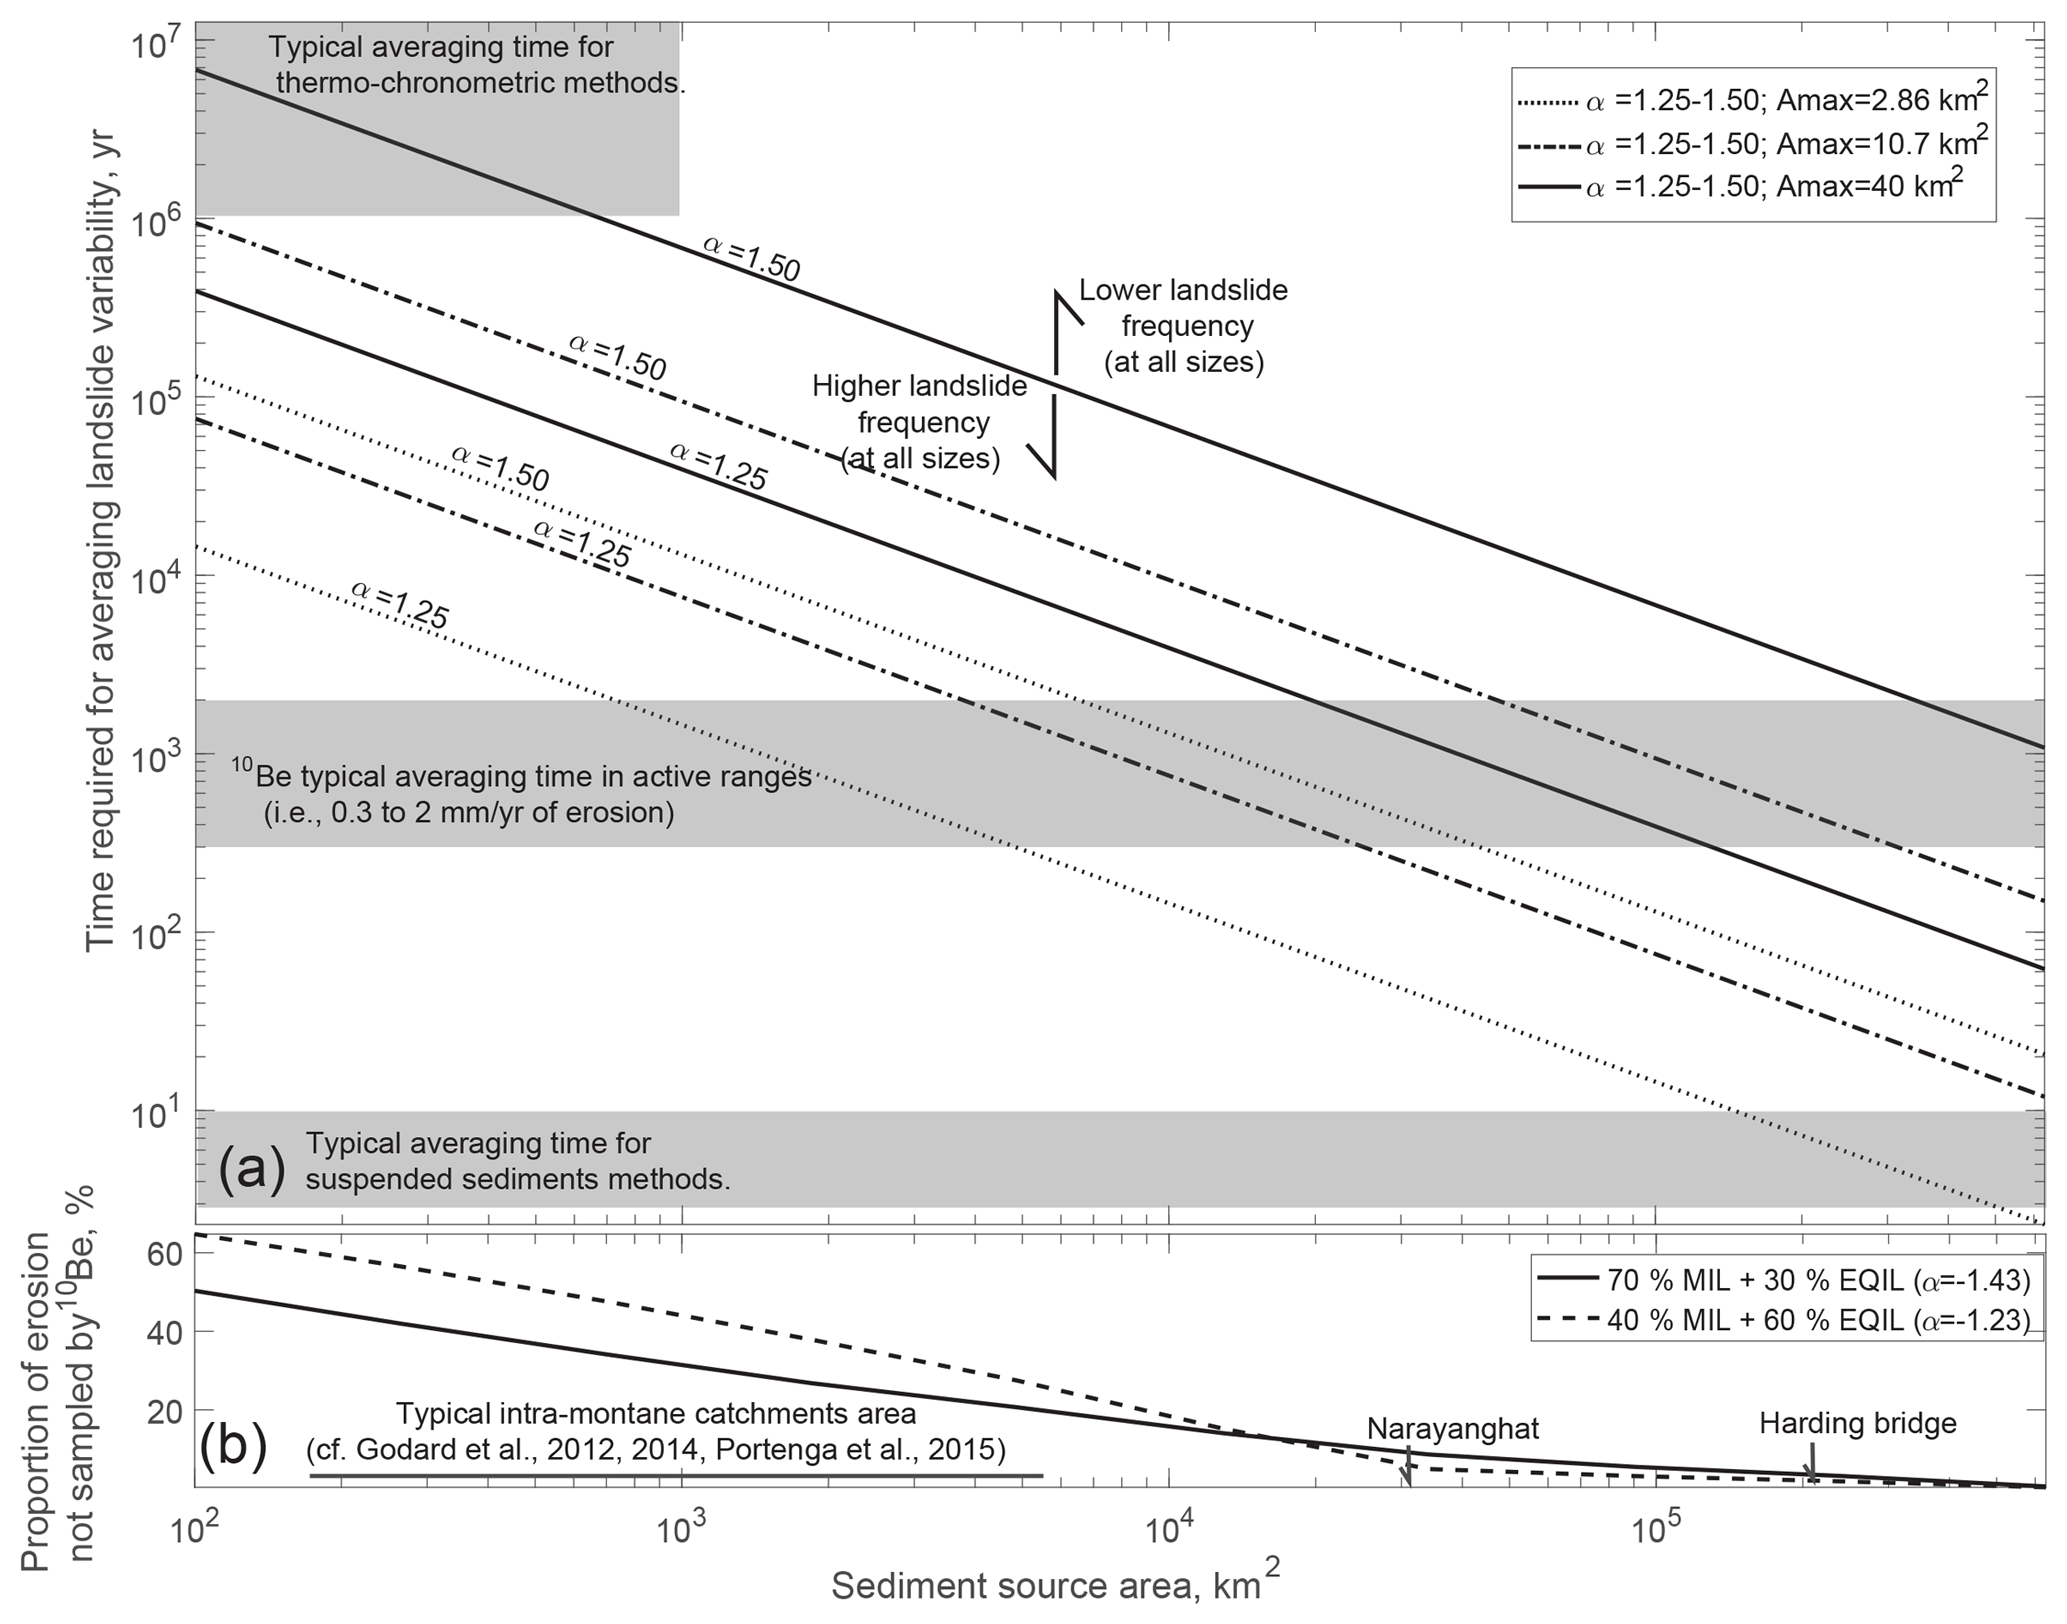
Figure 8(a) Estimation of the time required for averaging the statistical variability in landslide erosion (taken as ), as a function of the size of the sediment source areas, Ased, and the properties of the landslide size–frequency distribution. Typical catchment areas in Himalayan studies, as well as downstream sampling sites at Narayanghat or Harding Bridge are indicated, together with the range of averaging time for 10Be measurements, fluvial sediments and thermo-chronometric methods. Note that thermo-chronometric cooling ages are point measurements, but nearby samples are highly correlated up to 10–30 km distance (Fox et al., 2016) as long as there are no breaks in the tectonic/erosional context (Schildgen et al., 2018). Hence, we believe this methods can be used for spatial scales of ∼100–1000 km2, consistent with the catchment scales at which detrital thermo-chronometry seems to be valid (Ruhl and Hodges, 2005). The timescale is inversely proportional with the source areas but increases strongly with the maximal landslide scar area and the size–frequency power-law exponents (α, or equivalently the return time of the largest landslides). An increase or reduction in the overall landslide frequency would result in a proportional change in the averaging timescale. (b) Proportion of erosion not sampled by 10Be measurements averaging over 600 years against the sediment source area sampled. This estimate is based on the proportion of total erosion due to landslides larger than the one with a 600-year return in the Himalayas (Fig. 5), considering MIL and Mw-corrected EQIL frequency with a decay similar to the Gorkha earthquake (solid line) or more heavy-tailed (dashed).
Moreover, we show that the stochastic nature of landsliding together with the heavy tail distribution of landslide scar areas can explain the observed increase in erosion rates from short to long timescales in the Nepal Himalayas and elsewhere (see Kirchner et al., 2001). This is the case as long as the spatial and temporal scales of averaging are short compared to , with fmax the frequency of the largest possible landslides in a region (Fig. 8). For an area of 10 000 km2 in the Nepal Himalayas, about 100 kyr are enough for about three of the largest landslides to occur, implying that exhumation rate variations measured by thermo-chronometry over millions of years (Thiede and Ehlers, 2013) cannot be due to incomplete sampling of landsliding. Instead, to explain these observations, an actual variation in erosion is required, due, for example, to changing boundary conditions modulating landslide frequencies and/or other erosion processes. In contrast, typical averaging times of 10Be methods (∼600 years for 1 mm yr−1 of erosion) are more than 10 times shorter than the time required for steady long-term landslide erosion in the Himalayas. This is true even for the largest catchments sampled so far, for example, the Ganga river at Harding Bridge, gathering drainage from ∼200 000 km2 of mountain terrain (Lupker et al., 2012). Mountain ranges with very large landslides but with a lower landslide frequency (possibly in the Tian Shan or the Western Andes) may require even longer timescales for steady landslide erosion. In contrast, reducing the maximum landslide size, for example, because of a lower relief or weaker rock mass, or increasing the frequency of giant landslides may reduce the required sampling time by up to a factor of 10 to 100. This may be the case for active mountain ranges such as Taiwan or New Zealand, with steady landsliding averaged over 500–5000 years for 10 000 km2 source area (Fig. 8a). Still, these settings likely require source areas > 10 000 km2, well above the typically sampled catchment size of 1000–5000 km2, for 10Be methods to properly average erosion, especially because such settings likely have higher erosion rates and thus lower 10Be sampling times. Exhaustive modelling of the bias of 10Be is beyond the scope of this contribution. Nevertheless, for our case study, the proportion of erosion that can statistically be expected to be missed by 10Be measurements averaging over 600 years is ∼40 %–60 % for individual mountain catchments and ∼20 % for a 10 000 km2 source area (Fig. 8b). The inadequate averaging time of 10Be compared to the frequency of large landslides is, therefore, a major caveat in addition to incomplete mixing or sediment storage (Lupker et al., 2012; Dingle et al., 2018). It may explain most of the 10Be variability across small to intermediate catchments and differences between present and paleo-erosion rates. Lastly, we note that previous studies that modelled the impact of landslides on 10Be erosion rates (Niemi et al., 2005; Yanites et al., 2009) concluded that accurate estimates could be achieved for catchments much smaller than indicated by our results (10–102 km2 vs. > 104–105 km2). Both these previous studies underestimated the required spatio-temporal averaging mainly because they substantially underestimated the largest landslide size, using 1 km2 (0.05 km3) instead of ∼40 km2 (10–15 km3). In addition, Niemi et al. (2005) used a heavy-tailed landslide size–frequency distribution with an exponent of α=1.1, resulting in a higher frequency of large landslides than that borne out by our data.
In summary, large landslides (> 1 km2, > 70 Mm3) with a typical recurrence time of < 1 kyr affect < 1 % of an area of ∼10 000 km2 but contribute at least 30 % and likely up to ∼50 % (if αEQ=1.23) to long-term (i.e. ∼100 kyr) erosion rates. This implies that erosion patterns are extremely heterogeneous on even longer timescales. At shorter timescales, to 100 kyr, erosion and sediment sourcing may be much more intense in specific hotspots associated with large-scale landsliding. We can expect such hotspots to be preferentially located in high-relief areas (Korup et al., 2007). The occurrence of giant landslides would thus always decrease total relief, providing a geomorphic mechanism limiting the height of Himalayan peaks. Moreover, the occurrence of large landslides with scar areas > 0.1–1 km2, which dominate erosion, is often related to the local evolution of rock mass properties, for example, shear localization, ore mineralization along failure planes, the reactivation of tectonic structures or progressive weathering due to focused groundwater circulation (e.g. Weidinger et al., 2002; Lacroix and Amitrano, 2013; Riva et al., 2018). Thus, although they may occur during the monsoon season or an earthquake (Schwanghart et al., 2016), giant landslides may rather be controlled by the presence and evolution of geological and topographic features over longer timescales. Further characterization of the controls on and drivers of these giant slope failures should be a priority for future research.
We have estimated landslide erosion on timescales from years to 100 kyr, based on landslide inventories capturing the impact of monsoons and the 2015 Mw 7.9 Gorkha earthquake. Our estimates match independent constraints on erosion, on annual, millennial and geological timescales, confirming that bedrock landsliding can be the principal agent of erosion and sediment supply to rivers in the High Himalayas. Further, we have quantified the relative contribution of seismic and rainfall triggers and of frequent and small and rare and large landslides. We found that the absolute frequency distributions of landslides triggered by monsoon rainfall and earthquakes are heavy-tailed, causing rare, large landslides to dominate the long-term erosion budget. As a result, earthquakes may represent from 10 % of the long-term erosion budget, if the 2015 Gorkha earthquake is taken as representative of the long-term earthquake population, up to 50 %–60 % if other earthquakes commonly trigger larger landslides. The latter is likely, based on a consideration of paleo-seismological evidence and a physically based model of earthquake-induced landsliding. It also matches better the observed frequency of giant landslides and the long-term erosion rates from thermo-chronometric measurements.
We have found that the size distributions of monsoon-induced landslides are identical within error across the central Nepal Himalayas and also similar to the size distribution of landslides due to the Gorkha earthquake. This supports the idea that landslide size distributions are independent of the specific trigger (Malamud et al., 2004) and set by local topographic and substrate characteristics (Stark and Guzzetti, 2009, Frattini and Crosta, 2013), which appear to be relatively homogeneous throughout our 10 000 km2 study region. However, potential variations in size distributions with trigger properties (see Marc et al., 2016a, 2018; Valagussa et al., 2019) must be further evaluated as they may have a key influence on spatial and temporal variations in long-term landsliding and on the relative importance of earthquake and rainfall drivers in setting the Himalayan erosion budget.
Finally, the dominant contribution of large and giant landslides to the erosion budget means that erosion rates estimated on short to intermediate timescales from river load measurements and 10Be in sediment from small to medium size catchments are insufficient for a full understanding of long-term drivers of erosion. Only thermo-chronometric methods averaging over > 100 kyr capture erosion over sufficiently long timescales to be meaningfully compared to long-term controls of erosion such as climate and tectonics. In this context, our study highlights the urgent need to identify the primary controls on the location and frequency of giant landslides.
All landslide data produced through this study are available as text files (with each landslide area, perimeter, longitude, and latitude) in the Supplement of this article. Questions or request for shapefiles can be sent to the corresponding author. Satellite images are available online (see acknowledgements), except for the RapidEye imagery, and are listed in the supplementary tables.
The supplement related to this article is available online at: https://doi.org/10.5194/esurf-7-107-2019-supplement.
OM, RB, CA and NH designed the study. RB processed RapidEye imagery and ran the automatic classification. OM, RB and LI finalized landslide mapping. OM performed all other analyses. OM wrote the manuscript with input from all authors.
The authors declare that they have no conflict of interest.
This study was initiated shortly after the 2015 Gorkha earthquake with
GFZ-Potsdam HART (Hazard and Risk Team) support. Odin Marc was funded by the French
Space Agency (CNES) through the project STREAM-LINE GLIDERS “SaTellite-based
Rainfall Measurement and LandslIde detectioN for Global LandslIDE-Rainfall
Scaling”. Robert Behling was funded by the German Federal Ministry of Education and
Research through the project SaWaM (Seasonnal Water Management for Semiarid
Areas), grant no. 02WGR1421. The present study has used material from the RapidEye satellite imagery ©(2018) PlanetTM. All rights reserved. This imagery was provided on behalf of the German Aerospace Center through funding of the
German Federal Ministry of Economy and a RESA proposal (00165). Landsat
images are provided by the USGS through https://earthexplorer.usgs.gov/
(last access: : 5 September 2018). The authors gratefully used the global
GSMaP rainfall products provided by JAXA
(http://sharaku.eorc.jaxa.jp/GSMaP_crest/, last access:
20 September 2018).
Edited by: Xuanmei Fan
Reviewed by: Emmanuel Gabet and one anonymous referee
Abrahami, R., van der Beek, P., Huyghe, P., Hardwick, E., and Carcaillet, J.: Decoupling of long-term exhumation and short-term erosion rates in the Sikkim Himalaya, Earth Planet. Sc. Lett., 433, 76–88, https://doi.org/10.1016/j.epsl.2015.10.039, 2016.
Ali, K. F. and De Boer, D. H.: Spatial patterns and variation of sus-pended sediment yield in the upper Indus River basin, northern Pakistan, J. Hydrol., 334, 368–387, 2007.
Andermann, C., Crave, A., Gloaguen, R., Davy, P., and Bonnet, S.: Connecting source and transport: Suspended sediments in the Nepal Himalayas, Earth Planet. Sc. Lett., 351–352, 158–170, https://doi.org/10.1016/j.epsl.2012.06.059, 2012.
Avouac, J.-P.: From Geodetic Imaging of Seismic and Aseismic Fault Slip to Dynamic Modeling of the Seismic Cycle, Annu. Rev. Earth Pl. Sc., 43, 233–271, https://doi.org/10.1146/annurev-earth-060614-105302, 2015.
Avouac, J.-P., Meng, L., Wei, S., Wang, T., and Ampuero, J.-P.: Lower edge of locked Main Himalayan Thrust unzipped by the 2015 Gorkha earthquake, Nat. Geosci., 8, p. 708, https://doi.org/10.1038/ngeo2518, 2015.
Behling, R., Roessner, S., Kaufmann, H., and Kleinschmit, B.: Automated Spatiotemporal Landslide Mapping over Large Areas Using RapidEye Time Series Data, Remote Sens., 6, 8026–8055, https://doi.org/10.3390/rs6098026, 2014.
Behling, R., Roessner, S., Golovko, D., and Kleinschmit, B.: Derivation of long-term spatiotemporal landslide activity – A multi-sensor time series approach, Remote Sens. Environ., 186, 88–104, https://doi.org/10.1016/j.rse.2016.07.017, 2016.
Blodgett, T. A. and Isacks, B. L.: Landslide Erosion Rate in the Eastern Cordillera of Northern Bolivia, Earth Interact., 11, 1–30, https://doi.org/10.1175/2007EI222.1, 2007.
Blöthe, J. H. and Korup, O.: Millennial lag times in the Himalayan sediment routing system, Earth Planet. Sc. Lett., 382, 38–46, https://doi.org/10.1016/j.epsl.2013.08.044, 2013.
Bollinger, L., Sapkota, S. N., Tapponnier, P., Klinger, Y., Rizza, M., Van der Woerd, J., Tiwari, D. R., Pandey, R., Bitri, A., and Bes de Berc, S.: Estimating the return times of great Himalayan earthquakes in eastern Nepal: Evidence from the Patu and Bardibas strands of the Main Frontal Thrust, J. Geophys. Res.-Sol. Ea., 119, 7123–7163, https://doi.org/10.1002/2014JB010970, 2014.
Bollinger, L., Tapponnier, P., Sapkota, S. N., and Klinger, Y.: Slip deficit in central Nepal: omen for a repeat of the 1344 AD earthquake?, Earth Planets Space, 68, p. 12, https://doi.org/10.1186/s40623-016-0389-1, 2016.
Burbank, D. W., Leland, J., Fielding, E., Anderson, R. S., Brozovic, N., Reid, M. R., and Duncan, C.: Bedrock incision, rock uplift and threshold hillslopes in the northwestern Himalayas, Nature, 379, 505–510, https://doi.org/10.1038/379505a0, 1996.
Burbank, D. W., Blythe, A. E., Putkonen, J., Pratt-Sitaula, B., Gabet, E., Oskin, M., Barros, A., and Ojha, T. P.: Decoupling of erosion and precipitation in the Himalayas, Nature, 426, 652–655, https://doi.org/10.1038/nature02187, 2003.
Burtin, A., Hovius, N., Milodowski, D. T., Chen, Y.-G., Wu, Y.-M., Lin, C.-W., Chen, H., Emberson, R., and Leu, P.-L.: Continuous catchment-scale monitoring of geomorphic processes with a 2-D seismological array, J. Geophys. Res.-Earth, 118, 1956–1974, https://doi.org/10.1002/jgrf.20137, 2013.
Causse, M. and Song, S. G.: Are stress drop and rupture velocity of earthquakes independent? Insight from observed ground motion variability, Geophys. Res. Lett., 42, 7383–7389, https://doi.org/10.1002/2015GL064793, 2015.
Cenderelli, D. A. and Wohl, E. E.: Sedimentology and Clast Orientation of Deposits, produced by Glacial-Lake Outburst Floods in the Mount Everest Region, Nepal, in: Geomorphological Hazards in High Mountain Areas, edited by: Kalvoda, J. and Rosenfeld, C. L., 1–26, Springer Netherlands, Dordrecht, 1998.
Chakraborty, I., Ghosh, D. S., Bhattacharya, D., and Bora, A.: Earthquake induced landslides in the Sikkim-Darjeeling Himalayas – An aftermath of the 18 September 2011 Sikkim earthquake, Report of Geological Survey of India, Kolkata, 2011.
Chen, Y.-C., Chang, K., Chiu, Y.-J., Lau, S.-M., and Lee, H.-Y.: Quantifying rainfall controls on catchment-scale landslide erosion in Taiwan, Earth Surf. Proc. Land., 38, 372–382, https://doi.org/10.1002/esp.3284, 2013.
Clauset, A., Shalizi, C., and Newman, M.: Power-Law Distributions in Empirical Data, SIAM Rev., 51, 661–703, https://doi.org/10.1137/070710111, 2009.
Cook, K. L., Andermann, C., Gimbert, F., Adhikari, B. R., and Hovius, N.: Glacial lake outburst floods as drivers of fluvial erosion in the Himalaya, Science, 362, 53–57, https://doi.org/10.1126/science.aat4981, 2018.
Croissant, T., Lague, D., Steer, P., and Davy, P.: Rapid post-seismic landslide evacuation boosted by dynamic river width, Nat. Geosci., 10, 680, https://doi.org/10.1038/ngeo3005, 2017.
Dahal, R. K. and Hasegawa, S.: Representative rainfall thresholds for landslides in the Nepal Himalaya, Geomorphology, 100, 429–443, https://doi.org/10.1016/j.geomorph.2008.01.014, 2008.
Dingle, E. H., Sinclair, H. D., Attal, M., Rodés, Á., and Singh, V.: Temporal variability in detrital 10Be concentrations in a large Himalayan catchment, Earth Surf. Dynam., 6, 611–635, https://doi.org/10.5194/esurf-6-611-2018, 2018.
Domej, G., Bourdeau, C., and Lenti, L.: Mean Landslide Geometries Inferred from a Global Database of Earthquake- and Non-Earthquake-Triggered Landslides, Italian Journal of Engineering Geology and Environment, 17, 87–107, https://doi.org/10.4408/IJEGE.2017-02.O-05, 2017.
Fort, M.: Two large late Quaternary rock slope failures and their geomorphic significance, Annapurna Himalayas (Nepal), Geogr. Fis. Din. Quat., 34, 5–14, 2011.
Fox, M., Herman, F., Willett, S. D., and Schmid, S. M.: The Exhumation history of the European Alps inferred from linear inversion of thermochronometric data, Am. J. Sci., 316, 505–541, https://doi.org/10.2475/06.2016.01, 2016.
Frattini, P. and Crosta, G. B.: The role of material properties and landscape morphology on landslide size distributions, Earth Planet. Sc. Lett., 361, 310–319, 2013
Gabet, E. J., Burbank, D. W., Putkonen, J. K., Pratt-Sitaula, B. A., and Ojha, T.: Rainfall thresholds for landsliding in the Himalayas of Nepal, Geomorphology, 63, 131–143, https://doi.org/10.1016/j.geomorph.2004.03.011, 2004.
Gabet, E. J., Burbank, D. W., Pratt-Sitaula, B., Putkonen, J., and Bookhagen, B.: Modern erosion rates in the High Himalayas of Nepal, Earth Planet. Sc. Lett., 267, 482–494, https://doi.org/10.1016/j.epsl.2007.11.059, 2008.
Gallo, F. and Lavé, J.: Evolution of a large landslide in the High Himalaya of central Nepal during the last half-century, Geomorphology, 223, 20–32, https://doi.org/10.1016/j.geomorph.2014.06.021, 2014.
Godard, V., Burbank, D. W., Bourlès, D. L., Bookhagen, B., Braucher, R., and Fisher, G. B.: Impact of glacial erosion on 10Be concentrations in fluvial sediments of the Marsyandi catchment, central Nepal, J. Geophys. Res.-Earth, 117, https://doi.org/10.1029/2011JF002230, 2012.
Godard, V., Bourlès, D. L., Spinabella, F., Burbank, D. W., Bookhagen, B., Fisher, G. B., Moulin, A., and Léanni, L.: Dominance of tectonics over climate in Himalayan denudation, Geology, 42, 243–246, https://doi.org/10.1130/G35342.1, 2014.
Heimsath, A. M. and McGlynn, R.: Quantifying periglacial erosion in the Nepal high Himalaya, Geomorphology, 97, 5–23, https://doi.org/10.1016/j.geomorph.2007.02.046, 2008.
Herman, F., Copeland, P., Avouac, J.-P., Bollinger, L., Mahéo, G., Le Fort, P., Rai, S., Foster, D., Pêcher, A., Stüwe, K., and Henry, P.: Exhumation, crustal deformation, and thermal structure of the Nepal Himalaya derived from the inversion of thermochronological and thermobarometric data and modeling of the topography, J. Geophys. Res., 115, https://doi.org/10.1029/2008JB006126, 2010.
Hovius, N., Stark, C. P., and Allen, P. A.: Sediment flux from a mountain belt derived by landslide mapping, Geology, 25, 231–234, https://doi.org/10.1130/0091-7613(1997)025<0231:SFFAMB>2.3.CO;2, 1997.
Hovius, N., Stark, C. P., Chu H.-T., and Lin J.-C.: Supply and Removal of Sediment in a Landslide-Dominated Mountain Belt: Central Range, Taiwan, J. Geol., 108, 73–89, https://doi.org/10.1086/jg.2000.108.issue-1, 2000.
Iverson, R. M.: Landslide triggering by rain infiltration, Water Resour. Res., 36, 1897–1910, https://doi.org/10.1029/2000WR900090, 2000.
Keefer, D. K.: Landslides caused by earthquakes, Geol. Soc. Am. Bull., 95, 397–405, 1984.
Kirchner, J. W., Finkel, R. C., Riebe, C. S., Granger, D. E., Clayton, J. L., King, J. G., and Megahan, W. F.: Mountain erosion over 10 yr, 10 ky, and 10 my time scales, Geology, 29, 591–594, 2001.
Korup, O., Clague, J. J., Hermanns, R. L., Hewitt, K., Strom, A. L., and Weidinger, J. T.: Giant landslides, topography, and erosion, Earth Planet. Sc. Lett., 261, 578–589, https://doi.org/10.1016/j.epsl.2007.07.025, 2007.
Kubota, T., Shige, S., Hashizume, H., Ushio, T., Aonashi, K., Kachi, M., and Okamoto, K.: Global Precipitation Map using Satelliteborne Microwave Radiometers by the GSMaP Project?: Production and Validation, in 2006 IEEE MicroRad, 290–295, 2006.
Lacroix, P. and Amitrano, D.: Long-term dynamics of rockslides and damage propagation inferred from mechanical modeling: Long-term dynamics of rockslides, J. Geophys. Res.-Earth, 118, 2292–2307, https://doi.org/10.1002/2013JF002766, 2013.
Landry, K. R., Coutand, I., Whipp, D. M., Grujic, D., and Hourigan, J. K.: Late Neogene tectonically driven crustal exhumation of the Sikkim Himalaya: Insights from inversion of multithermochronologic data, Tectonics, 35, 831–857, https://doi.org/10.1002/2015TC004102, 2016.
Larsen, I. J., Montgomery, D. R., and Korup, O.: Landslide erosion controlled by hillslope material, Nat. Geosci., 3, 247–251, 2010.
Lave, J., Lénard, S., and Lanord, C. F.: Giant landslide deposits and the modalities of their removal by ?uvial sediment export in the central Himalayas, vol. 19, EGU2017-13537, Vienna, 2017.
Li, Gen and West, A Joshua and Densmore, Alexander L and Jin, Zhangdong and Zhang, Fei and Wang, Jin and Clark, Marin and Hilton, Robert G.: Earthquakes drive focused denudation along a tectonically active mountain front, Earth Planet. Sc. Lett., 472, 253–265, 2017.
Lupker, M., Blard, P.-H., Lavé, J., France-Lanord, C., Leanni, L., Puchol, N., Charreau, J., and Bourlès, D.: 10Be-derived Himalayan denudation rates and sediment budgets in the Ganga basin, Earth Planet. Sc. Lett., 333–334, 146–156, https://doi.org/10.1016/j.epsl.2012.04.020, 2012.
Malamud, B. D., Turcotte, D. L., Guzzetti, F., and Reichenbach, P.: Landslide inventories and their statistical properties, Earth Surf. Proc. Land., 29, 687–711, https://doi.org/10.1002/esp.1064, 2004.
Marc, O. and Hovius, N.: Amalgamation in landslide maps: effects and automatic detection, Nat. Hazards Earth Syst. Sci., 15, 723–733, https://doi.org/10.5194/nhess-15-723-2015, 2015.
Marc, O., Hovius, N., Meunier, P., Uchida, T., and Hayashi, S.: Transient changes of landslide rates after earthquakes, Geology, 43, 883–886, https://doi.org/10.1130/G36961.1, 2015.
Marc, O., Hovius, N., Meunier, P., Gorum, T., and Uchida, T.: A seismologically consistent expression for the total area and volume of earthquake-triggered landsliding, J. Geophys. Res.-Earth, 121, 640–663, https://doi.org/10.1002/2015JF003732, 2016a.
Marc, O., Hovius, N., and Meunier, P.: The mass balance of earthquakes and earthquake sequences, Geophys. Res. Lett., 43, 3708–3716, https://doi.org/10.1002/2016GL068333, 2016b.
Marc, O., Meunier, P., and Hovius, N.: Prediction of the area affected by earthquake-induced landsliding based on seismological parameters, Nat. Hazards Earth Syst. Sci., 17, 1159–1175, https://doi.org/10.5194/nhess-17-1159-2017, 2017.
Marc, O., Stumpf, A., Malet, J.-P., Gosset, M., Uchida, T., and Chiang, S.-H.: Initial insights from a global database of rainfall-induced landslide inventories: the weak influence of slope and strong influence of total storm rainfall, Earth Surf. Dynam., 6, 903–922, https://doi.org/10.5194/esurf-6-903-2018, 2018.
Martha, T. R., Roy, P., Mazumdar, R., Govindharaj, K. B., and Kumar, K. V.: Spatial characteristics of landslides triggered by the 2015 Mw 7.8 (Gorkha) and Mw 7.3 (Dolakha) earthquakes in Nepal, Landslides, 14, 697–704, https://doi.org/10.1007/s10346-016-0763-x, 2016.
Mathur, L.: Assam Earthquake of 15 August 1950, a short note on factual observations, in A compilation of papers on the Assam earthquake of August, 15, 1950, vol. 1, 56–60, The Central Board of Geophysical Publisher, National Geophysical Research Institute, Hyderabad, India, 1953.
Meunier, P., Hovius, N., and Haines, A. J.: Regional patterns of earthquake-triggered landslides and their relation to ground motion, Geophys. Res. Lett., 34, L20408, https://doi.org/10.1029/2007GL031337, 2007.
Meunier, P., Uchida, T., and Hovius, N.: Landslide patterns reveal the sources of large earthquakes, Earth Planet. Sc. Lett., 363, 27–33, https://doi.org/10.1016/j.epsl.2012.12.018, 2013.
Milledge, David G. and Bellugi, Dino and McKean, Jim A. and Densmore, Alexander L. and Dietrich, William E.: A multidimensional stability model for predicting shallow landslide size and shape across landscapes, J. Geophys. Res.-Earth, 119, 2481–2504, https://doi.org/10.1002/2014JF003135, 2014.
Morin, G., Lavé, J., France-Lanord, C., Rigaudier, T., Gajurel, A. P., and Sinha, R.: Annual sediment transport dynamics in the Narayani basin, Central Nepal: assessing the impacts of erosion processes in the annual sediment budget, J. Geophys. Res.-Earth, 123, 2341–2376, https://doi.org/10.1029/2017JF004460, 2018.
Mugnier, J.-L., Gajurel, A., Huyghe, P., Jayangondaperumal, R., Jouanne, F., and Upreti, B.: Structural interpretation of the great earthquakes of the last millennium in the central Himalaya, Earth-Sci. Rev., 127, 30–47, https://doi.org/10.1016/j.earscirev.2013.09.003, 2013.
Niemi, N. A., Oskin, M., Burbank, D. W., Heimsath, A. M., and Gabet, E. J.: Effects of bedrock landslides on cosmogenically determined erosion rates, Earth Planet. Sc. Lett., 237, 480–498, https://doi.org/10.1016/j.epsl.2005.07.009, 2005.
Portenga, E. W., Bierman, P. R., Duncan, C., Corbett, L. B., Kehrwald, N. M., and Rood, D. H.: Erosion rates of the Bhutanese Himalaya determined using in situ-produced 10Be, Geomorphology, 233, 112–126, https://doi.org/10.1016/j.geomorph.2014.09.027, 2015.
Pratt, B., Burbank, D. W., Heimsath, A., and Ojha, T.: Impulsive alluviation during early Holocene strengthened monsoons, central Nepal Himalaya, Geology, 30, 911–914, https://doi.org/10.1130/0091-7613(2002)030<0911:IADEHS>2.0.CO;2, 2002.
Pratt-Sitaula, B., Burbank, D. W., Heimsath, A., and Ojha, T.: Landscape disequilibrium on 1000–10 000 year scales Marsyandi River, Nepal, central Himalaya, Geomorphology, 58, 223–241, https://doi.org/10.1016/j.geomorph.2003.07.002, 2004.
Pratt-Sitaula, B., Garde, M., Burbank, D. W., Oskin, M., Heimsath, A., and Gabet, E.: Bedload-to-suspended load ratio and rapid bedrock incision from Himalayan landslide-dam lake record, Quaternary Res., 68, 111–120, https://doi.org/10.1016/j.yqres.2007.03.005, 2007.
Rao, S. V. N., Rao, M. V., and Ramasasitri, K. S.: A Study of Sedimentation in Chenab Basin in Western Himalayas, Nord. Hydrol., 28, 201–216, 1997.
RGI Consortium: Randolph glacier inventory (RGI) – a dataset of global glacier outlines: version 6.0, Global Land Ice Measurements from Space, Boulder, https://doi.org/10.7265/N5-RGI-60, 2017.
Riva, F., Agliardi, F., Amitrano, D., and Crosta, G. B.: Damage-Based Time-Dependent Modeling of Paraglacial to Postglacial Progressive Failure of Large Rock Slopes, J. Geophys. Res.-Earth, 123, 124–141, https://doi.org/10.1002/2017JF004423, 2018.
Roback, K., Clark, M. K., West, A. J., Zekkos, D., Li, G., Gallen, S. F., Chamlagain, D., and Godt, J. W.: The size, distribution, and mobility of landslides caused by the 2015 Mw 7.8 Gorkha earthquake, Nepal, Geomorphology, 301, 121–138, https://doi.org/10.1016/j.geomorph.2017.01.030, 2018.
Ruhl, K. W. and Hodges, K. V.: The use of detrital mineral cooling ages to evaluate steady state assumptions in active orogens: An example from the central Nepalese Himalaya, Tectonics, 24, https://doi.org/10.1029/2004TC001712, 2005.
Saito, H., Korup, O., Uchida, T., Hayashi, S., and Oguchi, T.: Rainfall conditions, typhoon frequency, and contemporary landslide erosion in Japan, Geology, 42, 999–1002, https://doi.org/10.1130/G35680.1, 2014.
Sato, H. P., Hasegawa, H., Fujiwara, S., Tobita, M., Koarai, M., Une, H., and Iwahashi, J.: Interpretation of landslide distribution triggered by the 2005 Northern Pakistan earthquake using SPOT 5 imagery, Landslides, 4, 113–122, https://doi.org/10.1007/s10346-006-0069-5, 2007.
Scherler, D., Bookhagen, B., and Strecker, M. R.: Tectonic control on 10Be-derived erosion rates in the Garhwal Himalaya, India, J. Geophys. Res.-Earth, 119, 83–105, https://doi.org/10.1002/2013JF002955, 2014.
Schildgen, T. F., Beek, P. A., van der, Sinclair, H. D., and Thiede, R. C.: Spatial correlation bias in late-Cenozoic erosion histories derived from thermochronology, Nature, 559, 89–93, https://doi.org/10.1038/s41586-018-0260-6, 2018.
Schwanghart, W., Bernhardt, A., Stolle, A., Hoelzmann, P., Adhikari, B. R., Andermann, C., Tofelde, S., Merchel, S., Rugel, G., Fort, M., and Korup, O.: Repeated catastrophic valley infill following medieval earthquakes in the Nepal Himalaya, Science, 351, 147–150, https://doi.org/10.1126/science.aac9865, 2016.
Stark, C. P. and Guzzetti, F.: Landslide rupture and the probability distribution of mobilized debris volumes, J. Geophys. Res., 114, F00A02, https://doi.org/10.1029/2008JF001008, 2009.
Stark, C. P. and Hovius, N.: The characterization of landslide size distributions, Geophys. Res. Lett., 28, 1091–1094, https://doi.org/10.1029/2000GL008527, 2001.
Stevens, V. L. and Avouac, J.-P.: Millenary Mw > 9.0 earthquakes required by geodetic strain in the Himalaya, Geophys. Res. Lett., 43, 1118–1123, https://doi.org/10.1002/2015GL067336, 2016.
Stolle, A., Bernhardt, A., Schwanghart, W., Hoelzmann, P., Adhikari, B. R., Fort, M., and Korup, O.: Catastrophic valley fills record large Himalayan earthquakes, Pokhara, Nepal, Quaternary Sci. Rev., 177, 88–103, https://doi.org/10.1016/j.quascirev.2017.10.015, 2017.
Stolle, A., Schwanghart, W., Andermann, C., Bernhardt, A., Fort, M., Jansen, J. D., Wittmann, H., Merchel, S., Rugel, G., Adhikari, B. R., and Korup, O.: Protracted river response to medieval earthquakes, Earth Surf. Proc. Land., 44, 331–341, https://doi.org/10.1002/esp.4517, 2019.
Struck, M., Andermann, C., Hovius, N., Korup, O., Turowski, J. M., Bista, R., Pandit, H. P., and Dahal, R. K.: Monsoonal hillslope processes determine grain size-specific suspended sediment fluxes in a trans-Himalayan river: Mass wasting determines sediment caliber, Geophys. Res. Lett., 42, 2302–2308, https://doi.org/10.1002/2015GL063360, 2015.
Tanyaş, H., van Westen, C. J., Allstadt, K. E., Anna Nowicki Jessee, M., Görüm, T., Jibson, R. W., Godt, J. W., Sato, H. P., Schmitt, R. G., Marc, O., and Hovius, N.: Presentation and Analysis of a Worldwide Database of Earthquake-Induced Landslide Inventories, J. Geophys. Res.-Earth, 122, 1991–2015, https://doi.org/10.1002/2017JF004236, 2017.
Thiede, R. C. and Ehlers, T. A.: Large spatial and temporal variations in Himalayan denudation, Earth Planet. Sc. Lett., 371–372, 278–293, https://doi.org/10.1016/j.epsl.2013.03.004, 2013.
Ushio, T., Sasashige, K., Kubota, T., Shige, S., Okamoto, K., Aonashi, K., Inoue, T., Takahashi, N., Iguchi, T., Kachi, M., Oki, R., Morimoto, T., and Kawasaki, Z.-I.: A Kalman Filter Approach to the Global Satellite Mapping of Precipitation (GSMaP) from Combined Passive Microwave and Infrared Radiometric Data, J. Meteorol. Soc. Jpn., 87A, 137–151, https://doi.org/10.2151/jmsj.87A.137, 2009.
Van Asch, T. W. J., Buma, J., and Van Beek, L. P. H.: A view on some hydrological triggering systems in landslides, Geomorphology, 30, 25–32, https://doi.org/10.1016/S0169-555X(99)00042-2, 1999.
Vance, D., Bickle, M., Ivy-Ochs, S., and Kubik, P. W.: Erosion and exhumation in the Himalaya from cosmogenic isotope inventories of river sediments, Earth Planet. Sc. Lett., 206, 273–288, https://doi.org/10.1016/S0012-821X(02)01102-0, 2003.
Valagussa, A., Marc, O., Frattini, P., and Crosta, G. B.: Seismic and geological controls on earthquake-induced landslide size, Earth Planet. Sc. Lett., 506, 268–281, https://doi.org/10.1016/j.epsl.2018.11.005, 2019.
Weidinger, J. T.: Predesign, failure and displacement mechanisms of large rockslides in the Annapurna Himalayas, Nepal, Eng. Geol., 83, 201–216, https://doi.org/10.1016/j.enggeo.2005.06.032, 2006.
Weidinger, J. T.: Stability and Life Span of Landslide Dams in the Himalayas (India, Nepal) and the Qin Ling Mountains (China), in: Natural and Artificial Rockslide Dams, edited by: Evans, S. G., Hermanns, R. L., Strom, A., and Scarascia-Mugnozza, G., 243–277, Springer Berlin Heidelberg, Berlin, Heidelberg, 2011.
Weidinger, J. T. and Korup, O.: Frictionite as evidence for a large Late Quaternary rockslide near Kanchenjunga, Sikkim Himalayas, India – Implications for extreme events in mountain relief destruction, Geomorphology, 103, 57–65, https://doi.org/10.1016/j.geomorph.2007.10.021, 2009.
Weidinger, J. T., Schramm, J.-M., and Nuschej, F.: Ore mineralization causing slope failure in a high-altitude mountain crest – on the collapse of an 8000 m peak in Nepal, J. Asian Earth Sci., 21, 295–306, https://doi.org/10.1016/S1367-9120(02)00080-9, 2002.
Whipp, D. M., Ehlers, T. A., Blythe, A. E., Huntington, K. W., Hodges, K. V., and Burbank, D. W.: Plio-Quaternary exhumation history of the central Nepalese Himalaya: 2. Thermokinematic and thermochronometer age prediction model, Tectonics, 26, https://doi.org/10.1029/2006TC001991, 2007.
Wobus, C., Heimsath, A., Whipple, K., and Hodges, K.: Active out-of-sequence thrust faulting in the central Nepalese Himalaya, Nature, 434, 1008–1011, https://doi.org/10.1038/nature03499, 2005.
Wobus, C. W., Whipple, K. X., and Hodges, K. V.: Neotectonics of the central Nepalese Himalaya: Constraints from geomorphology, detrital 40Ar∕39Ar thermochronology, and thermal modeling, Tectonics, 25, https://doi.org/10.1029/2005TC001935, 2006.
Wulf, H., Bookhagen, B., and Scherler, D.: Climatic and geologic controls on suspended sediment flux in the Sutlej River Valley, western Himalaya, Hydrol. Earth Syst. Sci., 16, 2193–2217, https://doi.org/10.5194/hess-16-2193-2012, 2012.
Yanites, B. J., Tucker, G. E., and Anderson, R. S.: Numerical and analytical models of cosmogenic radionuclide dynamics in landslide-dominated drainage basins, J. Geophys. Res., 114, https://doi.org/10.1029/2008JF001088, 2009.
Yatagai, A., Kamiguchi, K., Arakawa, O., Hamada, A., Yasutomi, N., and Kitoh, A.: APHRODITE: Constructing a Long-Term Daily Gridded Precipitation Dataset for Asia Based on a Dense Network of Rain Gauges, B. Am. Meteorol. Soc., 93, 1401–1415, https://doi.org/10.1175/BAMS-D-11-00122.1, 2012
Zech, R., Zech, M., Kubik, P. W., Kharki, K., and Zech, W.: Deglaciation and landscape history around Annapurna, Nepal, based on 10Be surface exposure dating, Quaternary Sci. Rev., 28, 1106–1118, https://doi.org/10.1016/j.quascirev.2008.11.013, 2009.