the Creative Commons Attribution 4.0 License.
the Creative Commons Attribution 4.0 License.
 | 26 Aug 2019
A global delta dataset and the environmental variables that predict delta formation on marine coastlines
Rebecca L. Caldwell
Douglas A. Edmonds
Sarah Baumgardner
Chris Paola
Samapriya Roy
Jaap H. Nienhuis
River deltas are sites of sediment accumulation along the coastline that form critical biological habitats, host megacities, and contain significant quantities of hydrocarbons. Despite their importance, we do not know which factors most significantly promote sediment accumulation and dominate delta formation. To investigate this issue, we present a global dataset of 5399 coastal rivers and data on eight environmental variables. Of these rivers, 40 % (n=2174) have geomorphic deltas defined either by a protrusion from the regional shoreline, a distributary channel network, or both. Globally, coastlines average one delta for every ∼300 km of shoreline, but there are hotspots of delta formation, for example in Southeast Asia where there is one delta per 100 km of shoreline. Our analysis shows that the likelihood of a river to form a delta increases with increasing water discharge, sediment discharge, and drainage basin area. On the other hand, delta likelihood decreases with increasing wave height and tidal range. Delta likelihood has a non-monotonic relationship with receiving-basin slope: it decreases with steeper slopes, but for slopes >0.006 delta likelihood increases. This reflects different controls on delta formation on active versus passive margins. Sediment concentration and recent sea level change do not affect delta likelihood. A logistic regression shows that water discharge, sediment discharge, wave height, and tidal range are most important for delta formation. The logistic regression correctly predicts delta formation 74 % of the time. Our global analysis illustrates that delta formation and morphology represent a balance between constructive and destructive forces, and this framework may help predict tipping points at which deltas rapidly shift morphologies.
- Article
(2716 KB) - Full-text XML
-
Supplement
(568 KB) - BibTeX
- EndNote


Deltas provide a variety of ecosystem services, such as carbon sequestration and nitrate removal (Rovai et al., 2018; Twilley et al., 2018), and they provide a home to close to half a billion people (Syvitski and Saito, 2007) living within large agricultural and urban centers (Woodroffe et al., 2006). Deltas form at river mouths where fluvial sediment accumulates nearshore long enough for the deposit to become subaerial. This simple view of delta formation is a statement of sediment mass balance; understanding where deltas form requires knowing how and why sediment accumulates. Sediment accumulates provided it is supplied and deposited at the coast faster than it is removed. Sediment supply and removal are chiefly determined by the river, waves, tides, rate of relative sea level change, and offshore bathymetry. To complicate matters, most of these variables can be both sources and sinks of sediment, and their exact roles in the deltaic sediment mass balance remain uncertain. Previous research suggests that rivers are almost always sources (Bates, 1953; Coleman, 1976; Wright, 1977; Syvitski et al., 2005; Syvitski and Saito, 2007). The roles of waves and tides are largely ambiguous (Nienhuis et al., 2015; Hoitink et al., 2017; Lentsch et al., 2018), though there is some evidence to suggest waves are mainly sediment sinks in the delta formation process (Fisher, 1969; Anthony, 2015). The bathymetric characteristics of the offshore basin determine the nearshore hydrodynamics, wave power, and structure of the turbulent jet, which in turn influences sediment deposition patterns and delta formation (Fagherazzi et al., 2015; Jiménez-Robles et al., 2016). Sea level is also an important part of delta formation, and we know that slower rates of sea level rise promote delta formation (Stanley and Warne, 1994; Porebski and Steel, 2006; Paola et al., 2011).
Despite these efforts, we do not fully understand how these different controls combine to create river deltas. We know the conditions for delta formation are not easily met – pick nearly any marine shoreline on Earth and of the river mouths that intersect the coast, only some will have a delta. Previous studies on delta formation (Wright et al., 1974; Audley-Charles et al., 1977; Milliman and Syvitski, 1992; Syvitski and Saito, 2007; Nyberg and Howell, 2016) focused on large-scale patterns and concluded that major modern delta locations are influenced largely by tectonic margin type and drainage patterns. While useful, these datasets were biased toward the largest and most populated deltas. Expanding the prediction effort to deltas of all sizes is a logical next step, especially because smaller deltas are thought to be more resilient to rising sea levels (Giosan et al., 2014).
In addition to expanding the range of delta sizes to understand the controls on delta formation, we need to consider cases in which delta formation is suppressed. In this paper we investigate why some rivers form deltas and others do not. Understanding conditions for modern delta formation should also help exploration for ancient deltaic deposits, which requires predicting where deltas might form under past environmental conditions (Nyberg and Howell, 2016). Similarly, as research moves toward delta risk assessment due to global environmental change (Tessler et al., 2015) and improving efforts to build new deltaic land (Kim et al., 2009), we must understand how different environmental variables govern delta formation. For example, understanding the conditions for delta formation would help restoration efforts that seek to build new deltaic land in places like the Mississippi River Delta (Paola et al., 2011; Edmonds, 2012; Twilley et al., 2016).
To address these issues, we developed a global dataset that includes the locations of 5399 coastal rivers, information on whether they form deltas or not, and the environmental variables that could influence delta formation. We use global datasets of coastlines (Dürr et al., 2011; Nyberg and Howell, 2016), sediment and water (Syvitski and Milliman, 2007; Milliman and Farnsworth, 2011), wave climate hindcasts (Tolman, 2009; Chawla et al., 2013), a tidal inversion model (Egbert and Erofeeva, 2002), ocean bathymetry data (Amante and Eakins, 2009), and the rate of sea level change (https://www.aviso.altimetry.fr, last access: 11 August 2018). We use modern values of these environmental variables under the assumption that present-day delta formation has adapted to current conditions. Of the 5399 included rivers, 2174 form geomorphic deltas that are visible in aerial imagery, defined either by a protrusion from the regional shoreline, a distributary channel network, or both. We use statistical relationships between independent environmental variables and the presence or absence of a delta to determine what controls the likelihood of a river to form a delta.
2.1 Identifying river deltas
River deltas are fundamentally systems of sediment accumulation and distribution at the coastline. Accordingly, we identify coastal deltas by distinguishing geomorphic expressions of sediment accumulation and distribution at locations where rivers meet the coast. We consider a river to have formed a delta at the coastline if the river-mouth area contains an active or relict distributary network (Fig. 1e), ends in a subaerial depositional protrusion from the lateral shoreline (Fig. 1d), or does both (Fig. 1c). Distributary networks are an expression of sediment deposition and distribution (Edmonds et al., 2011) and we identify them by the presence of one or more channels that bifurcate and intersect the coast at different locations. We include relict channels, where they are clearly visible in imagery and connect to the main channel, because they are evidence of sediment distribution and accumulation through avulsion (Slingerland and Smith, 2004). We do not include channels that bifurcate solely around non-deltaic topographic highs. Our second criterion is oceanward-directed shoreline protrusions. We classify a protrusion as deltaic if it has a relatively smooth depositional shoreline, as opposed to rough shorelines associated with rocky coasts (Limber et al., 2014), and if it extends more than approximately five channel widths oceanward relative to the position of the regional shoreline. We map only protrusions that are associated with the river, ignoring protrusions that may exist near the channel mouth that we judge to be preexisting undulations in the shoreline. Examples of this include promontories associated with preexisting geology or depositional protrusions created by other processes, such as wave-driven sediment transport (Ashton et al., 2001). Our delta identification method does not account for deltaic deposition with no geomorphic signature, such as a single-channel delta infilling a drowned valley that produces no protrusion from the regional shoreline. Although such features may be considered deltaic, we cannot unambiguously identify them as deltas based on aerial imagery alone and we do not include them in the dataset.
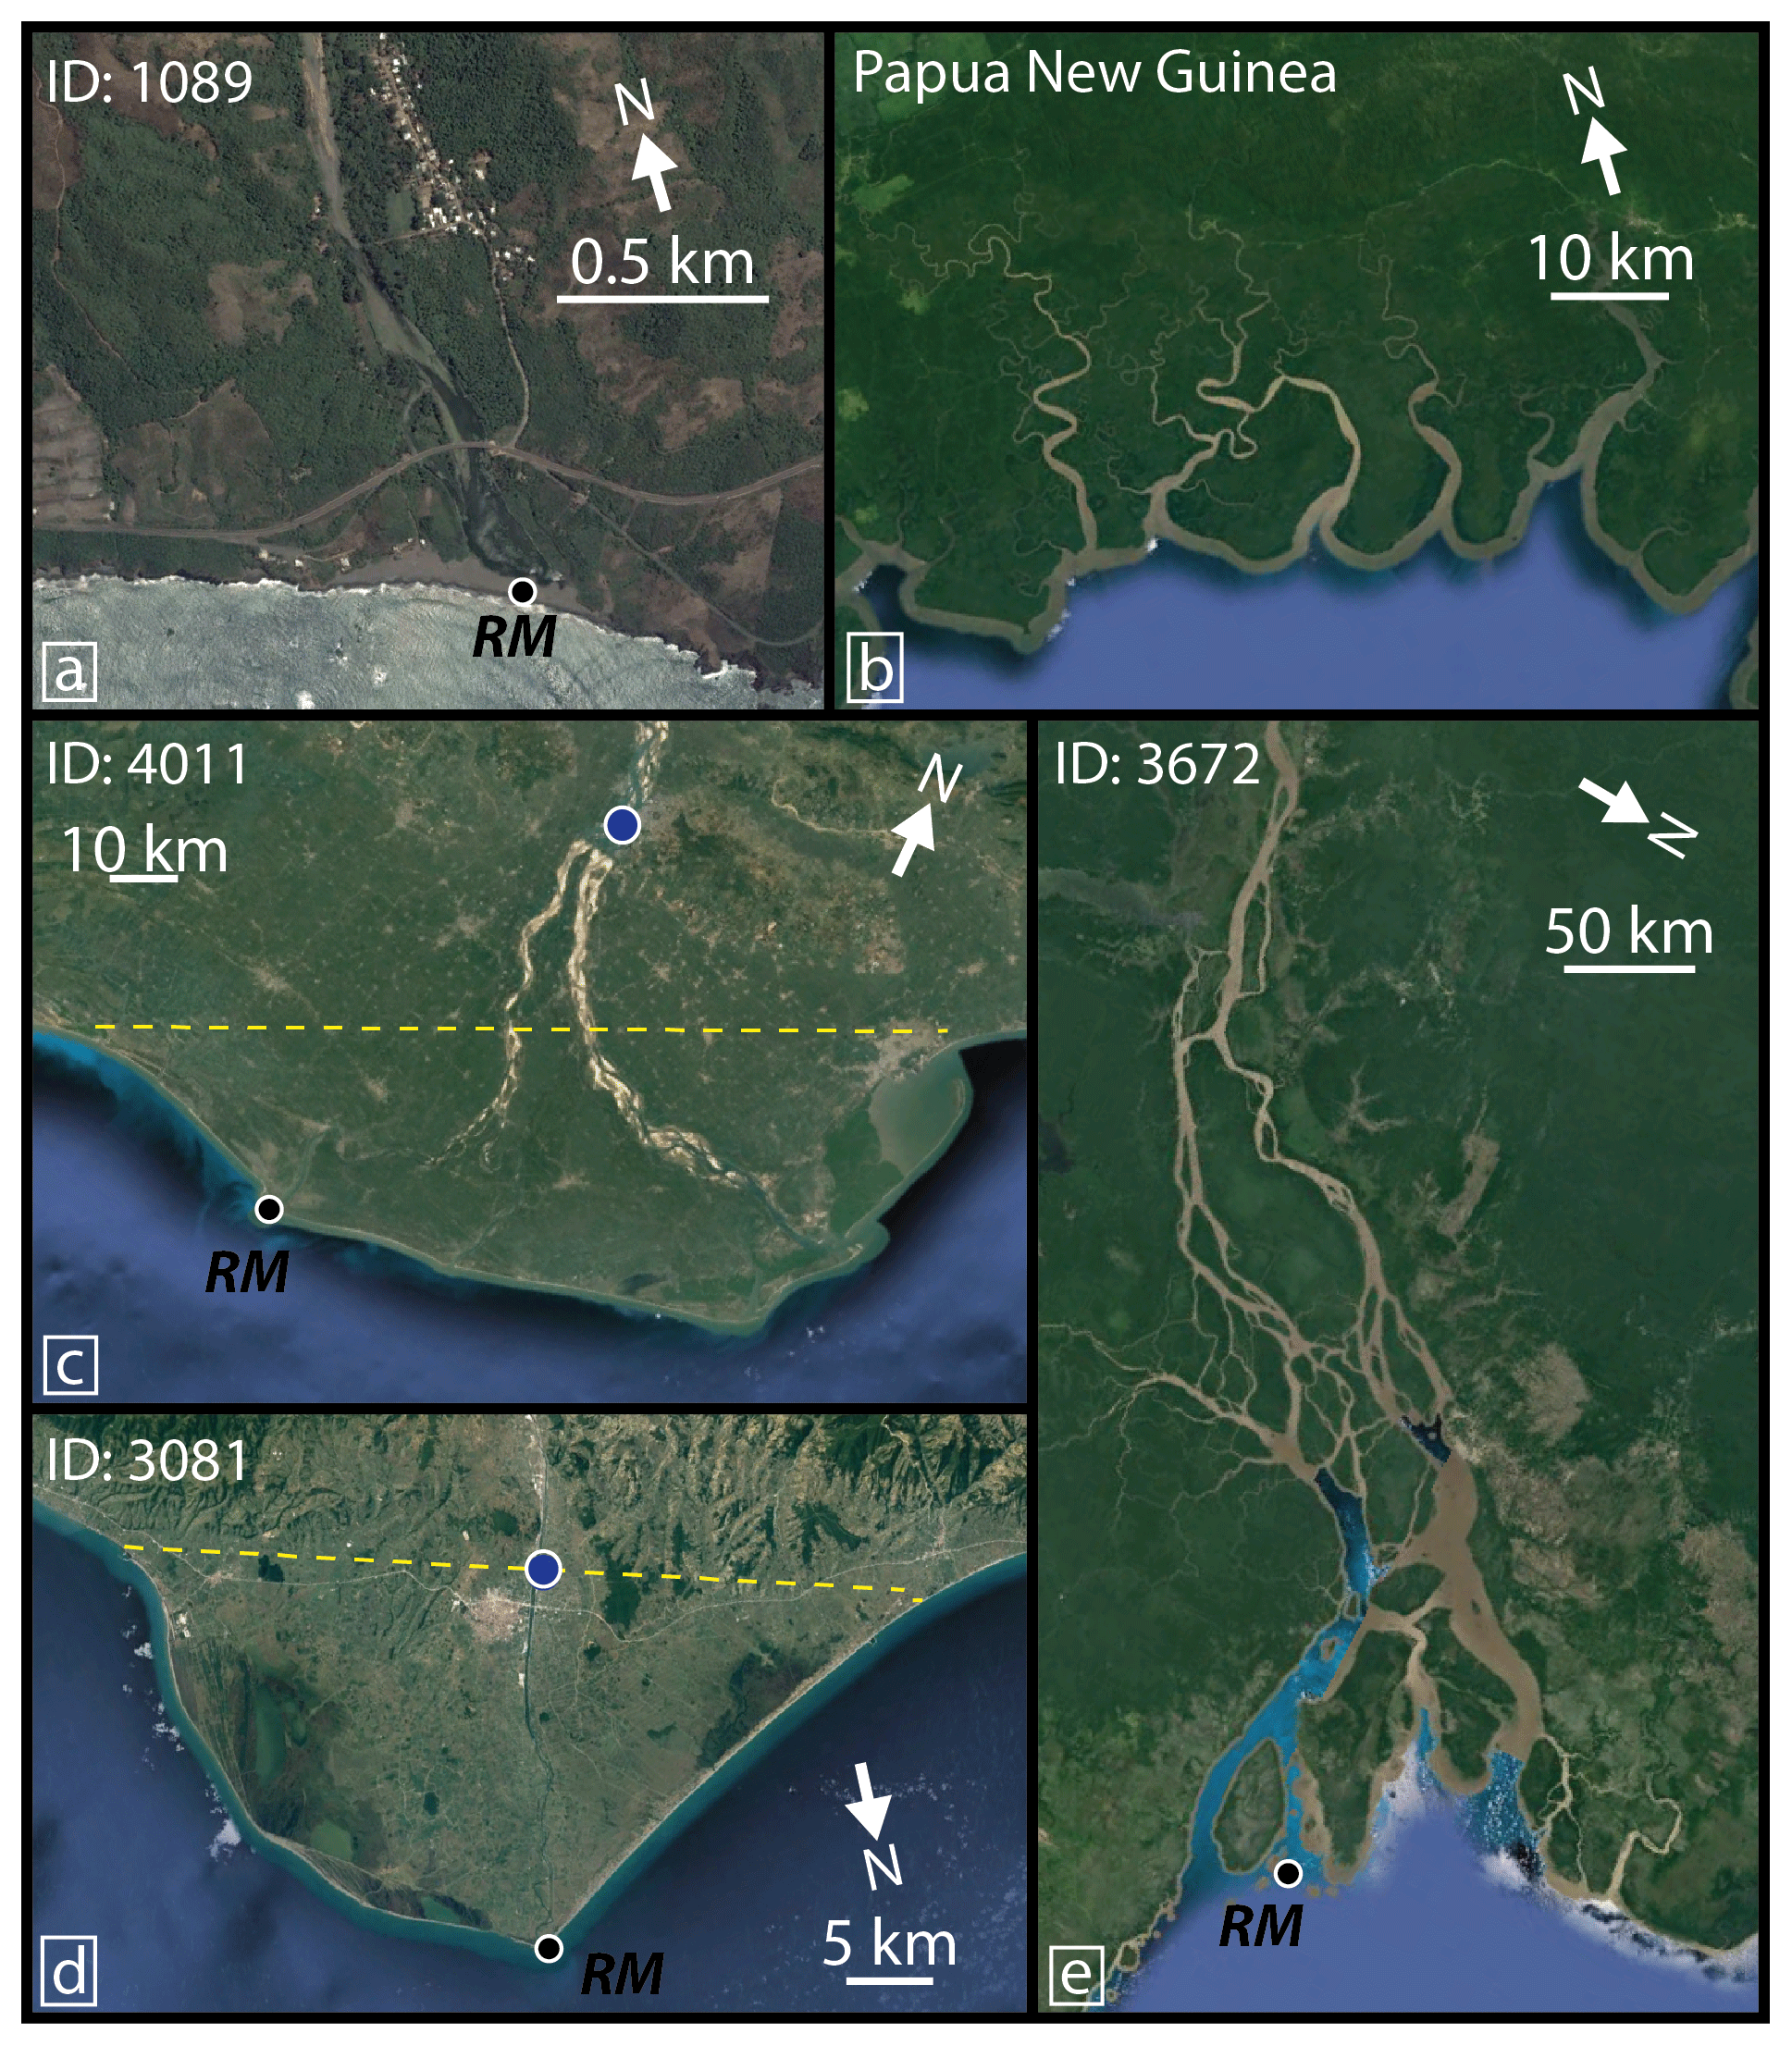
Figure 1Examples of (a) a river mouth without a delta (Mexico), (b) headless tidal channels not included in this dataset, (c) a delta with land both upstream and downstream of the regional shoreline vector (marked by dashed line – location of delta node demarcated with blue dot; Godavari River, India), (d) a delta distinguished by a shoreline protrusion only (Red River, Turkey), and (e) a delta distinguished by a distributary channel network only. RM locations mark the main river channel mouth (Amazon River, South America). Map data: ©Google and DigitalGlobe.
We applied the preceding criteria to a scan of marine coastlines, including most open-ocean coasts and the Black Sea, using Google Earth. First, we identified all rivers with width >50 m reaching the coast that are connected to an upstream catchment (Fig. 1a, c–e). Channels not clearly connected to an upstream catchment, such as tidal channels, were not included in the dataset (Fig. 1b). This was done to restrict the study to coastal depositional landforms that represent the interaction of upstream and downstream environmental variables. We selected rivers at least 50 m in width because they have corresponding data, such as basin area, that can be reliably determined on coarser-resolution elevation models. This width designation was applied to the river bankfull widths and thus includes any visible mid-channel bars. Channel widths on rivers without a delta were measured at the shoreline or upstream from visible marine influence, such as significant tidal widening (Nienhuis et al., 2018). If a river empties into a gradually widening estuary or embayment, we measured the channel width where it is devoid of a significant downstream widening and thus representative of the river. Channel widths on rivers that have deltas were measured immediately upstream of the delta node, which we define as the location of the most upstream bifurcation. If no bifurcation exists, we use the intersection of the main channel with the regional shoreline (e.g., Fig. 1c and d, blue dot). In all cases, channel widths were not measured in areas of clear human influence. This includes, for example, man-made levees that can cause artificial widening or narrowing of channels.
We mapped rivers and deltas on the coastlines of Earth's continents and large islands (Fig. 2). We exclude small islands where rivers large enough for inclusion are rare and it is difficult to obtain environmental data. Thus, large islands, such as Papua New Guinea and Fiji, were included but not all the associated smaller islands. Coastlines dominated by fjords (as determined using Dürr et al., 2011) were not included because offshore glacial over-deepening and protection from coastal waves and tides make their comparison to most of the world's coastal deltas difficult. Ephemeral rivers in arid regions were included in the dataset, though the rivers in these regions are often difficult to identify due to poor imagery and difficulty distinguishing the channel banks when they are dry. If a clear distinction was not possible, the river was not included in the dataset. Thus, the total count of rivers and deltas in arid regions should be considered a minimum. Finally, we did not include river channels that do not clearly reach the coast to avoid conflating alluvial fans with deltas.
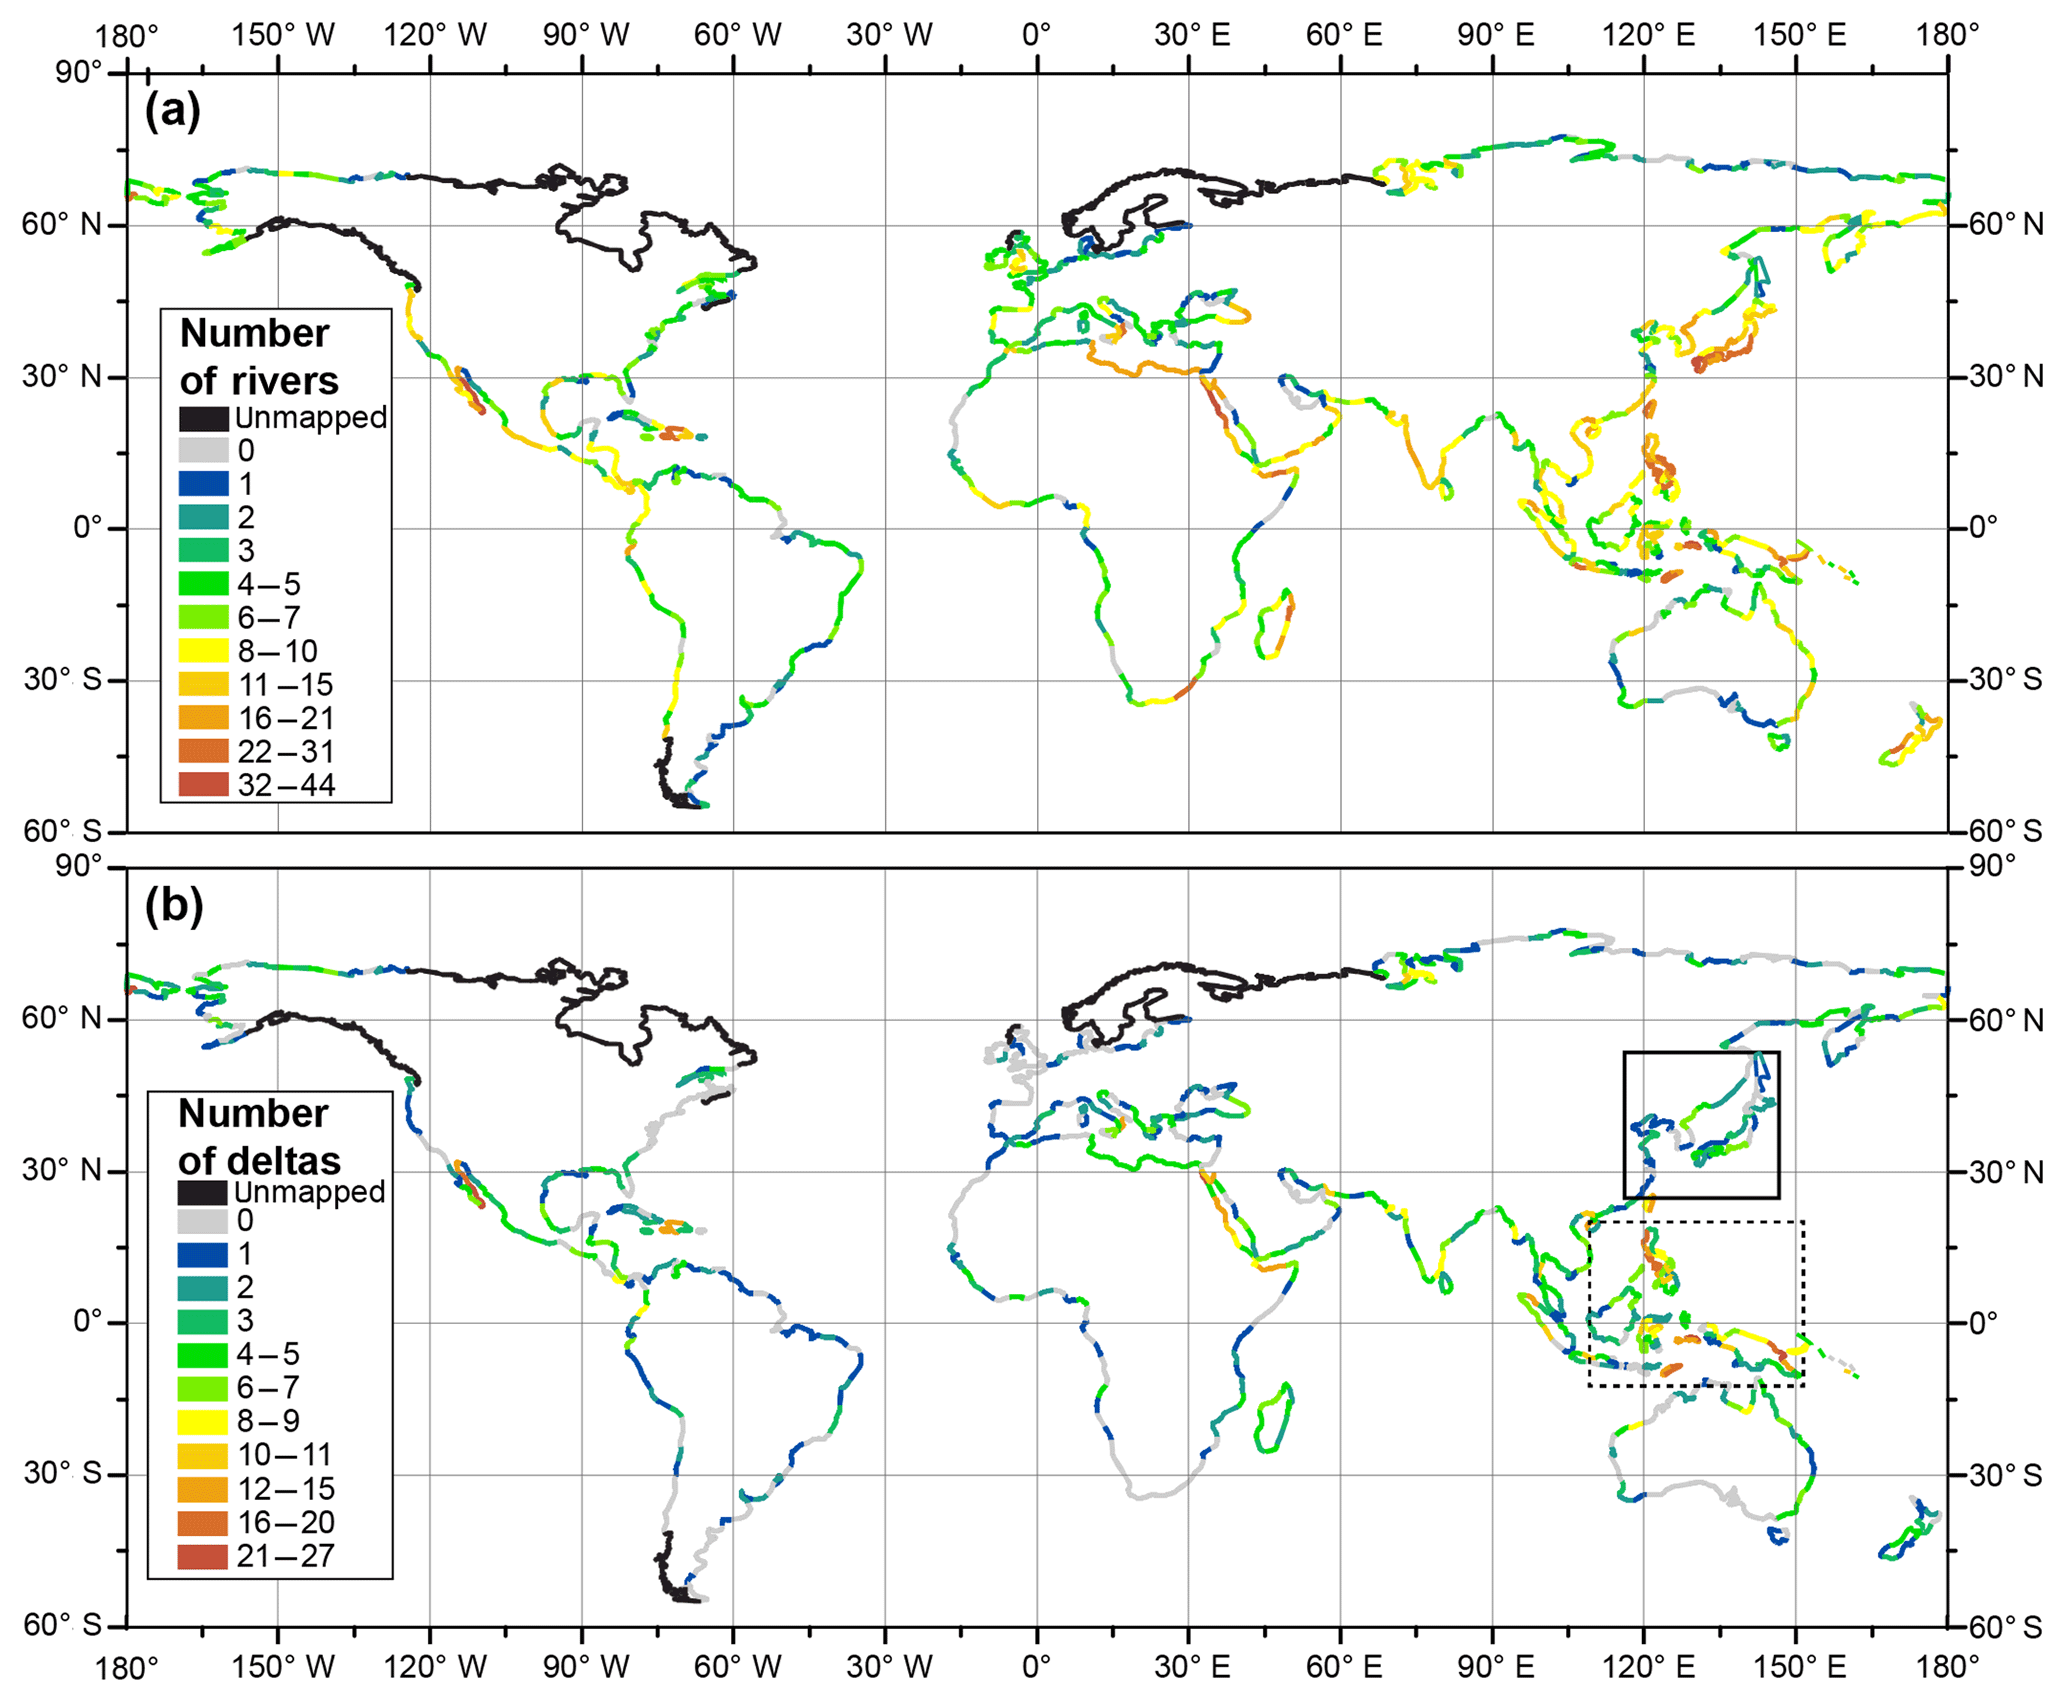
Figure 2Global distribution of coastal (a) rivers (includes both river mouths and deltas) and (b) deltas only. Each colored line segment is 3∘ long. Black (solid and dashed) boxes refer to hotspots of delta formation discussed in the text.
For each river we marked the latitude and longitude of the main river mouth (Fig. 1, RM) (Table S1 in the Supplement). For rivers without a delta, this is the location where the river meets the coastline (Fig. 1a), and for rivers with deltas, this is the location of the widest river mouth in the distributary network (Fig. 1c–e). For rivers sheltered by barrier islands or rocky islands, we mark the river mouth landward of those obstructions.
2.2 Environmental variables
To determine controls on delta formation we also compiled data on eight environmental variables (Table 1). We classify the environmental variables into two groups: (1) upstream variables include water and sediment supply from the river, sediment concentration, and the drainage basin area; (2) downstream variables include wave height, tidal range, bathymetric slope immediately offshore of the river mouth, and the rate of sea level change. We use modern data collected for each of these environmental variables, even though some deltas may have initially formed under different conditions 6000 to 8500 years ago as sea level rise slowed after deglaciation (Stanley and Warne, 1994). We assume that the current river delta (or lack thereof) is adapted to the modern environmental variables because scaling analyses suggest that the diffusive response time of river delta deposition and wave reworking is on the order of 100–1000 years (Jerolmack, 2009; Nienhuis et al., 2013). Of course, the diffusive response time depends nonlinearly on delta size, so larger deltas may still be adapting to changing environmental variables.
Notably absent in the collected environmental variables are tectonic data. At present, there are no globally available measurements of tectonic activity (e.g., uplift). However, we consider some of the variables to be reasonable proxies for tectonics. For instance, models predicting sediment flux to the ocean represent tectonics in the form of basin area (Syvitski and Morehead, 1999; Syvitski and Milliman, 2007). We also include bathymetric slope, which is a rough proxy for tectonics, because on average tectonically active margins have steeper slopes than passive margins (Pratson et al., 2007).
Table 1Independent variables: upstream and downstream environmental variables.
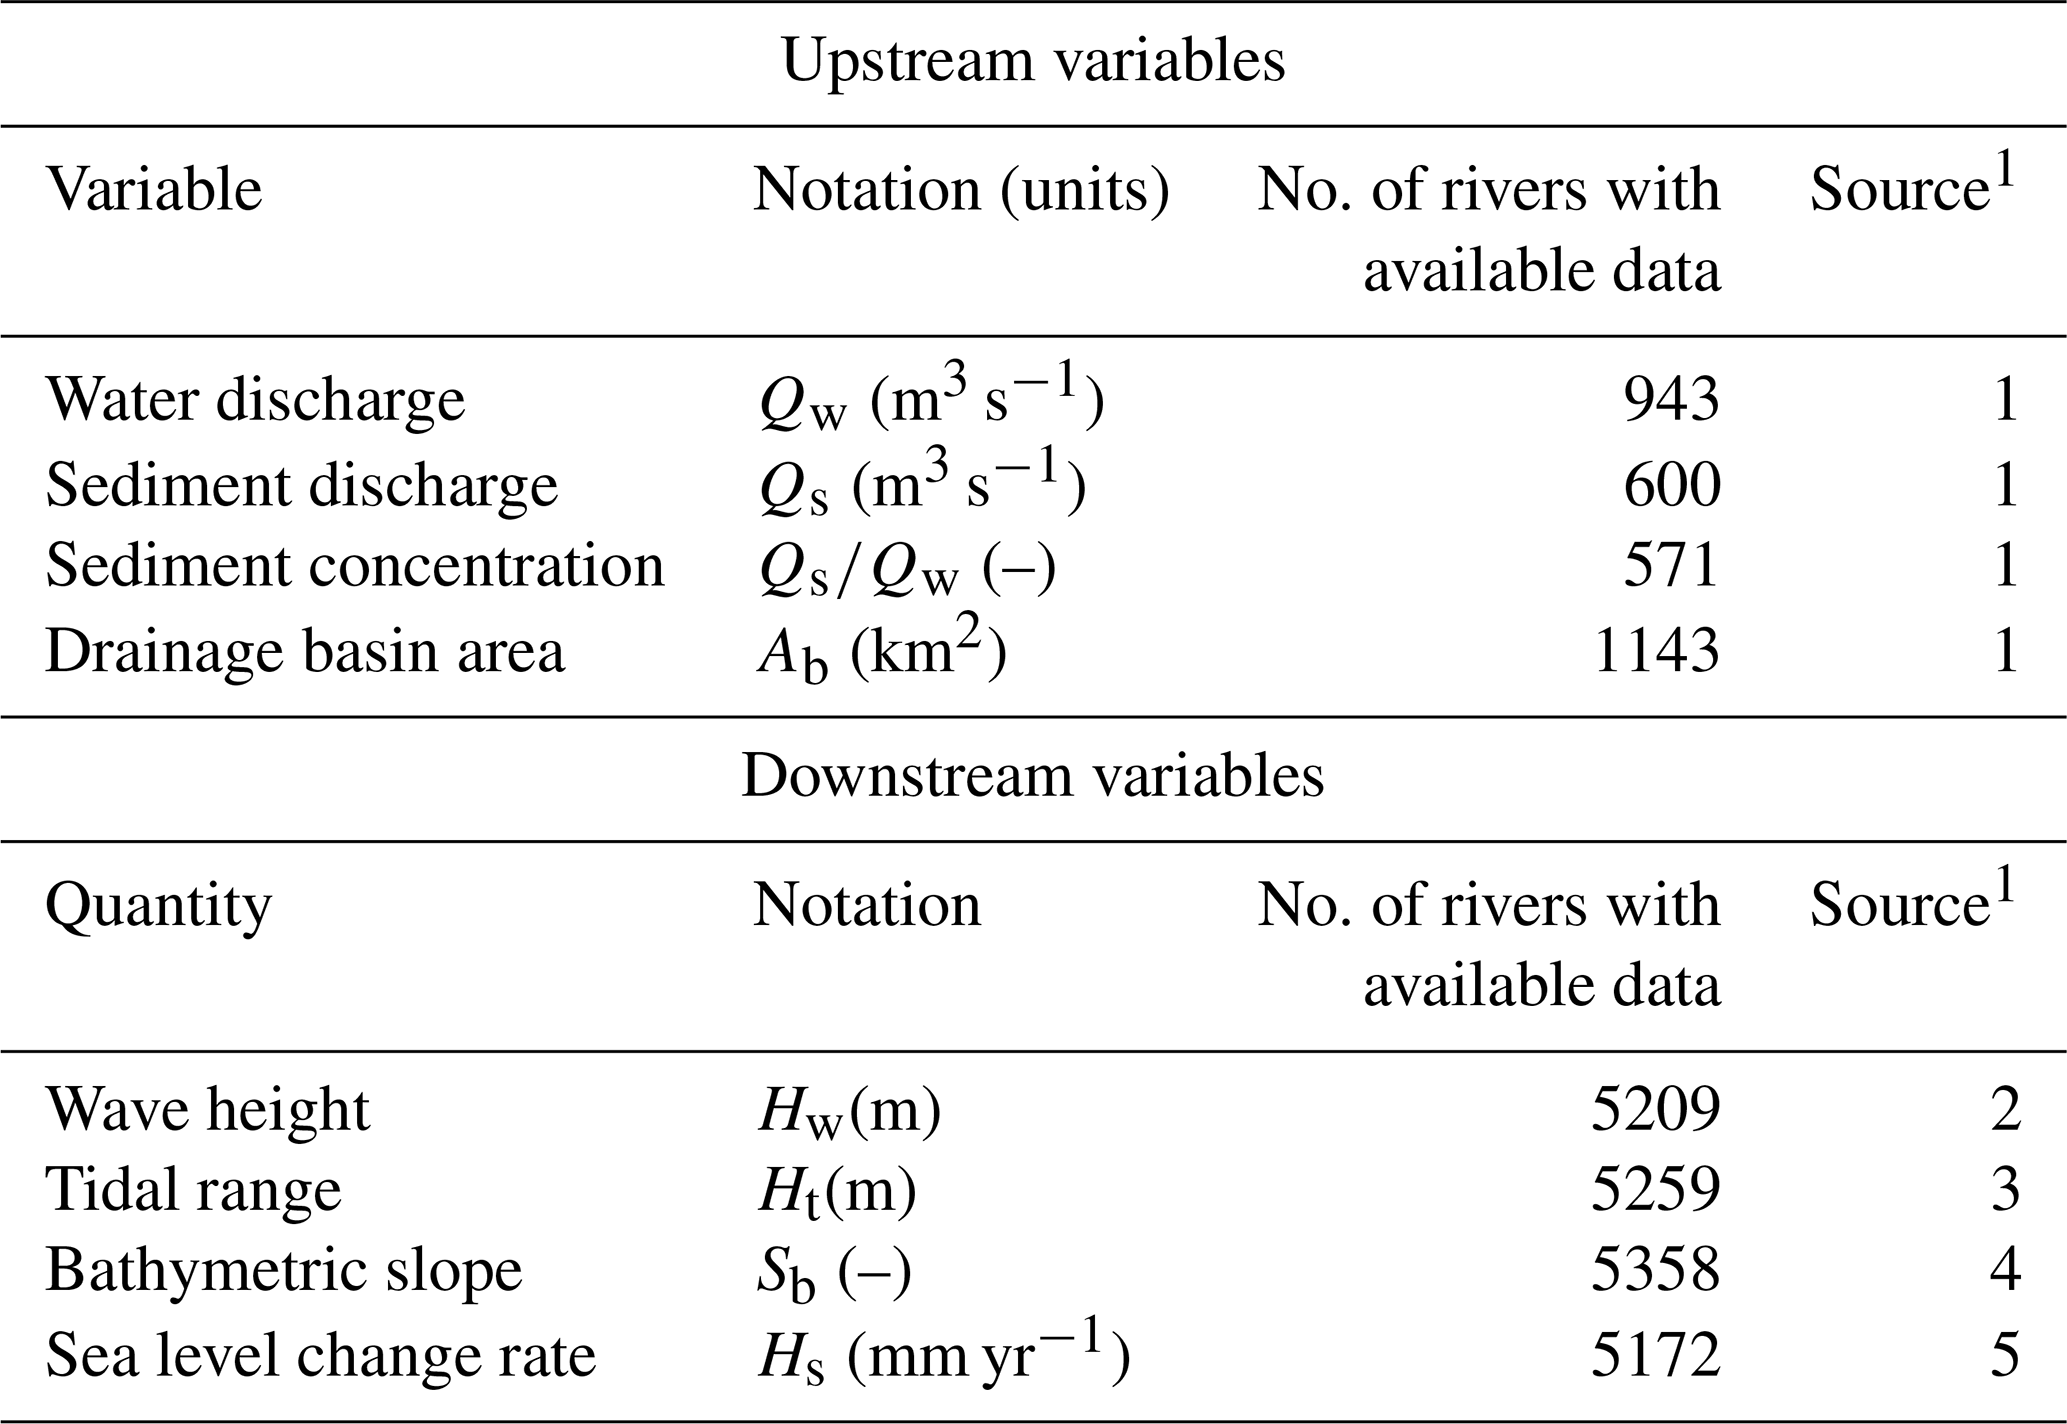
1 Sources: 1. Milliman and Farnsworth (2011), 2. WAVEWATCH, 3. OSU TOPEX/Poseidon Global Inverse Solution TPXO, 4. ETOPO1, 5. AVISO (https://www.aviso.altimetry.fr, last access: 11 August 2018).
2.2.1 Upstream variables
We compiled the four upstream variables from the global river dataset of Milliman and Farnsworth (2011) (hereafter referred to as MF2011). We matched rivers in this dataset with entries in MF2011 based on geographic proximity or by the river name. If neither matching method yielded a confident result, the MF2011 data were not included in this study. If two or more rivers in the MF2011 dataset combine to make one river in this study's dataset, the data from all relevant MF2011 rivers are included. In cases in which matches were found, we included the river ID(s) from MF2011 in our dataset (Table S1). Our dataset includes 1217 MF2011 rivers, representing 1158 entries in our dataset; 54 entries contain 2 or more MF2011 rivers, and in those cases we added the MF2011 values together to form one value for the river mouth or delta. There are 314 MF2011 rivers not included in this dataset because they are too small (<50 m wide), exist on coastlines not included in our dataset, or could not be matched.
Water discharge (Qw, expressed as mean annual volumetric flux; m3 s−1) data in MF2011 are compiled from various sources of reported gauging station measurements, whereby the downstream-most gauging station data are used. Qw is computed from many years of data, though the number of records for each value is different. Where available, we used the pre-dam Qw. As MF2011 note, water discharge values may be overestimated or underestimated due to distance upstream of the river mouth. In many regions, additional water input downstream of the gauging station increases the true Qw value reaching the river mouth. However, in arid regions, water volume may be lost due to evapotranspiration, groundwater recharge, or irrigation water removal. In total, 17 % of rivers (n=943) in this dataset have Qw data.
Sediment discharge (Qs, expressed as mean annual volumetric flux; m3 s−1) data come from the MF2011 dataset of annual sediment load measurements and are converted (m3 s−1) assuming a density of 2650 kg m−3. Qs is computed from many years of data, though the number of records for each value is different. Where available, we used the pre-dam Qs. The Qs data are compiled from various sources of reported loads and most often represent suspended load measurements rather than total load. Bedload is assumed to represent only 10 % of total load (Milliman and Meade, 1983), but this estimation may be less valid for small mountainous rivers where the relative proportion of bedload can be greater (Amante and Eakins, 2009). Like the Qw data, many of these measurements may have been made upstream of the actual river mouth, and thus actual Qs values that reach the river mouth likely vary (e.g., due to fluvial plain deposition downstream of the measurement location). Finally, the extrapolation of measurements taken over varying lengths of time to represent annual sediment loads is potentially risky (e.g., when considering the significance of event-driven discharge). In total, 11 % (n=600) of all rivers in this dataset have Qs data. Sediment concentration (Qs∕Qw) is calculated from the sediment and water discharge data, and 11 % (n=571) of all rivers have Qs∕Qw data.
We also include upstream drainage basin area (Ab, km2) in our dataset because it partly sets the magnitude of Qw and Qs (Syvitski et al., 2003; Syvitski and Milliman, 2007) and compensates for the relatively small number of rivers with water and sediment data. Ab data come from the MF2011 dataset. Although these values are often well documented for larger river systems, they may sometimes represent the total drainage area upstream of a hydrologic station, which would be a smaller value than total drainage area upstream of the river mouth. Given the potential error, Ab values should be considered a minimum.
2.2.2 Downstream variables
Four downstream variables are included in this dataset. Annual significant wave heights (Hw, m) were calculated using the NOAA WAVEWATCH III 30-year Hindcast Phase 2 for 1979–2009 (Tolman, 2009; Chawla et al., 2013). The model outputs 30 years of hourly significant wave height data on five different ocean grids with varying resolution, and the final product is interpolated to a global 0.5-decimal-degree grid. We ran a nearest-neighbor search from each RM location to the nearest grid cell with wave data that are within one grid cell diagonally, which is equivalent to 0.7071 decimal degrees or ∼80 km at the Equator. Because some coasts are missing wave data not all 5399 rivers have corresponding wave data. For each calendar year, we calculate the annual mean of the top 1∕3 largest wave heights. The resulting 30 years of annual significant (mean of the largest 1∕3) wave height data are representative of the strongest wave action that occurs at each location within a year or representative of a stormy season for areas with strongly seasonal wave climates. The mean of these 30 annual values is the mean annual significant wave height (Hw).
Median tidal ranges (Ht, m) were calculated using the previously published Oregon State University TOPEX/Poseidon Global Inverse Solution TPXO model results (Egbert and Erofeeva, 2002). The model outputs tidal harmonics component data on a 0.25-decimal-degree resolution grid derived from a barotropic inverse solution. Following Baumgardner (2015), we use the main tidal components, the lunar semidiurnal, and the lunar diurnal to calculate mean tidal range by building a composite tidal sine wave and calculating the average range. We ran a nearest-neighbor search from each RM location to all grid cells with tidal data that are within the same distance used for the wave search. The median of the tidal range values within this search radius is used to represent each river mouth's tidal range.
Receiving-basin bathymetry is an important attribute of delta formation because it sets the size and shape of the volume to be filled from a mass balance perspective and influences the hydrodynamics (Jiménez-Robles et al., 2016; Carlson et al., 2018). The size of the basin could be characterized by the average depth, whereas the shape is most simply characterized by the bathymetric slope. In most cases, we do not know basin depth prior to delta formation, and current depths offshore of deltaic river mouths will be deeper than the initial depths if the basin has offshore-dipping bathymetric slopes. Thus, instead of using depth, we characterize the receiving basin with bathymetric slopes. Bathymetric slopes (Sb) are calculated from ETOPO1 bathymetric data (Amante and Eakins, 2009) and RM locations. ETOPO1 is a global surface elevation model with 1 arcmin resolution (1∕60 decimal degree or ∼1800 m at the Equator). For each river, we collect all bathymetric elevations within a 20 km radius from the RM location. We calculate linear slopes between each point and the RM (assumed elevation 0 m) and take Sb as the 75th percentile of all slopes. We chose the 75th percentile because it best captures the bathymetric slope when we compared our Sb values to spot measurements. We purposefully search far away from the shoreline because we want to characterize the offshore depths not affected by sediment deposition from the river.
The rate of sea level change is calculated from AVISO (Archiving, Validation and Interpretation of Satellite Oceanographic data, https://www.aviso.altimetry.fr, last access: 11 August 2018). The AVISO dataset combines sea level change from different satellite altimetry missions from 1992 to 2018 using the delayed-time Ssalto/Duacs multi-mission altimeter data processing system, which corrects biases among instruments and applies intercalibration to the record. Sea level change rates are calculated for every cell by finding the best fit to the data over 26 years. These data are not corrected for glacial isostatic adjustments. We used modern rates that are measured (not modeled) to be consistent with the other environmental variables. An argument could be made that we should compare delta formation to sea level change averaged over the life span of the delta. But we do not know when each delta in this dataset starting forming. Nonetheless, if we assume that all deltas started growing since the most recent deglaciation, we can compare modeled relative sea level change rates since 26 kyr ago to delta formation (Argus et al., 2014). When we use these longer-term sea level change rates, it does not increase the success of predicting delta formation using the method in Sect. 3.2, and because of this we opt to use the modern sea level change data for consistency.
Our mapping reveals that there are 5399 coastal rivers with widths greater than 50 m, and 2174 of those rivers (∼40 %) have a geomorphic delta. Herein, we refer to all 5399 coastal rivers as “rivers”, the 3225 that do not have deltas as “river mouths”, and the 2174 with deltas as “deltas”. These terms are not completely accurate because, for example, an individual “river” that is considered a “delta” rather than a “river mouth” still has at least one main river mouth (RM) and may have additional river mouths for each distributary channel.
3.1 Global distribution of rivers and deltas
River deltas are not distributed evenly on coastlines and there are locations on the world's coastlines where deltas are unusually common (Fig. 2). These “delta hotspots” occur primarily in Southeast Asia (dashed box Fig. 2b). Notably, these areas are also densely populated with rivers (Fig. 2a), though river abundance does not always equate to delta abundance. For example, East Asia has a high river density but low delta density (black box, Fig. 2b). Similarly, along the west coasts of central and southern North America (from 5 to 45∘ N) the coast is densely populated with rivers, but the northern portion is delta-poor compared to the southern portion. There are also a surprising number of deltas in arid environments. For instance, there is high delta density in the Red Sea and on Baja California. This largely arises because many alluvial fans coming off the nearby mountains reach the coastline and satisfy our definition of a delta.
Binning these data by latitude reveals preferential locations of rivers and deltas (Fig. 3). The largest numbers of rivers and deltas occur roughly from −12 to 45∘ and 66 to 72∘ (Fig. 3a). This unequal distribution is partly explained by the unequal latitudinal distribution of global shoreline length (Wessel and Smith, 1996) (Fig. 3b). River density, or rivers per shoreline kilometer, shows that globally there is one river for every 230 km of coastline and one delta for every 333 km of coastline. Coastlines within the −6 to −3∘ bin have the highest density of deltas with roughly one delta per 100 km of shoreline (Fig. 3c, solid black line). River density is above average from −45 to 45∘ (Fig. 3c, white bars). Delta density, however, is above average over a smaller range from −21 to 30∘ (Fig. 3c, solid black line).
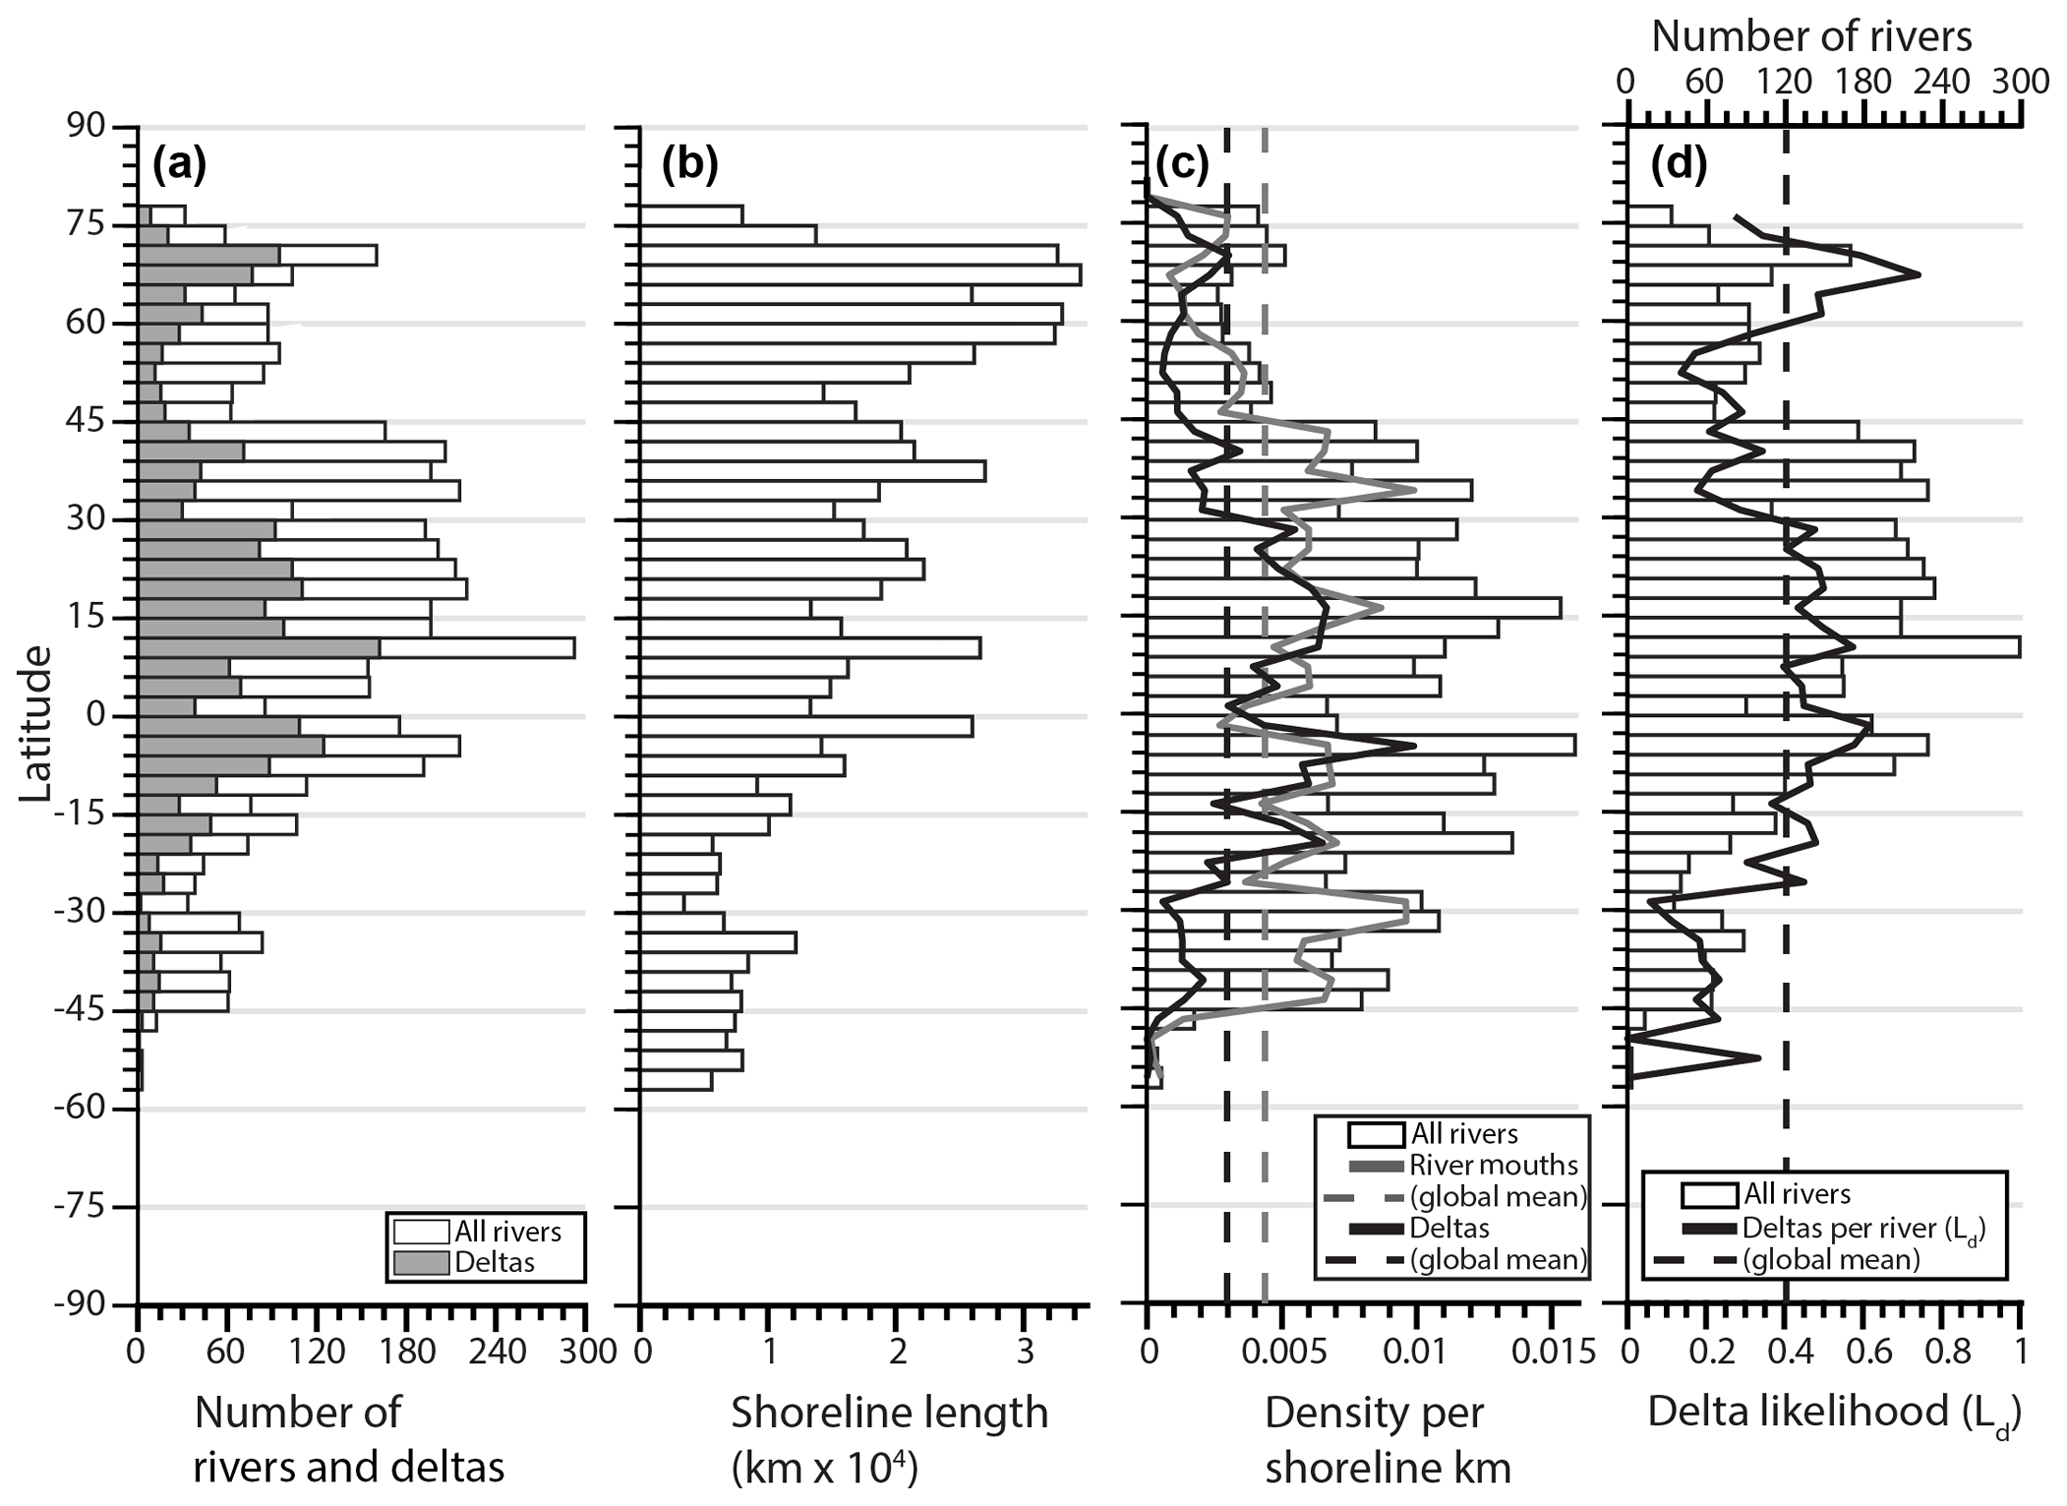
Figure 3Histograms showing the latitudinal distribution (3∘ bins) of (a) the total number of rivers (white) and number of rivers with deltas (gray), (b) the total shoreline length of surveyed coastlines measured from the global shoreline database (Wessel and Smith, 1996), and (c) all rivers (including deltas) per shoreline kilometer (white bars), for which the solid gray line shows rivers with no deltas (river mouths) and the solid black line shows rivers with deltas. (d) The solid black line is the ratio of deltas per river (delta likelihood, Ld), and the white bars are the total number of rivers (including deltas).
To determine which environments promote delta formation, it is perhaps most instructive to observe locations where the likelihood for rivers to create deltas is highest. Delta likelihood (Ld) is defined as the number of deltas relative to the total number of rivers for a given set of samples (Fig. 3d, solid black line). For the entire dataset, 40 % of rivers form deltas, and thus the global Ld is 0.40 (Fig. 3d, dashed black line). Regions where Ld is higher than the global mean are from −27 to 30∘ and 60 to 72∘, whereas rivers located from −57 to −27∘ and 30 to 60∘ are least likely to form a delta (Fig. 3d).
These latitudinal zones, where rivers are more likely to create deltas, coincide with peaks in environmental variables that influence delta formation. Both Qw and Qs have peaks from roughly −9 to 30∘ and 60 to 75∘ (Fig. 4a, b), which are similar in location to Ld peaks. Ab has a similar high-latitude peak but is missing the equatorial peak (Fig. 4d), probably reflecting the importance of small mountainous rivers in those locations (Milliman and Syvitski, 1992). On the other hand, delta formation is infrequent where Hw and Ht are high, namely −57 to −27∘ and 42 to 60∘ (Fig. 4e, f). There are no latitudinal changes in Qs∕Qw, Sb, or Hs that are easily relatable to delta formation (Fig. 4c, g, h).
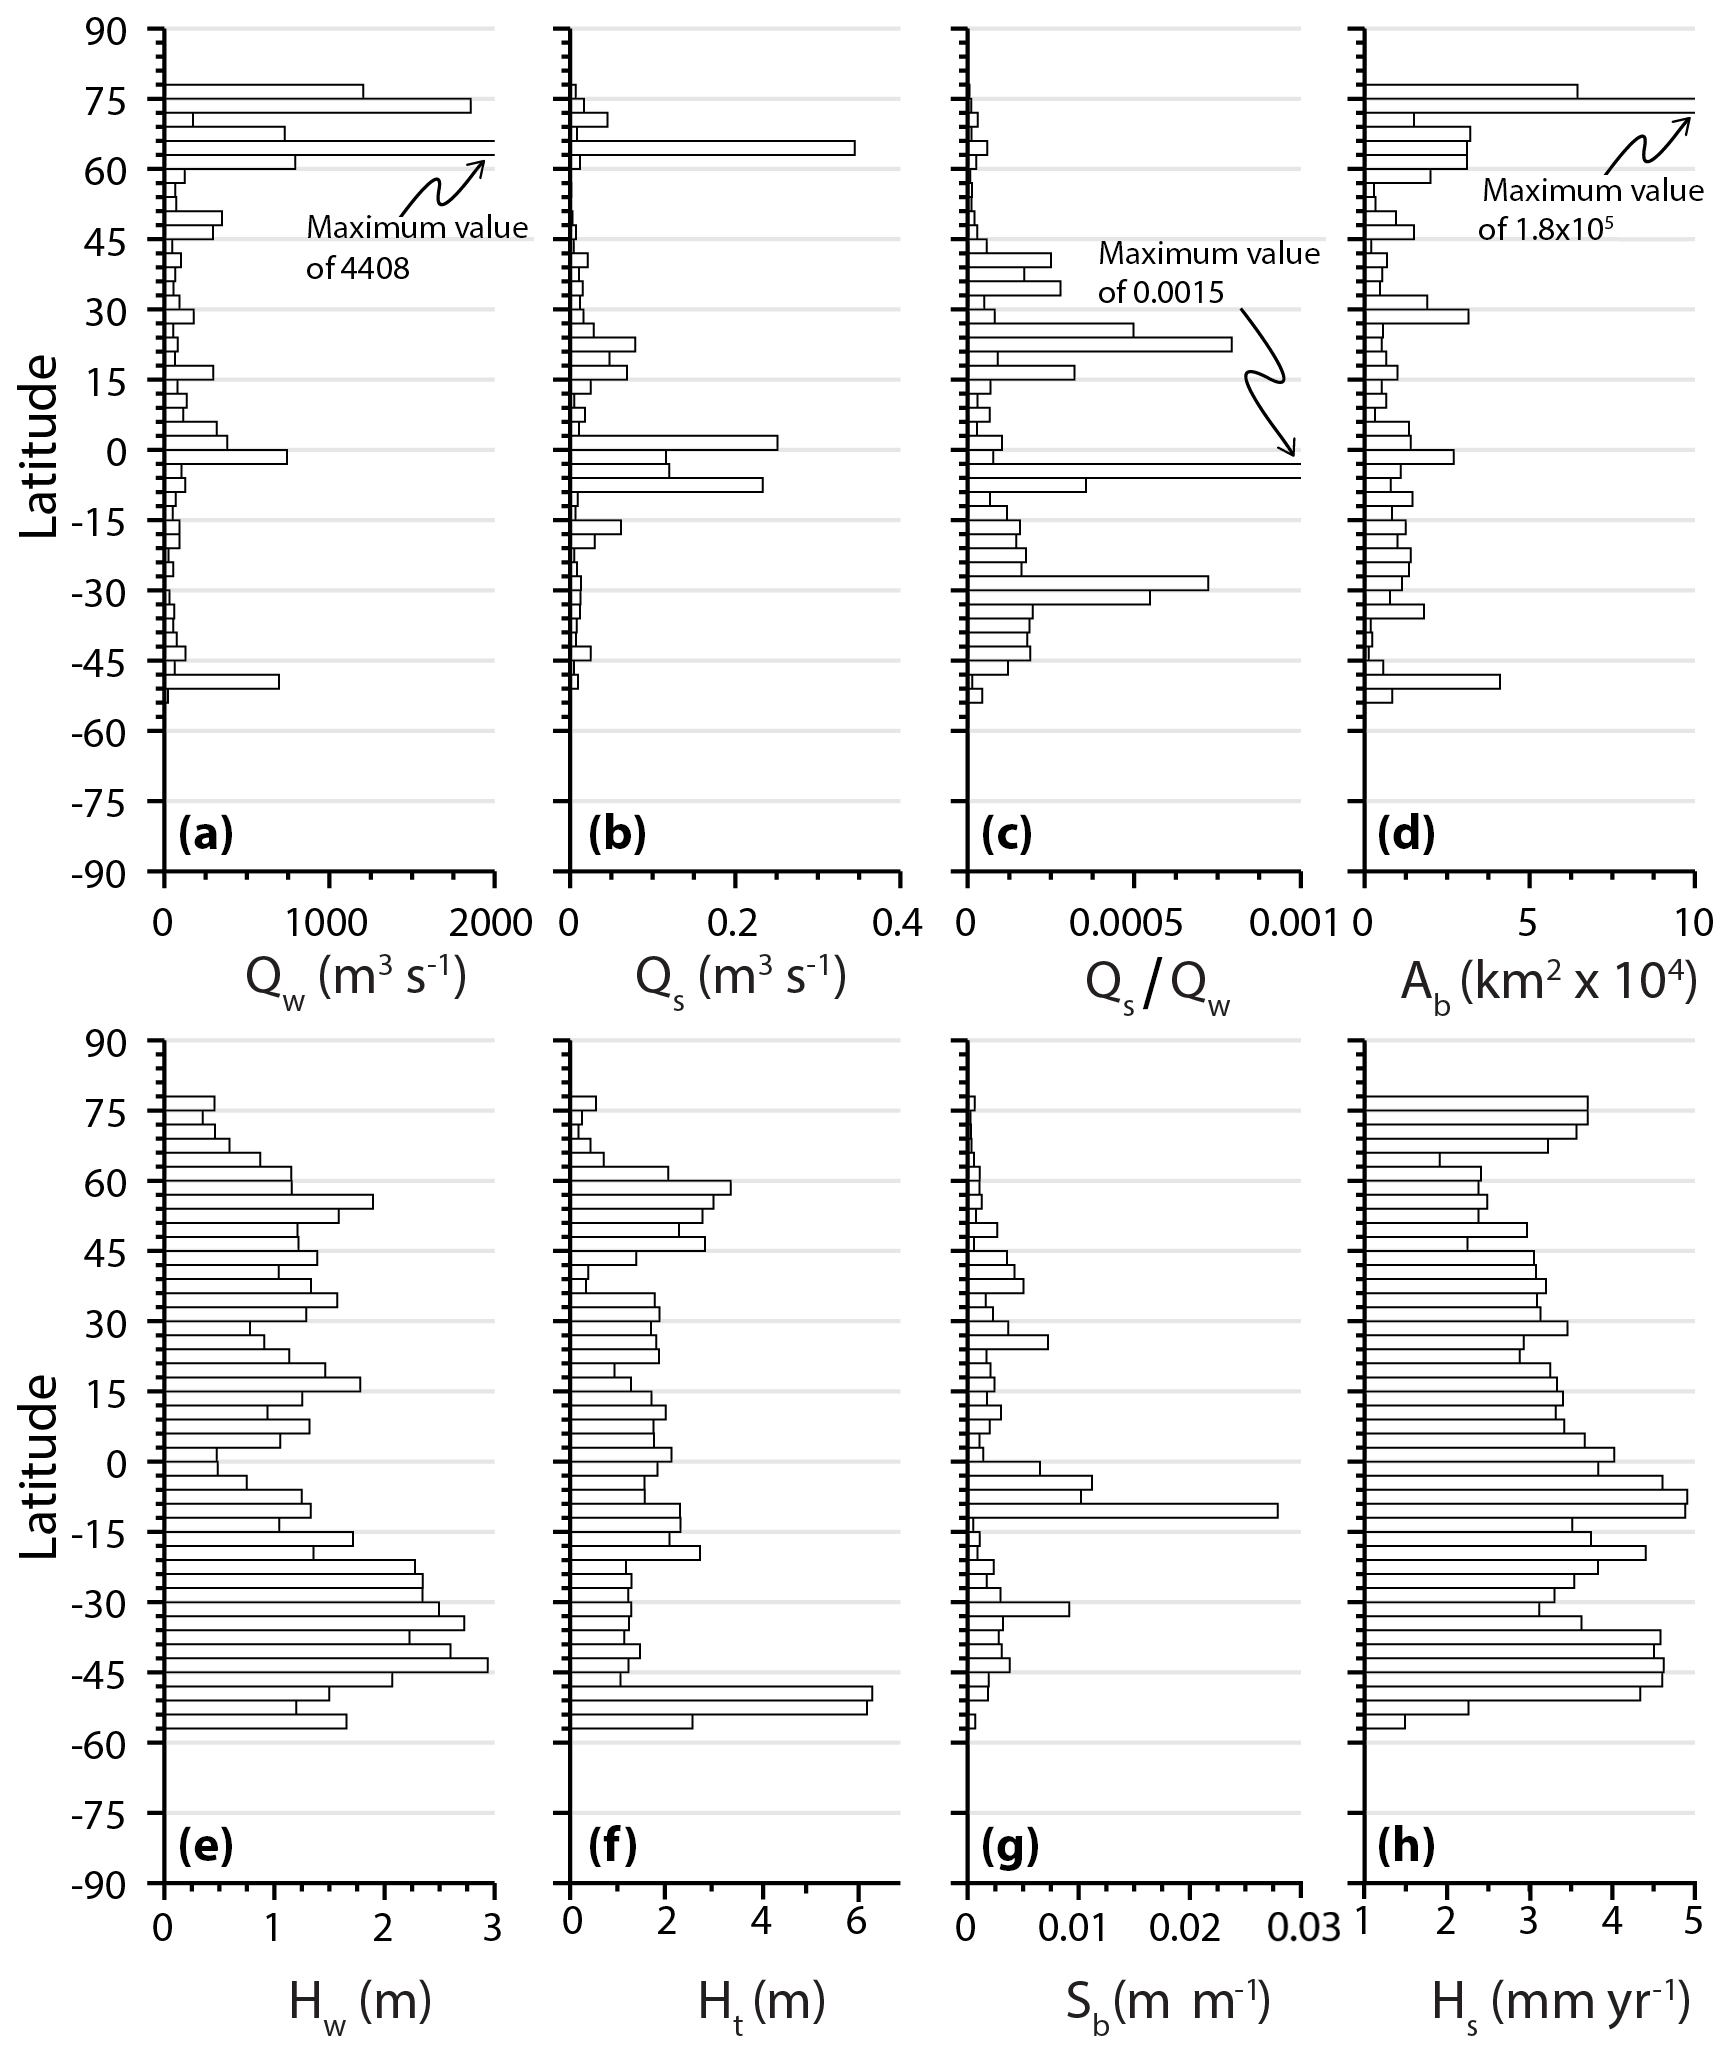
Figure 4Latitudinal variation of the independent variables used in this study. All panels show the median value for 3∘ bins: (a) water discharge, Qw; (b) sediment discharge, Qs; (c) sediment concentration, Qs∕Qw; (d) drainage basin area, Ab; (e) mean annual significant wave height, Hw; (f) median tidal range, Ht; (g) bathymetric slope, Sb; (h) rate of sea level change, Hs. For (a, c, d) the outliers have been cut off for viewing purposes.
3.2 Relationships between environmental variables and delta formation
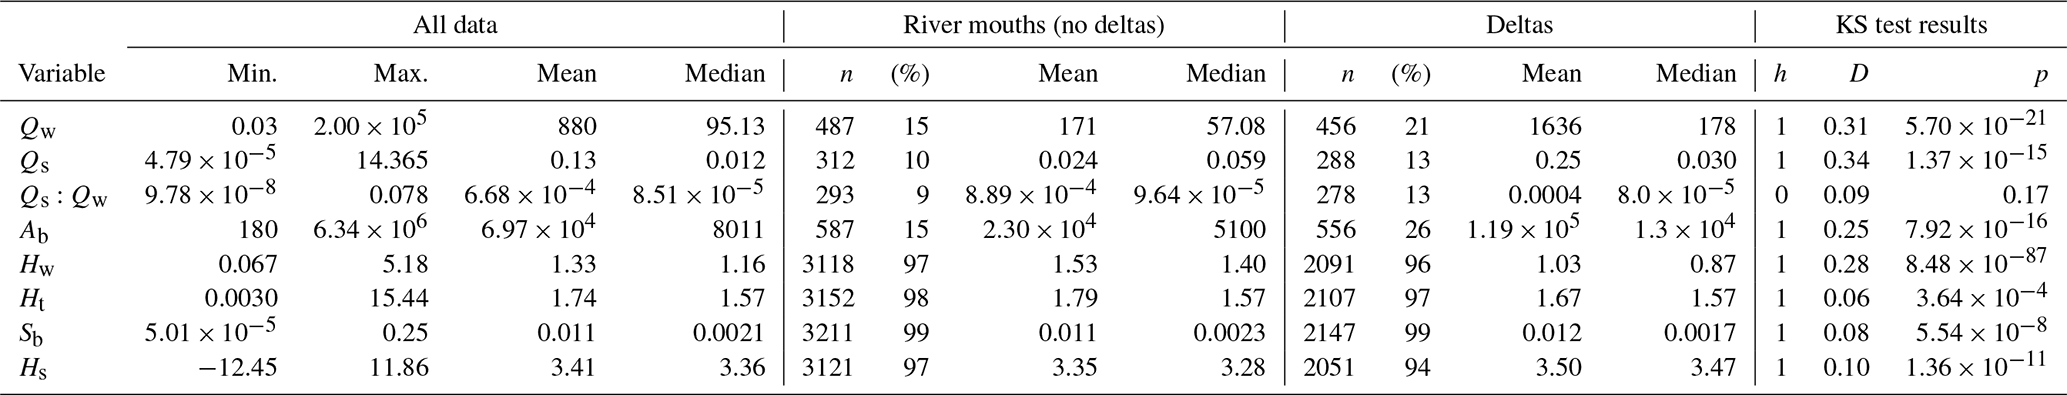
We explore controls on delta formation by analyzing how the likelihood of a river creating a delta varies with each environmental variable. River mouths and deltas have statistically different population distributions for seven of the eight environmental variables (all but Qs∕Qw) (Table 2), suggesting that deltas form under certain ranges of environmental variables. To determine this, we used the Kolmogorov–Smirnov test, which is a nonparametric, distribution-free test that uses the cumulative distribution functions of the two populations to estimate statistical difference. Although a few variable pairs show some correlation, such as Qw and Ab, none have a strong statistical correlation (Pearson correlation coefficient >0.9), suggesting they exert largely independent controls on delta formation.
Table 2Statistical differences between rivers with no deltas and rivers with deltas. Percentages are calculated relative to the total number of rivers with no deltas (3225) and with deltas (2174). D is the two-sample Kolmogorov–Smirnov test statistic and is equal to the maximum variance between the cumulative distribution functions of the two populations tested; p is the p value at the 5 % significance level, and h is the test decision, wherein 1 rejects the null hypothesis that the distributions are from the same population and 0 accepts the null hypothesis.
Delta likelihood (Ld) generally increases as the upstream environmental variables increase (Fig. 5). Increasing Qw, Qs, and Ab causes a linear increase in semi-log space in Ld (Fig. 5a, b, d). Deltas have characteristic Qw, Qs, and Ab values that are an order of magnitude larger than those of river mouths (statistically significant, p<0.05) (Table 2). These data suggest that rivers with small water and sediment discharge and/or that come from small drainage basins rarely form deltas, whereas rivers with larger values of the upstream variables frequently create deltas. Sediment concentration (Qs∕Qw) exerts no clear control on Ld (Fig. 5c), and there is no statistical difference between the mean or median Qs∕Qw values for river mouths versus those for deltas (Table 2).
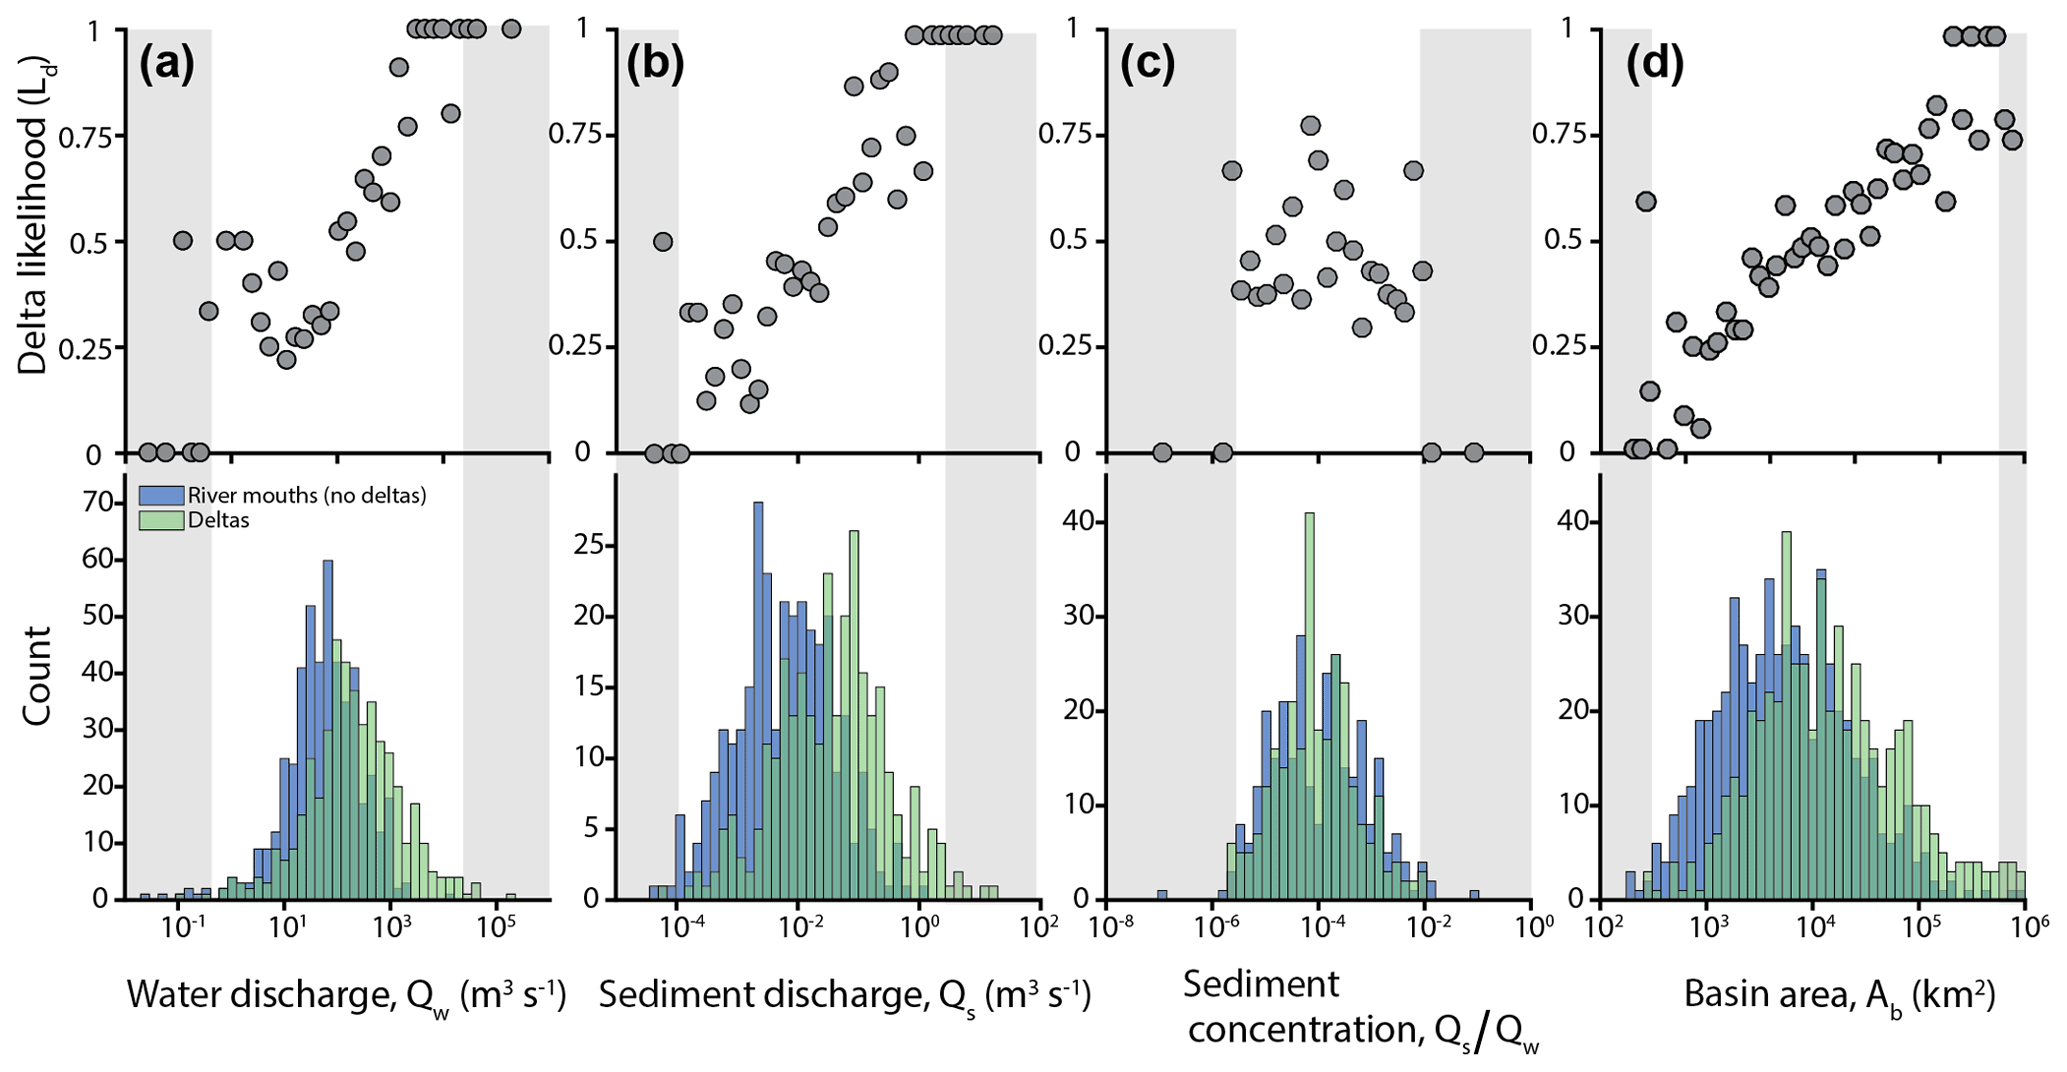
Figure 5Differences in upstream environmental variables for rivers with and without deltas. Scatter plots (top of each panel) of delta likelihood, defined as the number of rivers with a delta relative to the total number of rivers in that interval. Histograms (bottom of each panel) binned into equal log-spaced intervals. Gray boxes outline ranges represented by 1 % or less of the total sample number.
Rivers are less likely to create deltas where Hw and Ht are large. Ld shows a clear linear decrease as Hw increases (Fig. 6a). Rivers that experience little wave energy at the coast (Hw<1 m) create a delta more than half of the time (Ld≈0.5–0.6), but delta formation becomes nearly impossible for larger wave heights. Ld also seems to show a linear decrease with Ht (Fig. 6b) if the long tail of the distribution is eliminated where the sample size is small (Ht>7 m). The population of river mouths has higher mean and median Hw and Ht than rivers with deltas (statistically significant, p value <0.05) (Table 2).
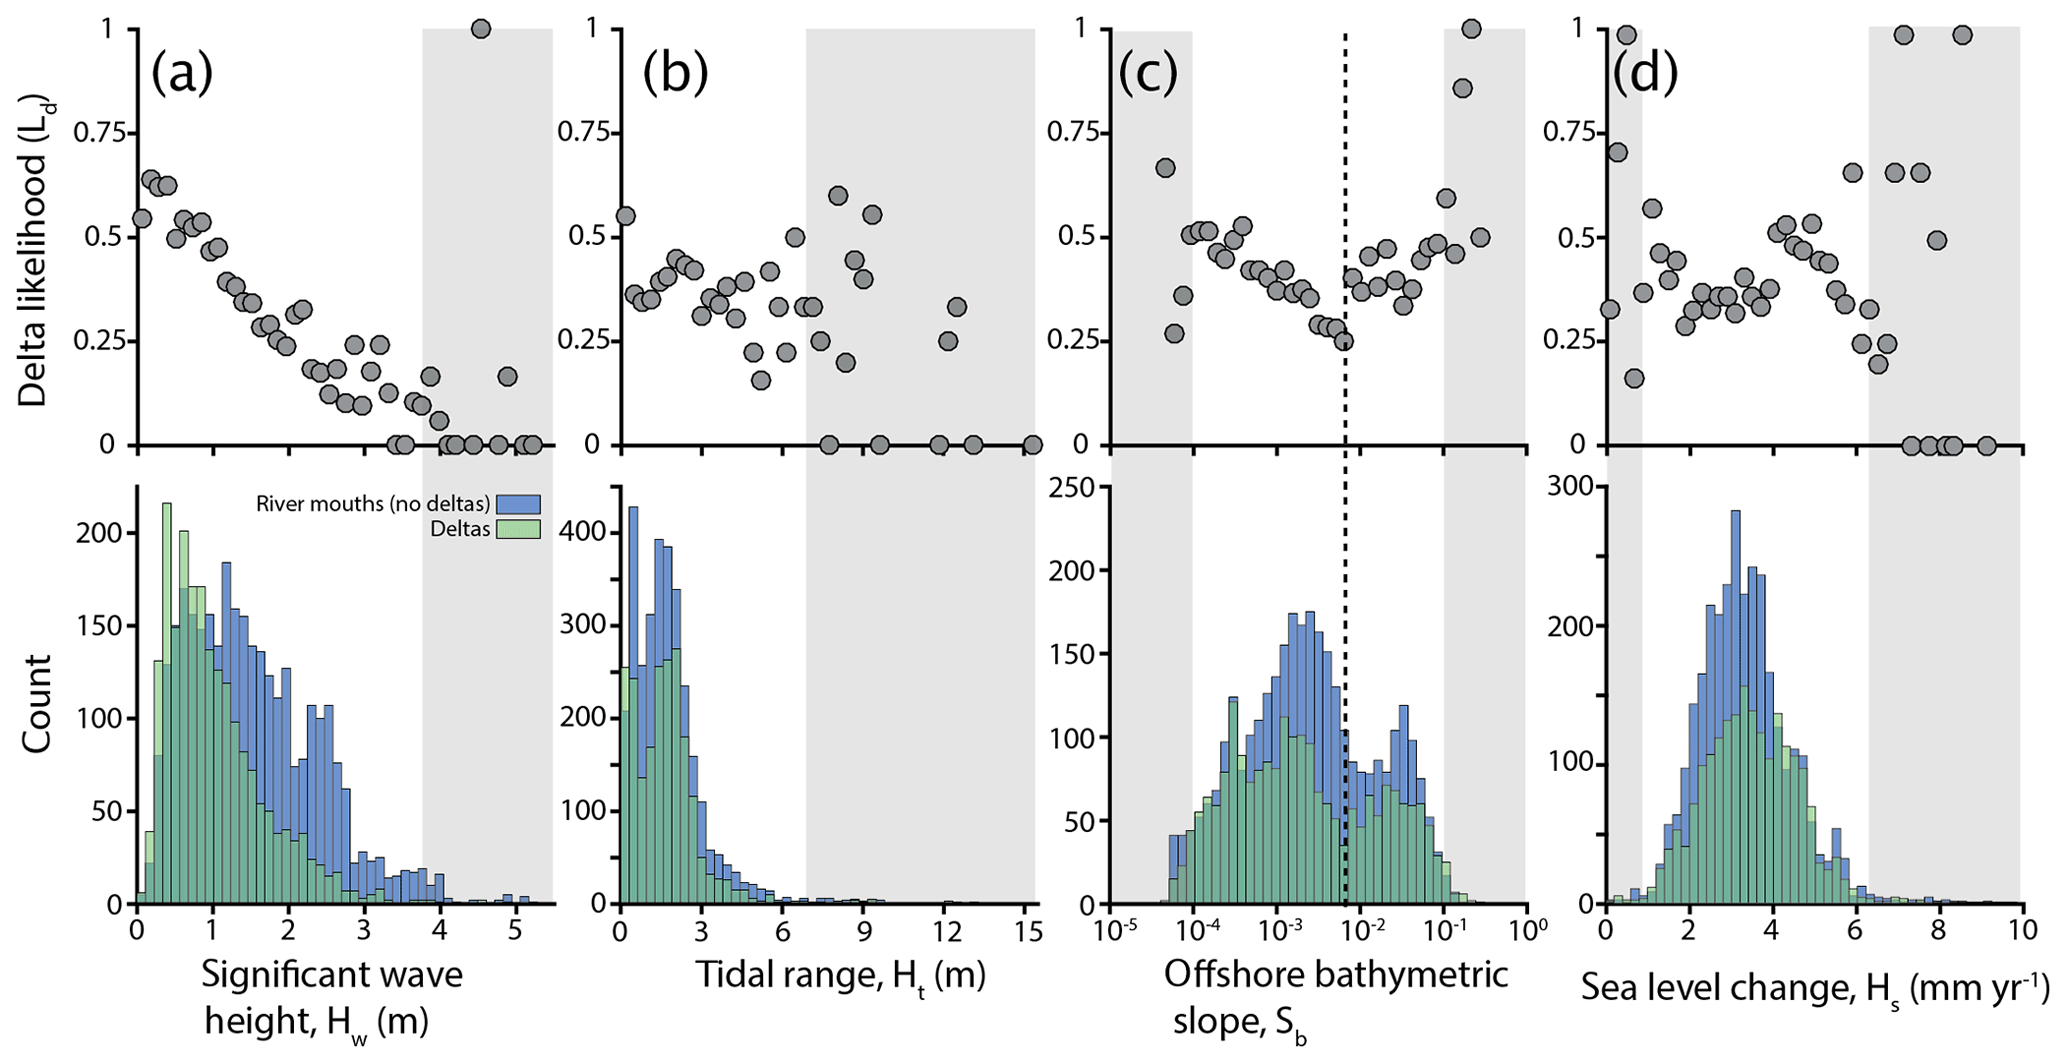
Figure 6Differences in downstream environmental variables for rivers with and without deltas. Scatter plots (top of each panel) of delta likelihood, defined as the number of rivers with a delta relative to the total number of rivers in that interval. Histograms (bottom of each panel) binned into equal log-spaced intervals. Gray boxes outline ranges represented by 1 % or less of the total sample number. Sea level change plot and histogram (d) only include positive values due to limited negative values.
Sb displays a non-monotonic relationship in which Ld decreases then increases across the range (Fig. 6c). Sb data are bimodally distributed for the rivers in our dataset, suggesting rivers empty into two types of receiving basins (separated by the dashed line in Fig. 6c). If these basin types are separated, there is a clearer relationship between Sb and Ld. For shallowly dipping basins (Sb<0.006), there is a negative relationship between Ld and Sb (Fig. 6c, left of dashed line), and delta likelihood increases as slope decreases. In steeply dipping basins (Sb>0.006), Ld is approximately constant to slightly increasing as slopes steepen (Fig. 6c). There is no clear relationship between sea level change (Hs) and Ld (Fig. 6d), which is somewhat surprising given that river mouths and deltas have statistically different mean and median Hs values (Table 2).
To quantify the relative importance of the environmental variables for delta formation, we develop an empirically derived logistic regression. The result of a logistic regression is a statistical model that predicts a dichotomous outcome (in this case, a river creates a delta, or it does not) based on multiple independent variables. This dataset contains eight total independent variables collected on most rivers: four are upstream variables (Qw, Qs, Qs∕Qw, Ab) and four are downstream variables (Hw, Ht, Sb, Hs). Of the 5399 rivers in this dataset, 490 of them (9.1 %) have data available for all eight independent variables.
The data meet the assumptions of binary logistic regression because the dependent variable has two mutually exclusive outcomes and the sample size is large (45 samples or more per independent variable). Additional assumptions that the data must meet include having little to no multicollinearity and no outliers. We tested for multicollinearity by calculating the Pearson correlation coefficients (R) between all continuous independent variables, and no variables exhibited R>0.9. We also remove 13 rivers that have outliers in any of the independent variables based on a modified z score, whereby an absolute-value-modified z score >3.5 is considered an outlier (Iglewicz and Hoaglin, 1993). The final subset of data used for the regression has n=477 rivers (249 rivers without deltas, 228 rivers with deltas). The samples were randomly separated into training (2∕3 of the samples) and validation (1∕3 of the samples) subsets, each of which represented similar distributions of independent and dependent variables. We do this to see how well the logistic regression can predict delta formation on river mouths not used in development of the equation.
The binary logistic regression between the probability that a river will create a delta and the eight environmental variables yields the following log odds relationship:
where πdelta is the probability that a river will form a delta and ranges from 0 (the river is unlikely to form a delta) to 1 (the river is most likely to form a delta). This is different from the Ld values presented earlier in that it is predicted, whereas Ld is measured. Environmental variables with p>0.05 (Qs∕Qw, Ab, Sb, and Hs) are not included in the final empirical relationship because any controls these variables exert on delta formation are minimal (e.g., variations in Qs∕Qw have no clear relationship with Ld; Fig. 5d) or are related to variations in the other important variables (e.g., Ab influences Qw and Qs).
Thus, the combination of environmental variables that comprises the right side of Eq. (1) predicts the log odds that a river will form a delta. When tested using the validation subset, Eq. (1) has a 74 % success rate at predicting delta presence (Fig. 7), wherein πdelta>0.5 is considered a prediction that a delta exists, and πdelta<0.5 is considered a prediction that no delta exists.

Figure 7Scatter plot of measured versus predicted delta formation. Eq. (1) was used to calculate the predicted probability of delta formation, πdelta, using rivers with necessary data available; n=477 (2∕3 of which was used for training and 1∕3 used for validation). To compare predicted values from Eq. (1) to our collected data the binary observation of delta presence or absence was transformed into a continuous variable. To do this we created 20 equal intervals (πdelta=0.05 bin widths) and averaged πdelta values. Ld is calculated for each bin as the number of rivers with deltas divided by the total number of rivers. The dashed line represents a 1:1 relationship.
This empirically derived relationship can be used to calculate the probability that a certain combination of the most important environmental variables will form a delta. For example, using environmental variable values for the Godavari River in the right-hand side (RHS) of Eq. (1) results in RHS=3.93. The probability that the Godavari River should form a delta is . Thus, the environmental variables that conspire to form the Godavari River are very likely to form a delta, which is not surprising given the existence of the large Godavari River delta.
4.1 Which environmental variables most strongly control delta formation?
We have considered the relationships between eight environmental variables and delta formation. However, determining which variables are most dominant is not straightforward. After all, most combinations of environmental variables that exist globally completely suppress delta formation (60 % of the rivers included in this dataset do not have a delta). Our likelihood analysis shows that deltas are more likely to form at river mouths with large water discharge Qw (Fig. 5a), sediment discharge Qs (Fig. 5b), and drainage basin area (Fig. 5c), as well as with small significant wave heights Hw (Fig. 6a) and tidal ranges Ht (Fig. 6b). Results suggest that upstream variables exert a primary control. Increasing upstream variables (Qw, Qs, Ab) across their value range accounts for the full range of delta likelihood – that is, the smallest Qw, Qs, and Ab values have Ld≈0, and the largest Qw, Qs, and Ab have Ld≈1 (Fig. 5). Downstream variables seem to be of secondary importance for forming deltas. Increasing the downstream variables (Hw, Ht) decreases the likelihood that a river forms a delta but does not produce the full range of possible Ld values. At the lowest values of Hw and Ht delta likelihood is still 0.5. Furthermore, when we remove Hw and Ht from Eq. (1) the prediction success rate decreases by only 3 %, from 74 % to 71 %.
These controls on delta formation explain the first-order latitudinal variations observed in Figs. 3 and 4. For example, the peaks in water and sediment discharge values from −9 to 30∘ and 60 to 75∘ (Fig. 4) likely explain the similarly located peaks in delta formation (Fig. 3). The suppressing effects of waves and tides can also be seen at a global scale. Low delta formation rates from −57 to −27∘ and 30 to 60∘ are likely due to large Hw and Ht values in these regions, where Qw and Qs are low (Figs. 3, 4). Moreover, the zone from 60 to 75∘ that has increased Qw and Qs values (Fig. 3) also has some of the lowest Hw and Ht values (Fig. 4). Thus, while high Qw and Qs values in this region promote delta formation, the decreased Hw and Ht values also allow delta formation to occur.
Downstream bathymetric slope (Sb) displays a complex relationship with delta likelihood. At slopes <0.006, delta likelihood decreases with increasing slope (Fig. 6c). This is likely because, all else being equal, deeper areas should take longer to fill with sediment and they are also less effective at damping incoming waves and tides. Interestingly, for slopes >0.006, delta likelihood increases with steeper slopes, which is more difficult to explain. Based on visual observation, the steeply dipping basins reflect active margins, and the shallowly dipping basin types reflect passive margins, though we did not pursue a more robust confirmation. If these steeper slopes relate to active margins, then larger sediment sizes and higher supply on active margins may explain the different relationship with delta likelihood than that for the shallowly dipping basin types (Audley-Charles et al., 1977; Orton and Reading, 1993; Milliman and Farnsworth, 2011). After all, the supply of coarser sediment to the coast is more easily retained nearshore (Caldwell and Edmonds, 2014), thereby increasing the likelihood of delta formation.
4.2 The roles of rivers, waves, and tides in delta formation
Our data suggest that deltas are fundamentally created by water and sediment discharge, whereas waves, and possibly tides, suppress delta formation. This is consistent with the notion that delta formation is the result of constructive upstream forces set by the river and destructive downstream marine forces (Fisher, 1969, Boyd et al., 1992, Anthony, 2015). This idea, initially proposed by Fisher (1969), provides a different perspective compared to the oft-cited study on delta morphology and formation from Galloway (1975). Galloway's diagram implies that deltaic formation and morphology are the result of the interplay of the river, waves, and tides. In the case of a purely wave-dominated delta, Galloway's diagram would predict a cuspate delta. Instead, our data clearly show that the most wave-dominated delta is no delta at all, consistent with other studies (Nienhuis et al., 2013; Boyd et al.,1992). This suggests to us that the concept of delta formation and morphology might be better cast as a balance between constructive and destructive forces.
If we consider the perspective that delta formation is the result of a balance between constructive and destructive forces, then new questions emerge: how do wave and tidal processes influence the ability of fluvial processes to construct deltas? How stable is the balance between a given set of constructive and destructive forces? Regarding the last question, there are examples of rapid changes in delta morphology through time, which suggests that the balance can be precarious. The Rhône River delta shifted in morphology from channel-network-dominated in the 16th century to its current wave-smoothed shape as floods and sediment loads declined during the Little Ice Age (14th–19th centuries) (Provansal et al., 2015). The Po River delta showed three morphological transitions each time the balance between river and waves changed over the last 4000 years (Anthony et al., 2014). These examples from the past should direct our attention to how the current configuration of deltas might change in the future. We know that anthropogenic climate change is changing wave conditions (Reguero et al., 2019) and humans are drastically changing water discharge and sediment flux to coastal rivers (Syvitski and Milliman, 2007). It is unclear how the coastal deltas of the world will adapt to these changes in boundary conditions. Future work would benefit from linking our empirically derived delta likelihood predictor with metrics of delta morphology to understand when morphological shifts might occur.
River deltas are the final filters of sediment before it is discharged to the global oceans (Sawyer et al., 2015). Although only 40 % of rivers in our dataset form deltas, our results show that 5.9 Bt yr−1, or 85 % of the measured global sediment flux (Milliman and Farnsworth, 2011), enters river deltas before reaching the ocean. This is not entirely surprising because the presence of a delta requires sediment and our data show that sediment-rich rivers tend to create deltas. But we currently do not know what proportion of that sediment is retained in the delta. This retention should be considered when calculating global sediment flux to the oceans (e.g., Milliman and Farnsworth, 2011) because deltas are exceptionally good at impounding sediment since channel networks are optimized to achieve this goal (Edmonds et al., 2011; Tejedor et al., 2016, 2017). Limited calculations suggest deltas can retain up to 30 % of the sediment supplied to them (Goodbred and Kuehl, 2000; Syvitski and Saito, 2007; Kim et al., 2009). However, as we have shown here, certain environmental variables promote sediment accumulation via delta formation, and these same environmental variables may promote sediment retention by certain deltas. Thus, our results may prove useful for quantifying the full, and presently unaccounted for, deltaic sink in the global sediment cycle.
We also propose that our data and analyses have important implications for resource exploration and coastal restoration. Although using Eq. (1) to predict delta formation for modern rivers is somewhat redundant, it may prove useful for predicting past or future delta existence. Ancient deltaic deposits comprise significant hydrocarbon reservoirs, and provided our analysis holds through geologic time, we could predict the presence of deltaic deposits in the rock record if Qw and Qs can be estimated via other paleohydraulic methods. If we use a logistic regression that does not include the less dominant limiting effects of waves and tides, then Eq. (1) becomes
Using this simplified equation, which shows a 71 % success rate when tested using the validation subset, we can predict the likelihood of delta formation for paleoenvironments where sediment and water discharge can be constrained. For example, water and sediment flux estimates for rivers of the Ferron Sandstone in the Cretaceous Western Interior Seaway of the United States (Bhattacharya et al., 2016) suggest that the likelihood of delta formation is 99 %, and indeed the Ferron contains deltaic deposits.This example highlights how our results could be used to predict the presence of deltaic deposits in the rock record in the absence of direct observational evidence.
Looking forward, this relationship can be used to predict future deltaic formation. Global environmental change will continue to put coastal environments at risk, largely by land loss due to accelerated sea level rise and decreased sediment delivery to the coast. Coastal restoration and hazard-mitigation techniques often involve the creation of new deltaic land via controlled river diversions (e.g., Kim et al., 2009), though it can be difficult to predict the risk related to such projects. Predictions made using Eq. (1) can help in the decision-making process concerning setting controllable environmental variables, such as water discharge. For example, in a hypothetical environment where a river diversion is being considered and the current set of environmental variables yields (which suggests that the probability of delta formation is πdelta=0.45), a 600 m3 s−1 increase in Qw alone will increase the probability of delta formation 8 % (from 0.45 to 0.54) (assuming the increased Qw has no effect on other variables).
Based on analysis of a new dataset comprising 5399 coastal rivers that are at least 50 m wide, along with eight environmental variables, we find that only 40 % (2174) of coastal rivers have deltas, and these are unevenly distributed geographically, with delta formation being more likely in latitudes −27 to 30∘ and 60 to 72∘. The likelihood of delta formation increases with increasing sediment flux, water discharge, and basin area, whereas the likelihood decreases with increasing significant wave height and tidal range. Receiving-basin bathymetry has a bimodal effect on the likelihood of delta formation. At slopes less than 0.006, delta formation decreases with increasing slope, but the trend is reversed at slopes greater than 0.006. Recent sea level change and sediment concentration have no clear effect on delta formation. Finally, we derive a logistic regression that predicts the probability of delta formation with an accuracy of 74 %. Together our results suggest that delta formation is a balance between the constructive forces of water and sediment discharge and the destructive forces of waves and tides.
All data are supplied in Table S1 in the Supplement. For upstream variable values, use “M&F_ID(s)” to find in Milliman and Farnsworth (2011).
The supplement related to this article is available online at: https://doi.org/10.5194/esurf-7-773-2019-supplement.
RLC and DAE led the organization of the study and the writing of the paper. RLC performed data analysis. SB performed tidal data compilation. CP contributed to dataset creation strategy. JHN performed wave data compilation. SR performed bathymetric data compilation. All authors contributed to dataset creation and edited the paper.
The authors declare that they have no conflict of interest.
Sea level products were processed by Ssalto/Duacs and distributed by AVISO+ (https://www.aviso.altimetry.fr, last access: 11 August 2018) with support from CNES. We thank Mark Domaracki, Ian Thomas, Kimberly Rhodes, Amanda Whaling, and Steven Adams for helping with data collection and organization.
This research has been supported by the National Science Foundation (grant nos. 1135427, 1426997, and 1812019).
This paper was edited by Sebastien Castelltort and reviewed by Janok Bhattacharya, Jinyu Zhang, and one anonymous referee.
Amante, C. and Eakins, B.: ETOPO1 1 arc-minute global relief model: procedures, data sources and analysis, available at: http://www.ngdc.noaa.gov/mgg/global/global.html (last access: 4 August 2017), 2009.
Anthony, E. J.: Wave influence in the construction, shaping and destruction of river deltas: A review, Mar. Geol., 361, 53–78, 2015.
Anthony, E. J., Marriner, N., and Morhange, C.: Human influence and the changing geomorphology of Mediterranean deltas and coasts over the last 6000 years: from progradation to destruction phase?, Earth-Sci. Rev., 139, 336–361, 2014.
Argus, D. F., Peltier, W. R., Drummond, R., and Moore, A. W.: The Antarctica component of postglacial rebound model ICE-6G_C (VM5a) based upon GPS positioning, exposure age dating of ice thicknesses, and relative sea level histories, Geophys. J. Int., 198, 537–563, https://doi.org/10.1093/gji/ggu140, 2014.
Ashton, A., Murray, A., and Arnoult, O.: Formation of coastline features by large-scale instabilities induced by high-angle waves, Nature, 414, 296–300, 2001.
Audley-Charles, M., Curray, J., and Evans, G.: Location of major deltas, Geology, 5, 341–344, 1977.
Bates, C. C.: Rational theory of delta formation, AAPG Bull., 37, 2119–2162, 1953.
Baumgardner, S. E.: Quantifying Galloway: Fluvial, tidal, and wave influence on experimental and field deltas, ProQuest Dissertations & Theses Global, Ann Arbor, Michigan, 1853205811, 2015.
Bhattacharya, J. P., Copeland, P., Lawton, T. F., and Holbrook, J.: Estimation of source area, river paleo-discharge, paleoslope, and sediment budgets of linked deep-time depositional systems and implications for hydrocarbon potential, Earth-Sci. Rev., 153, 77–110, 2016.
Boyd, R., Dalrymple, R., and Zaitlin, B.A.: Classification of clastic coastal depositional environments, Sediment. Geol. 80, 139–150, 1992.
Caldwell, R. L. and Edmonds, D. A.: The effects of sediment properties on deltaic processes and morphologies: A numerical modeling study, J. Geophys. Res.-Earth, 119, 961–982, 2014.
Carlson, B., Piliouras, A., Muto, T., and Kim, W.: Control of basin water depth on channel morphology and autogenic timescales in deltaic systems, J. Sediment. Res., 88, 1026–1039, 2018.
Chawla, A., Spindler, D. M., and Tolman, H. L.: Validation of a thirty year wave hindcast using the Climate Forecast System Reanalysis winds, Ocean Model., 70, 189–206, 2013.
Coleman, J. M.: Deltas: Processes of Deposition and Models for Exploration, Bergess, Minneapolis, MN, 1976.
Dürr, H. H., Laruelle, G. G., van Kempen, C. M., Slomp, C. P., Meybeck, M., and Middelkoop, H.: Worldwide typology of nearshore coastal systems: defining the estuarine filter of river inputs to the oceans, Estuar. Coast, 34, 441–458, 2011.
Edmonds, D. A.: Restoration sedimentology, Nat. Geosci., 5, 758–759, 2012.
Edmonds, D. A., Paola, C., Hoyal, D. C. J. D., and Sheets, B. A.: Quantitative metrics that describe river deltas and their channel networks, J. Geophys. Res., 116, F04022, https://doi.org/10.1029/2010JF001955, 2011.
Egbert, G. D. and Erofeeva, S. Y.: Efficient inverse modeling of barotropic ocean tides, J. Atmos. Ocean. Tech., 19, 183–204, 2002.
Fagherazzi, S., Edmonds, D. A., Nardin, W., Leonardi, N., Canestrelli, A., Falcini, F., Jerolmack, D. J., Mariotti, G., Rowland, J. C., and Slingerland, R. L.: Dynamics of river mouth deposits, Rev. Geophys., 53, 642–672, 2015
Fisher, W. L.: Facies characterization of Gulf coast basin delta systems, with some Holocene analogues, Transactions, Gulf Coast Association of Geological Societies, Texas, 239–261, 1969.
Galloway, W. E.: Process framework for describing the morphologic and stratigraphic evolution of deltaic depositional systems, in: Deltas: Models for Exploration, edited by: Broussard, M. L., Houston Geological Society, Houston, TX, 87–98, 1975.
Giosan, L., Syvitski, J., Constantinescu, S., and Day, J.: Climate change: protect the world's deltas, Nature, 516, 31–33, 2014.
Goodbred Jr., S. L. and Kuehl, S. A.: Enormous Ganges-Brahmaputra sediment discharge during strengthened early Holocene monsoon, Geology, 28, 1083–1086, 2000.
Hoitink, A., Wang, Z., Vermeulen, B., Huismans, Y., and Kästner, K.: Tidal controls on river delta morphology, Nat. Geosci., 10, 637–645, https://doi.org/10.1038/ngeo3000, 2017.
Iglewicz, B. and Hoaglin, D. C.: How to detect and handle outliers, ASQ Press, Milwaukee, Wisconsin, 1993.
Jerolmack, D. J.: Conceptual framework for assessing the response of delta channel networks to Holocene sea level rise, Quaternary Sci. Rev., 28.17–1,8 1786–1800, 2009.
Jiménez-Robles, A., Ortega-Sánchez, M., and Losada, M.: Effects of basin bottom slope on jet hydrodynamics and river mouth bar formation, J. Geophys. Res.-Earth, 121, 1110–1133, 2016.
Kim, W., Mohrig, D., Twilley, R., Paola, C., and Parker, G.: Is it feasible to build new land in the Mississippi River Delta?, Eos Trans. AGU, 90, 373–374, 2009.
Lentsch, N., Finotello, A., and Paola, C.: Reduction of deltaic channel mobility by tidal action under rising relative sea level, Geology, 46, 599–602, 2018.
Limber, P. W., Murray, A. B., Adams, P. N., and Goldstein, E. B.: Unraveling the dynamics that scale cross-shore headland relief on rocky coastlines: 1. Model development, J. Geophys. Res.-Earth, 119, 854–873, 2014.
Milliman, J. D. and Farnsworth, K. L.: River discharge to the coastal ocean: a global synthesis, Cambridge University Press, New York, 2011.
Milliman, J. D. and Meade, R. H.: World-wide delivery of river sediment to the oceans, J. Geol., 91, 1–21, 1983.
Milliman, J. D. and Syvitski, J. P. M.: Geomorphic/tectonic control of sediment discharge to the ocean; the importance of small mountainous rivers, J. Geol., 100, 525–544, 1992.
Nienhuis, J. H., Ashton, A. D., Roos, P. C., Hulscher, S. J., and Giosan, L.: Wave reworking of abandoned deltas, Geophys. Res. Lett., 40, 5899–5903, 2013.
Nienhuis, J. H., Ashton, A. D., and Giosan, L.: What makes a delta wave-dominated?, Geology, 43, 511–514, 2015.
Nienhuis, J. H., Hoitink, A., and Törnqvist, T. E.: Future change to tide-influenced deltas, Geophys. Res. Lett., 45, 3499–3507, 2018.
Nyberg, B. and Howell, J. A.: Global distribution of modern shallow marine shorelines. Implications for exploration and reservoir analogue studies, Mar. Petrol. Geol., 71, 83–104, 2016.
Orton, G. J. and Reading, H. G.: Variability of deltaic processes in terms of sediment supply, with particular emphasis on grain size, Sedimentology, 40, 475–512, 1993.
Paola, C., Twilley, R., Edmonds, D., Kim, W., Mohrig, D., Parker, G., Viparelli, E., and Voller, V.: Natural Processes in Delta Restoration: Application to the Mississippi Delta, Annu. Rev. Mar. Sci, 3, 3.1–3.25, 2011.
Porebski, S. J. and Steel, R. J.: Deltas and sea-level change, J. Sediment. Res., 76, 390–403, 2006.
Pratson, L. F., Nittrouer, C. A., Wiberg, P. L., Steckler, M. S., Swenson, J. B., Cacchione, D. A., Karson, J. A., Murray, A. B., Wolinsky, M. A., and Gerber, T. P.: Seascape evolution on clastic continental shelves and slopes, in: Continental Margin Sedimentation: From Sediment Transport to Sequence Stratigraphy: International Association of Sedimentologists, Special Publication 37, edited by: Nittrouer, C., Austin, J., Field, M., Kravitz, J., Syvitski, J., and Wiberg, P., 339–380, 2007.
Provansal, M., Pichard, G., and Anthony, E. J.: Geomorphic changes in the Rhône delta during the LIA: input from the analysis of ancient maps, in: Sediment Fluxes in Coastal Areas, edited by: Maanan, M. and Robin, M., Springer, Dordrecht, the Netherlands, 47–72, 2015.
Reguero, B. G., Losada, I. J., and Méndez, F. J.: A recent increase in global wave power as a consequence of oceanic warming, Nat. Commun., 10, 205, https://doi.org/10.1038/s41467‐018‐08066‐0, 2019.
Rovai, A. S., Twilley, R. R., Castañeda-Moya, E., Riul, P., Cifuentes-Jara, M., Manrow-Villalobos, M., Horta, P. A., Simonassi, J. C., Fonseca, A. L., and Pagliosa, P. R.: Global controls on carbon storage in mangrove soils, Nat. Clim. Change, 1, 534–538, 2018.
Sawyer, A. H., Edmonds, D. A., and Knights, D.: Surface water-groundwater connectivity in deltaic distributary channel networks, Geophys. Res. Lett., 42, 10299–210306, 2015.
Slingerland, R. and Smith, N. D.: River avulsions and their deposits, Annu. Rev. Earth Pl. Sc., 32, 257–285, 2004.
Stanley, D. J. and Warne, A. G.: Worldwide Initiation of Holocene Marine Deltas by Deceleration of Sea-Level Rise, Science, 265, 228–231, 1994.
Syvitski, J. and Saito, Y.: Morphodynamics of deltas under the influence of humans, Global Planet. Change, 57, 261–282, 2007.
Syvitski, J. P. and Morehead, M. D.: Estimating river-sediment discharge to the ocean; application to the Eel margin, Northern California, Mar. Geol., 154, 13–28, 1999.
Syvitski, J. P. M., Peckham, S. D., Hilberman, R., and Mulder, T.: Predicting the terrestrial flux of sediment to the global ocean; a planetary perspective, Sediment. Geol., 162, 5–24, 2003.
Syvitski, J. P. M., Kettner, A. J., Correggiari, A., and Nelson, B. W.: Distributary channels and their impact on sediment dispersal, Mar. Geol., 222, 75–94, 2005.
Syvitski, J. P. M. and Milliman, J. D.: Geology, Geography, and Humans Battle for Dominance over the Delivery of Fluvial Sediment to the Coastal Ocean, J. Geol., 115, 1–19, 2007.
Tejedor, A., Longjas, A., Caldwell, R., Edmonds, D. A., Zaliapin, I., and Foufoula-Georgiou, E.: Quantifying the signature of sediment composition on the topologic and dynamic complexity of river delta channel networks and inferences toward delta classification, Geophys. Res. Lett., 43, 3280–3287, 2016.
Tejedor, A., Longjas, A., Edmonds, D. A., Zaliapin, I., Georgiou, T. T., Rinaldo, A., and Foufoula-Georgiou, E.: Entropy and optimality in river deltas, P. Natl. Acad. Sci. USA, 114, 11651–11656, 2017.
Tessler, Z., Vörösmarty, C., Grossberg, M., Gladkova, I., Aizenman, H., Syvitski, J., and Foufoula-Georgiou, E.: Profiling risk and sustainability in coastal deltas of the world, Science, 349, 638–643, 2015.
Tolman, H. L.: User manual and system documentation of WAVEWATCH III TM version 3.14, Technical note, MMAB Contribution, 276, College Park, Maryland, USA, 220 pp.,
Twilley, R. R., Bentley, S. J., Chen, Q., Edmonds, D. A., Hagen, S. C., Lam, N. S.-N., Willson, C. S., Xu, K., Braud, D., Hampton Peele, R., and McCall, A.: Co-evolution of wetland landscapes, flooding, and human settlement in the Mississippi River Delta Plain, Sustain. Sci., 11, 1–21, https://doi.org/10.1007/s11625-016-0374-4, 2016.
Twilley, R. R., Rovai, A. S., and Riul, P.: Coastal morphology explains global blue carbon distributions, Front. Ecol. Environ., 16, 1–6, https://doi.org/10.1002/fee.1937, 2018.
Wessel, P. and Smith, W. H.: A global, self-consistent, hierarchical, high-resolution shoreline database, J. Geophys. Res.-Earth, 101, 8741–8743, 1996.
Woodroffe, C. D., Nicholls, R. J., Saito, Y., Chen, Z., and Goodbred, S. L.: Landscape variability and the response of Asian megadeltas to environmental change, in: Global change and integrated coastal management, Springer, Dordrecht, the Netherlands, 277–314, 2006.
Wright, L. D.: Sediment transport and deposition at river mouths: A synthesis, Geol. Soc. Am. Bull., 88, 857–868, 1977.
Wright, L. D., Coleman, J. M., and Erickson, M. W.: Analysis of Major River Systems and Their Deltas: Morphologic and Process Comparisons, Coastal Studies Institute, Louisiana State University, Baton Rouge, LA, 1974.