the Creative Commons Attribution 4.0 License.
the Creative Commons Attribution 4.0 License.
 | 02 Jun 2020
Seismo-acoustic energy partitioning of a powder snow avalanche
Emanuele Marchetti
Alec van Herwijnen
Marc Christen
Maria Cristina Silengo
Giulia Barfucci
While flowing downhill, a snow avalanche radiates seismic waves in the ground and infrasonic waves in the atmosphere. Seismic energy is radiated by the dense basal layer flowing above the ground, while infrasound energy is likely radiated by the powder front. However, the mutual energy partitioning is not fully understood. We present infrasonic and seismic array data of a powder snow avalanche, which was released on 5 February 2016, in the Dischma valley above Davos, Switzerland. A five-element infrasound array, sensitive above 0.1 Hz, and a seven-element seismic array, sensitive above 4.5 Hz, were deployed at a short distance (<500 m) from each other and close (<1500 m) to the avalanche path. The avalanche dynamics were modelled by using RAMMS (rapid mass movement simulation) and characterized in terms of front velocity and flow height. The use of arrays rather than single sensors allowed us to increase the signal-to-noise ratio and to identify the event in terms of back-azimuth angle and apparent velocity of the recorded wave fields. Wave parameters, derived from array processing, were used to identify the avalanche path and highlight the areas, along the path, where seismic and infrasound energy radiation occurred. The analysis showed that seismic energy is radiated all along the avalanche path, from the initiation to the deposition area, while infrasound is radiated only from a limited sector, where the flow is accelerated and the powder cloud develops. The recorded seismic signal is characterized by scattered back-azimuth angle, suggesting that seismic energy is likely radiated by multiple sources acting at once. On the contrary, the infrasound signal is characterized by a clear variation of back-azimuth angle and apparent velocity. This indicates that infrasound energy radiation is dominated by a moving point source, likely consistent with the powder cloud. Thanks to such clear wave parameters, infrasound is revealed to be particularly efficient for avalanche detection and path identification. While the infrasound apparent velocity decreases as the flow moves downhill, the seismic apparent velocity is quite scattered but decreases to sound velocity during the phase of maximum infrasound radiation. This indicates an efficient process of infrasound to seismic energy transition, which, in our case, increases the recorded seismic amplitude by ∼20 %, at least in our frequency band of analysis. Such an effect can be accounted for when the avalanche magnitude is estimated from seismic amplitude. Presented results clearly indicate how the process of seismo-acoustic energy radiation by a powder avalanche is very complex and likely controlled by the powder cloud formation and dynamics, and the process is hence affected by the path geometry and snow characteristics.
- Article
(6027 KB) - Full-text XML
- BibTeX
- EndNote


As a first approximation, a powder snow avalanche (PSA) can be described with a two-layer model consisting of a dense basal snow layer, with densities of 100–400 kg m−3, and a powder part that develops at the head of the flow, with density of 3–30 kg m−3 (Issler, 2003). PSAs correspond to the intermittent regime (IR) identified from GEORADAR analysis at the Vallée del la Sionne test site by Kohler et al. (2018). They are characterized by intense surging activity, flow heights up to 9 m, front velocities up to 60 m s−1 and develop once the snow temperature is ∘C. Carrol et al. (2013) provided a detailed analytical description of the powder front of a PSA in terms of an eruption current. They showed how the front evolution is mostly controlled by the amount of snow scoured from the snowpack, as the front moves downhill. This erosion depends on the characteristics of the snowpack, such as density, temperature, and channel morphology (see Louge et al., 2012; Carrol et al., 2013). The formation of the powder front is enhanced by the narrowing of the avalanche channel, while the front spreading causes deceleration and consequent collapse of the front. Moreover, Steinkogler et al. (2014) showed how the evolution of the powder cloud is affected by the temperature of the snow cover. They showed that a temperature of −2 ∘C of the scoured snow is a threshold value, with the cloud formation inhibited for “warm avalanches”.
While flowing downhill, the interaction of the dense basal flow with the ground radiates seismic energy (Sabot et al., 1998). Infrasound energy is radiated by the compression of the atmosphere produced mostly by the powder front (see Schaerer and Salway, 1980; Bedard, 1989). The ratio between the dense and powder layers of a snow avalanche, and hence between the seismic and infrasound energy radiation, is not constant due to front evolution through time (Carrol et al., 2013).
Seismic measurements have been widely applied to investigate avalanche dynamics and characteristics. Sabot et al. (1998) showed that slope changes and the presence of obstacles on the flow path strongly affect the radiation of seismic energy. Moreover, characteristics of recorded seismic signals depend on snow density, avalanche type and size (Biescas et al., 2003; van Herwijnen and Schweizer, 2011b; Vilajosana et al., 2007b). Seismic monitoring techniques deploying multiple sensors along the avalanche path (Biescas et al., 2003; Vilajosana et al., 2007a) or arrays (van Herwijnen and Schweizer, 2011a; Lacroix et al., 2012; Heck et al., 2017) allow for identification of the avalanche occurrence within a source-to-receiver distance of up to ∼3 km. Hammer et al. (2017) recorded very large avalanches up to 30 km away.
After the pioneering study by Bedard (1989), the use of the infrasound in avalanche monitoring and research has increased significantly (Chritin et al., 1996; Adam et al., 1998; Comey and Mendenhall, 2004). Naugolnykh and Bedard (1990) suggested that infrasound is possibly induced by the non-stationary motion and/or by the turbulence of the flow. Moreover, they suggested that the amplitude and frequency of the recorded infrasound signals should scale with the avalanche size and velocity.
Since then, infrasound avalanche observations improved substantially, both in number and accuracy. The development and use of infrasound arrays instead of single sensors (Scott et al., 2007; Ulivieri et al., 2011; Havens et al., 2014; Marchetti et al., 2015) allows for an increased signal-to-noise ratio and improves the investigation of the avalanche infrasound signature. Specific wave parameters (back-azimuth angle and apparent velocity) of recorded signals were used to define array processing procedures, able to detect medium-sized snow avalanches at distances of a few kilometres (Ulivieri et al., 2011; Marchetti et al., 2015; Mayer et al., 2018). Moreover, infrasound array-derived information was used to remotely evaluate the avalanche front position and velocity through time (Marchetti et al., 2015; Havens et al., 2014).
While geophysical observations of snow avalanches have significantly improved the monitoring techniques, a robust conceptual model of seismic and infrasound energy radiation is still missing. Previous studies based on infrasound and seismic records allowed for the investigation of some mutual characteristics (Surinach et al., 2001; Kogelnig et al., 2011). Kogelnig et al. (2011), in particular, analysed four avalanches at the Vallée de la Sionne test site and showed that infrasound and seismic energy and amplitude were roughly correlated to the extent of aerosol and dense layer, respectively. Moreover, they modelled the infrasound energy radiation in terms of a moving turbulent sound source, where the infrasound amplitude is modelled as proportional to the flow speed and height of the powder cloud. However, many open questions remain with regards to using infrasound and seismic signals to infer avalanche size. It is well known that seismic and infrasound energy interact at the earth free surface and are transmitted between the atmosphere and solid earth (Ichihara et al., 2012). The transmission affects the amplitude of recorded signal and should be considered when signal characteristics are used to constrain the source process or to calculate the energy of the event.
In this work, we present a combined seismic and infrasound array analysis for a snow slab avalanche that occurred on 5 February 2016, in the Dischma Valley, south of Davos, Switzerland. The event was recorded by a seismic array and an infrasound array located nearby (less than 1500 m) the path. The data obtained from the seismic array and the infrasound array are used to investigate the mutual energy radiation as a function of the front position along the avalanche path. To investigate the properties of recorded signals as a function of event characteristics, the avalanche was modelled using the avalanche simulation software RAMMS (Christen et al., 2010).
During the winter of 2015–2016 a seismic array and an infrasound array were located, at a short distance (<500 m) from each other, in the Dischma valley, south of Davos, in the eastern Swiss Alps (Fig. 1). The installation site is a flat area, at an elevation of ∼2000 m a.s.l. surrounded by peaks rising up to ∼3000 m. On 5 February 2016, a snow slab avalanche released from Chlein Sattelhorn and was recorded both by the seismic array and the infrasound array (Figs. 1 and 2a).
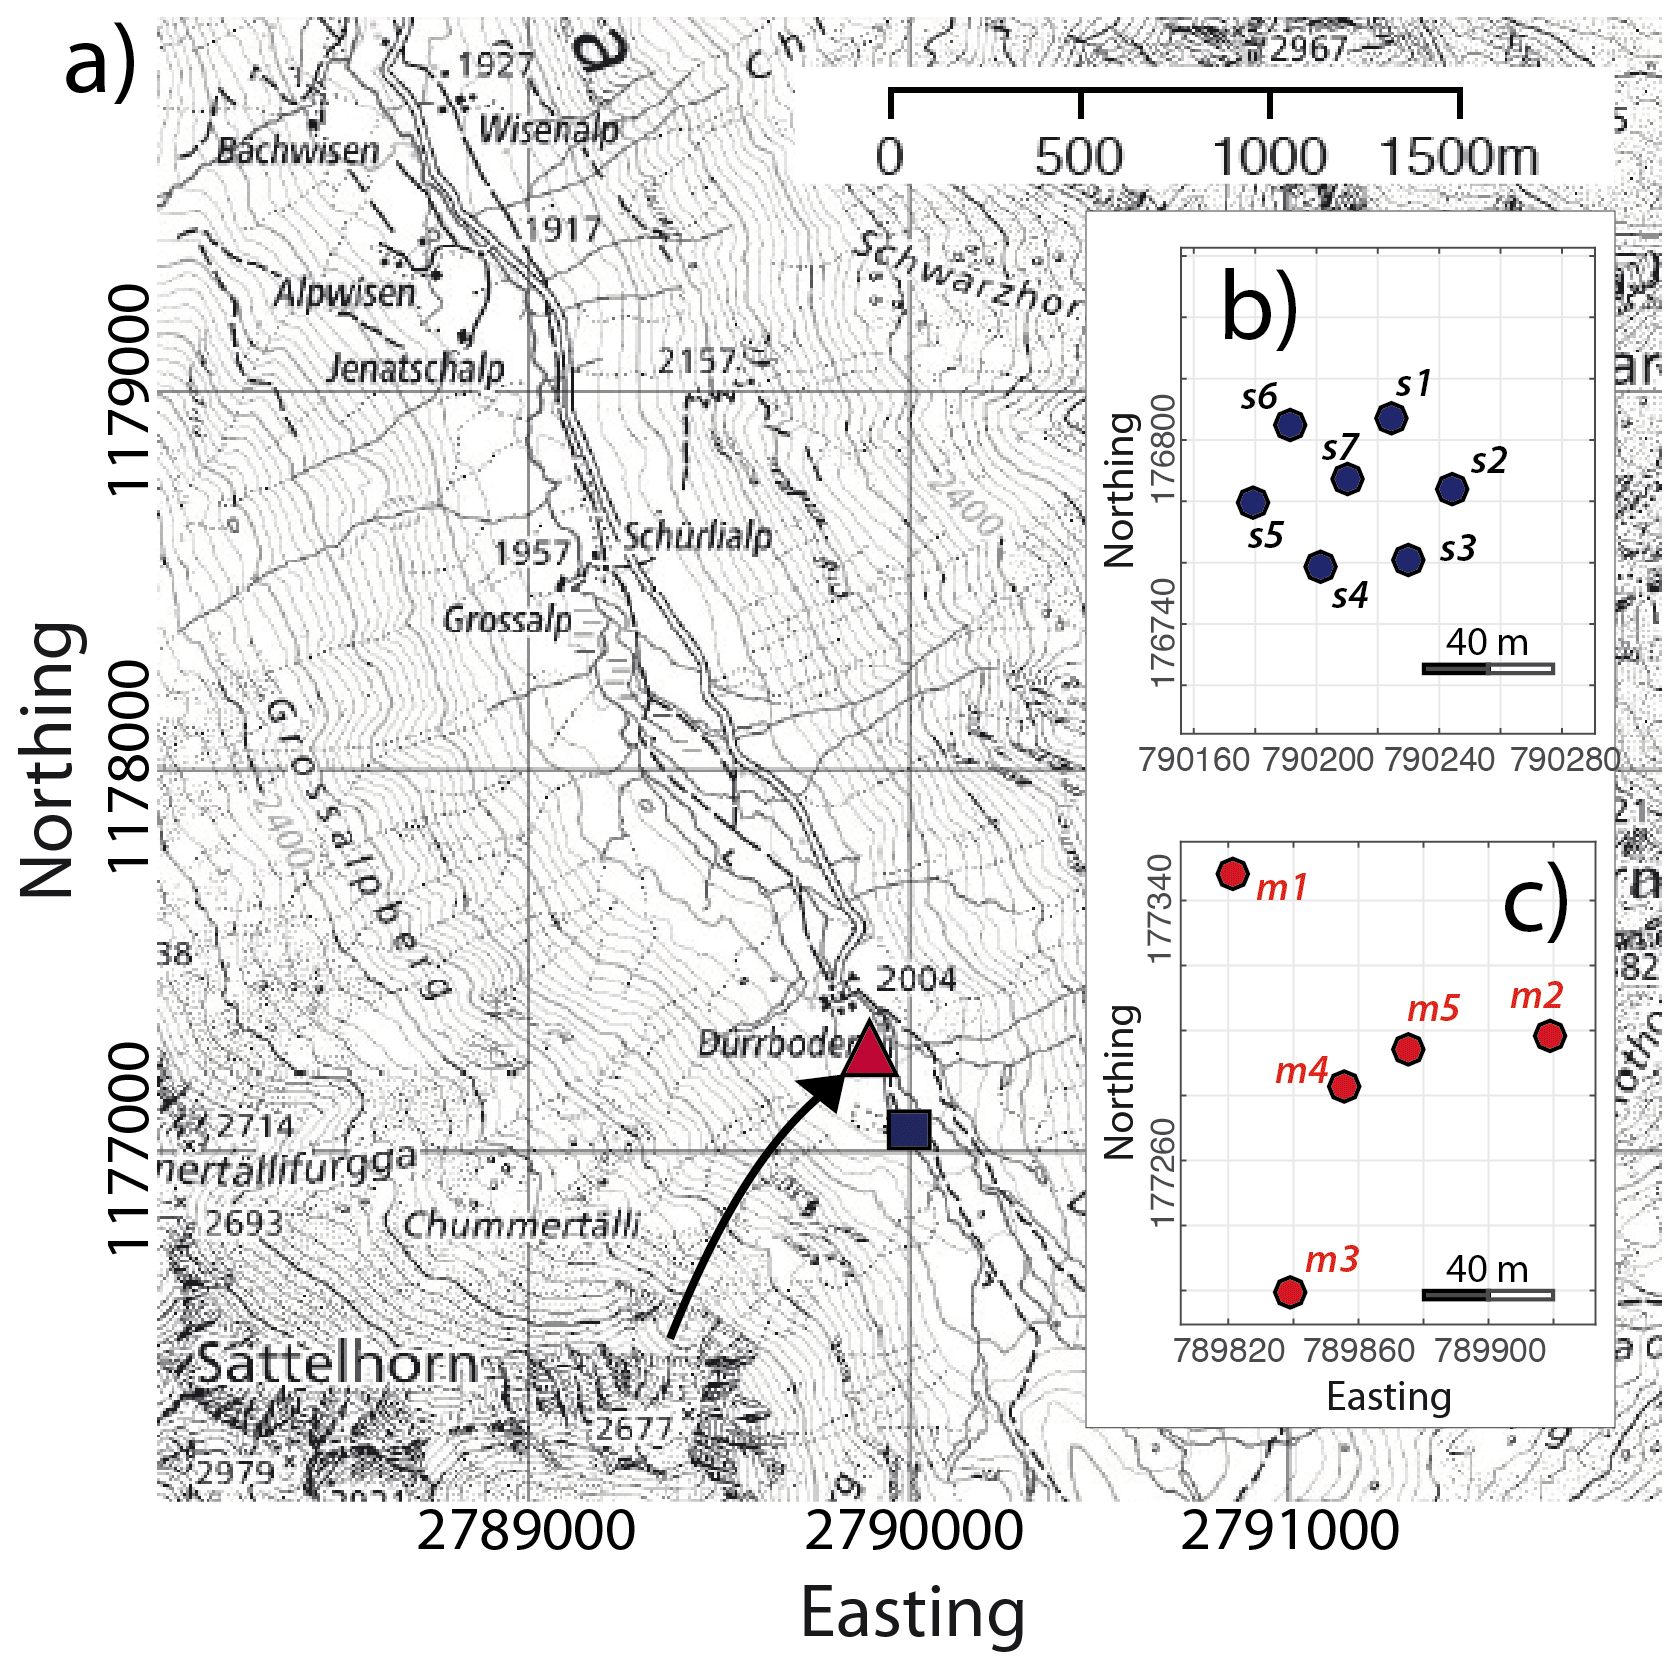
Figure 1Map (a) showing the location of the Dischma valley, south of Davos, Switzerland. The location of the infrasound array (red triangle) and the seismic array (blue square) are shown, as well as the Chlein Sattelhorn avalanche path (black arrow). Positions are given in Swiss coordinates (CH1903). Reproduced with permission of swisstopo (JA100118). Details of the geometry of the seismic (b) and infrasound arrays (c).
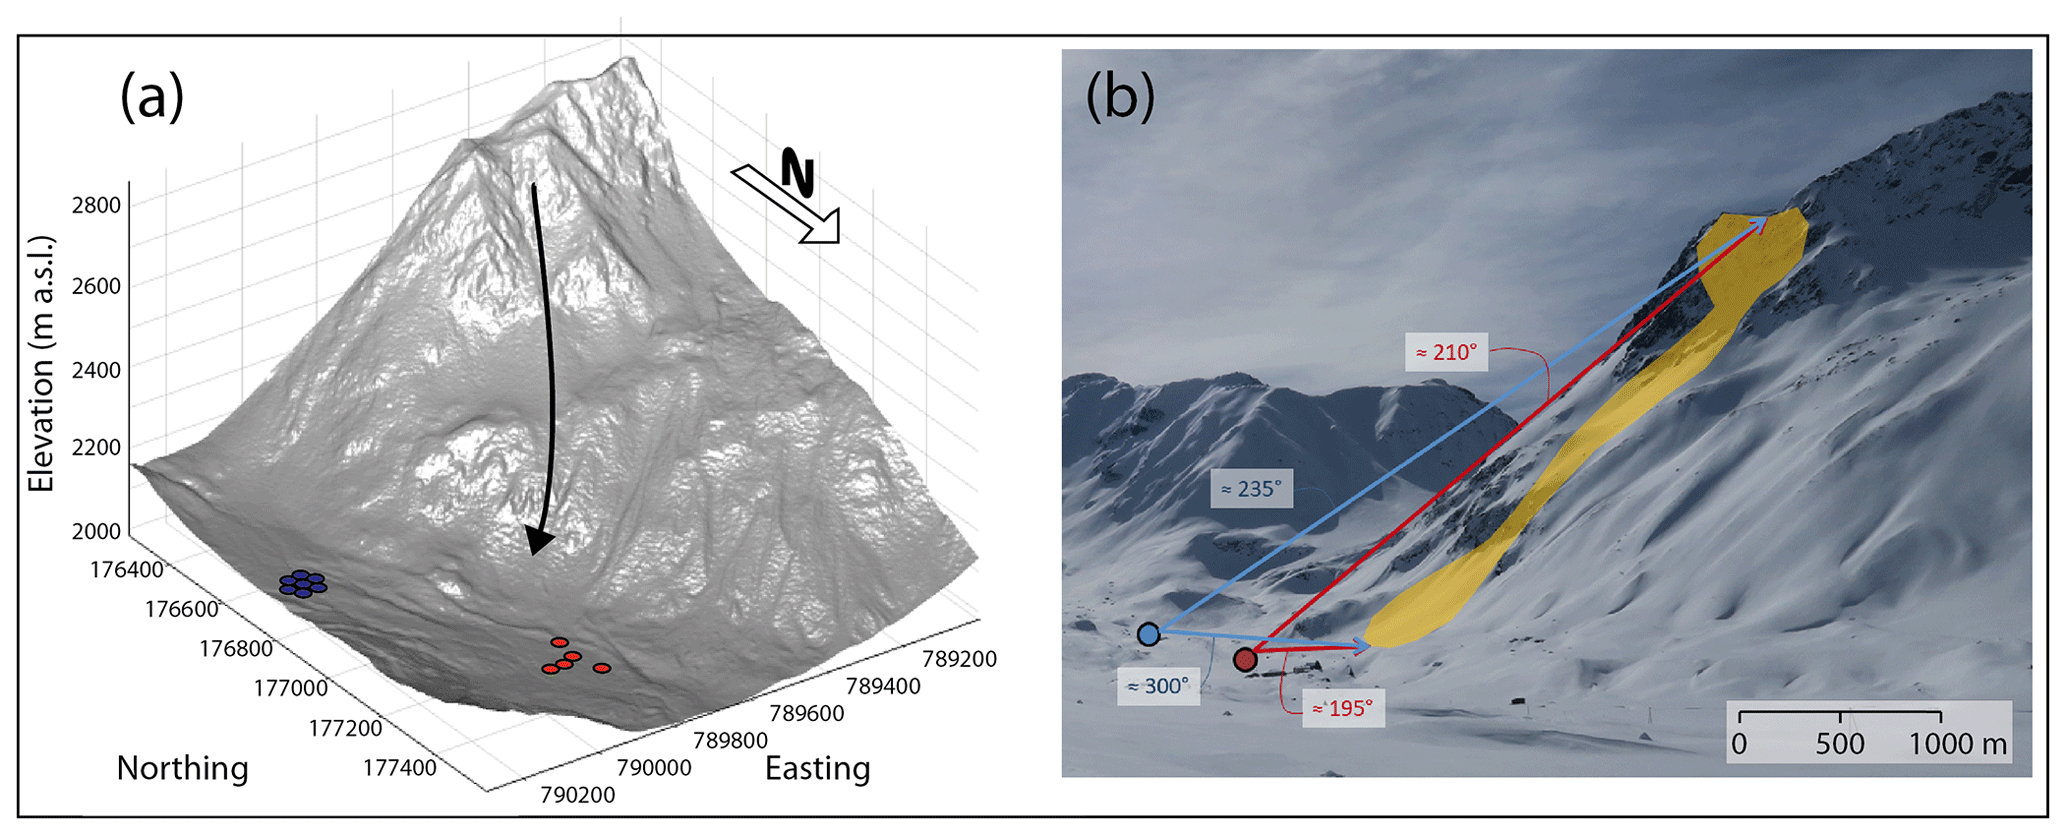
Figure 2(a) Digital elevation model (DEM) showing the installation site within the Dischma valley, south of Davos, Switzerland, with the position of the seismic array (blue dots), the infrasound array (red dots) and the Chlein Sattelhorn avalanche path (black arrow). (b) Photo of the field site with the position of the seismic array (blue dot), the infrasound array (red dot) and the approximate contour of the Chlein Sattelhorn avalanche from 5 February 2016 (orange). The approximate back-azimuth angles to the start zone and maximum run-out zone of the avalanche relative to the seismic array and infrasound array are also shown (coloured arrows).
The seismic array (Seismic Instruments Inc.) consisted of seven elements deployed with a circular geometry and maximum aperture (maximum distance between two array elements) of 75 m (Fig. 1b). The array was equipped with vertical geophones with a corner frequency of 4.5 Hz and a sensitivity of 28.8 V m−1 s−1. The geophones were attached with anchors to large rocks on the ground and subsequently buried by snow, which substantially reduced the effect of wind noise. Seismic data were sampled at each geophone at 500 Hz and 24 bit precision. Data were recorded locally at the central acquisition system. The entire system was powered with solar panels and batteries, and the total power requirement was approximately 7 W.
The infrasound array (FIBRA; https://www.item-geophysics.it/, last access: May 2020) operated with fibre optic connections among the five different array elements. The fibre optic connection allows us to increase significantly the signal-to-noise ratio and prevents the risk of damage related to lightning or electric discharges. The array was deployed following a triangular geometry, with two central elements, and had a maximum aperture of 160 m (Fig. 1c). Each array element was equipped with a differential pressure transducer (prs025a), with a sensitivity of 400 mV Pa−1 in the pressure range of ±12.5 Pa and a frequency response between 0.01 and 200 Hz. Analogue pressure data were converted to digital signals at each array element, with a sampling rate of 50 Hz and 16 bit dynamics, and they were transmitted trough fibre optic to a central unit, where data were synchronized with GPS timing. Power requirement was ∼1 W for the central unit and as low as ∼0.1 W for the array element.
The data recorded by the two arrays were synchronized by comparing the timing of local and regional earthquakes recorded by both arrays. Considering a propagation velocity < 2000 m s−1 and a distance of <500 m between the two arrays, such an approach guarantees a timing accuracy of <2 s, which is sufficient for the seismo-acoustic comparison presented here.
The study site was also equipped with automatic cameras collecting images every 10 min, used to visually monitor the activity on the slopes surrounding the arrays. The camera system was co-located with the central element of the infrasound array.
In the morning of 5 February 2016, at 05:18 UT, a medium-sized dry-snow avalanche released from Chlein Sattelhorn (Fig. 2b), at an elevation of ∼2600 m. The avalanche travelled a distance of 1200 m and stopped at the bottom of the Dischma valley, at an elevation of ∼2030 m at a short distance (<100 m) from the infrasound array (Fig. 3). The event occurred during a snow storm. Nevertheless, based on the images from the automatic cameras, we confirmed that the avalanche released between 4 February 2016 at 17:40 UT and 6 February 2016 at 07:40 UT. The avalanche deposit was first clearly visible on the morning of 6 February (08:30 UT), when the weather cleared (Fig. 3b).
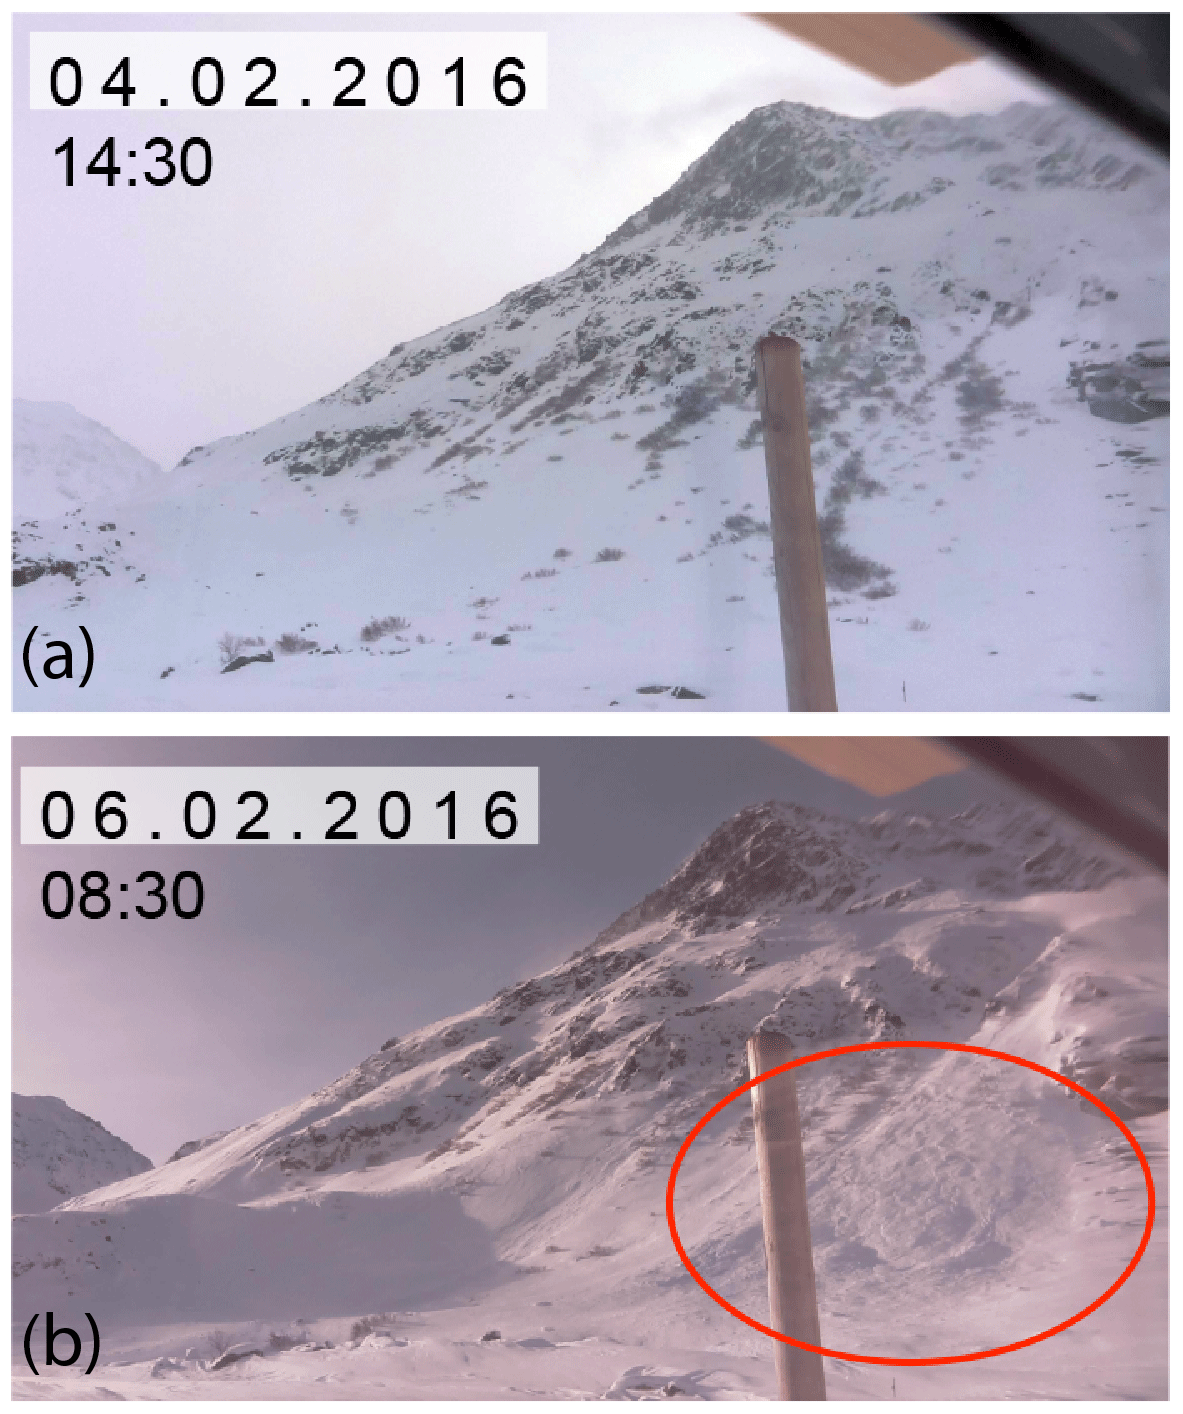
Figure 3Photos showing the slope west from the infrasound array in the afternoon of 2 February (a, last clear image before the event) and in the morning of 6 February 2016 (b, first clear image after the event) that show the avalanche accumulation area.
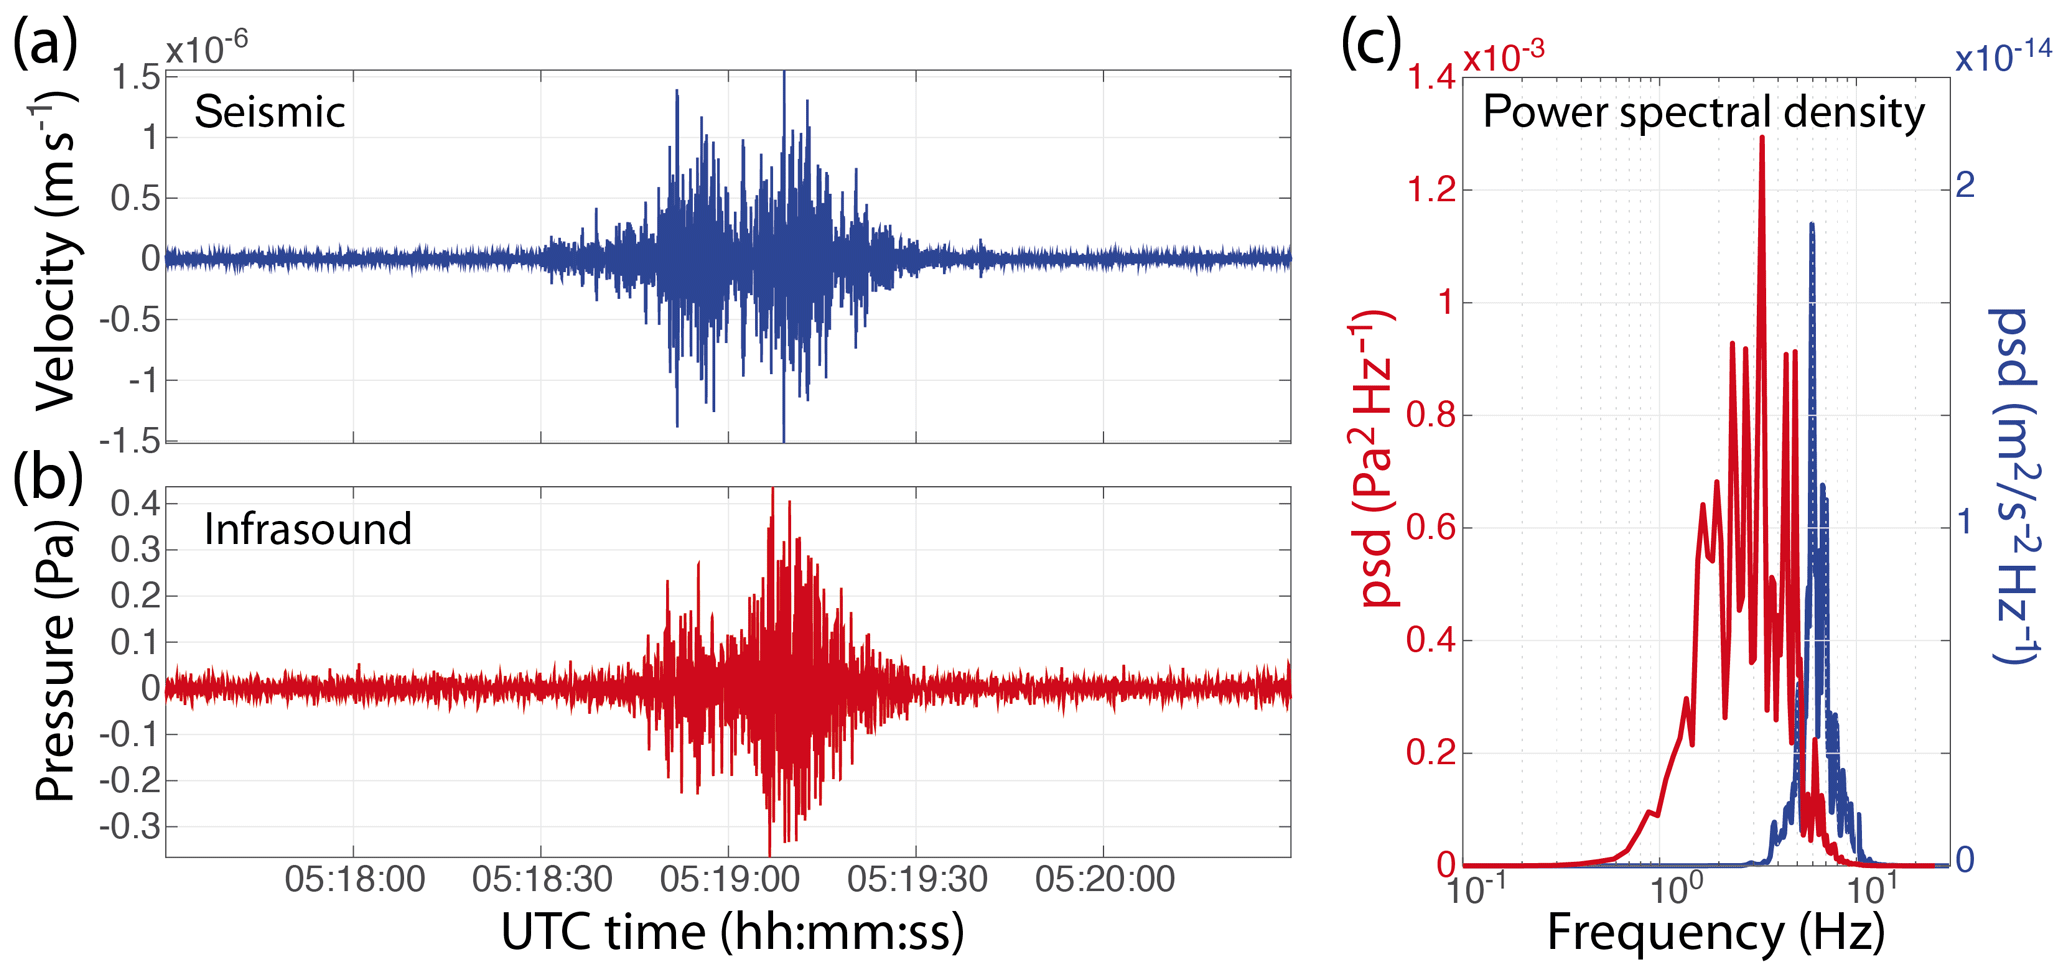
The event from 5 February 2016 was clearly recorded by the seismic and infrasound arrays (Fig. 4a and b) (Marchetti et al., 2020). The seismic signal has an emergent waveform and had a duration of ∼60 s. It is characterized by two phases of similar amplitudes ( m s−1), peaking around 05:18:50 and 05:19:20 UT. The signal spectrum shows energy mostly confined between 3.5 and 12 Hz, with the peak frequency around 6 Hz. The frequency response of the geophones limits the spectral analysis to frequencies > 4.5 Hz (Fig. 4c); therefore, we cannot exclude lower-frequency components. The infrasound record of the event is shorter (∼45 s) and has a similar emergent waveform, with two sperate phases reaching a maximum amplitude of ∼0.5 Pa (Fig. 4b). The spectral energy of the infrasound signal is wider, spanning between 0.5 and 8 Hz, with a clear peak at ∼3.3 Hz (Fig. 4c).
The infrasound and seismic data were processed using a multichannel correlation analysis to identify signal from noise in terms of signal back-azimuth angle (referred to as back-azimuth hereafter) and apparent velocity. The procedure, described in detail by Ulivieri et al. (2011), identifies coherent data recorded within a given time window assuming planar wavefront propagation. Once a coherent signal is identified, based on a signal correlation threshold (>70 %), the corresponding back-azimuth (Baz) is calculated. The back-azimuth corresponds to the propagation angle from the array to the source, measured with respect to the geographic north in the horizontal plane of the array. Once the back-azimuth is identified, the apparent velocity (ca) is calculated as the ratio between the real propagation velocity (c) and the sine of the take-off angle (). The apparent velocity corresponds to the velocity the wave would have if it was travelling in the plane of the array and increases for higher elevation sources. It would be infinite for a source located directly above the array, as all the elements of the array would record the signal simultaneously.
In the specific case of snow avalanches, i.e. a source moving downhill, the apparent velocity is expected to decrease with time (Marchetti et al., 2015). Similarly, depending on the movement of the avalanche relative to the array, the back-azimuth is expected to change with time. This aspect has been used to identify snow avalanches from other sources with infrasound array analysis, allowing for real-time monitoring and identification of snow avalanches at source-to-receiver distances of several kilometres (Marchetti et al., 2015; Ulivieri et al., 2011; Mayer et al., 2018).
Following the approach described by Marchetti et al. (2015), we use the back-azimuth and the apparent velocity of the seismic and the infrasound detections to investigate the position along the avalanche path considering a point source, where the different portions of the signals are generated. For each point of the DEM, we calculate the corresponding values of back-azimuth from the seismic (Bazs) and infrasound (Bazi) arrays, as well as the expected values of apparent velocity (ca) of the recorded infrasound wave field (Fig. 5). We obtain a map of theoretical values, showing the expected values for the seismic and infrasound wave parameters produced by any point source located on the DEM. A point source moving along any path on the topography would therefore be recorded with values of back-azimuth and apparent velocity, varying according to the theoretical values.

Figure 5Theoretical values of back-azimuth at the seismic array (Bazs (∘ N), a), back-azimuth at the infrasound array (Bazi (∘ N), b) and apparent velocity (ca (m s−1), c) at the infrasound array for any point source of seismic and infrasound energy located on the DEM. The product between back-azimuth and apparent velocity of the infrasound wave field is also given (BV, d). The position of the infrasound and seismic arrays are shown by red and blue circles, respectively.
The back-azimuth provides an estimate of the source position in the horizontal plane defined by the array, while apparent velocity is reflecting the source elevation. As expected, the map shows that the back-azimuth varies between 0 and 360∘ around the seismic and infrasound arrays (Fig. 5a and b), independently of the elevation and the distance from the array. The infrasound apparent velocity changes, according to the local topography, from a minimum of 330 m s−1 up to a maximum value of 400 m s−1 (Fig. 5c), solely affected by the distance from the array and the absolute elevation. Therefore, a proxy of the 3D source position requires combining back-azimuth and apparent velocity. We account simultaneously for back-azimuth and apparent velocity by calculating for each point of the DEM the product (BV = Bazi×ca) of theoretical values (Fig. 5d). The resulting parameter defines a new map, with values depending on both the planar position and source elevation. Such an approach can be easily applied to infrasound wave parameters, while the use of the apparent velocity derived for the seismic wave field appears complicated by variable phases and complex source-to-receiver travel paths.
In order to correlate the infrasound and seismic wave parameters with avalanche flow characteristics and evolution (flow depth and velocity), we performed flow modelling by using RAMMS (Fig. 8) (Christen et al., 2010). We used RAMMS::Avalanche (version 1.7.20) for the simulations of Chlein Sattelhorn. The model requires a detailed digital elevation model (DEM) as well as an estimate of the initial release volume, i.e. an initial release area and a fracture depth. The initial DEM is the swissAlti3D DEM (2 m grid resolution). For the simulation, we did a bilinear interpolation to 5 m. We used calibrated friction values for small avalanches, with a return period of 10 years and modelled flow depth and flow velocity along the flow channel trough time with a time lapse of 2 s.
For the avalanche recorded on 5 February 2016, a multichannel correlation analysis was performed over time windows of 5 s and with an overlap of 4.5 s for both the seismic and for the infrasound data. According to the recorded frequency spectrum (Fig. 4c), the infrasound and seismic data were bandpass filtered between 1 and 10 Hz. The event then appears as a cluster of detections (Fig. 6), each associated with a corresponding value of back-azimuth (Baz) and apparent velocity (ca), calculated for each signal time window. From Fig. 6, infrasound signal starts to be detected at 05:18:50 UTC, with a back-azimuth of 211∘ N and an apparent velocity of 365 m s−1. The apparent velocity decreases monotonically to 327 m s−1, until 05:19:15 UTC, while the back-azimuth remains quite stable for the first 15 s of the recorded signal, until 05:19:05 UTC, and decreases down to 200∘ N afterwards. Such a variation of apparent velocity and back-azimuth is consistent with the path followed by the observed event, which moves initially north to north-west towards the array (20∘ N, back-azimuth from the array 210∘ N) to turn clockwise along the path when the flow moves downhill (Fig. 3). Between 05:19:15 and 05:19:25 UTC, the back-azimuth is quite stable, while the apparent velocity increases up to ∼350 m s−1. We interpret this variation as an artefact, resulting from the short distance between the accumulation area and the array (<200 m), thereby violating the planar wavefront assumption.
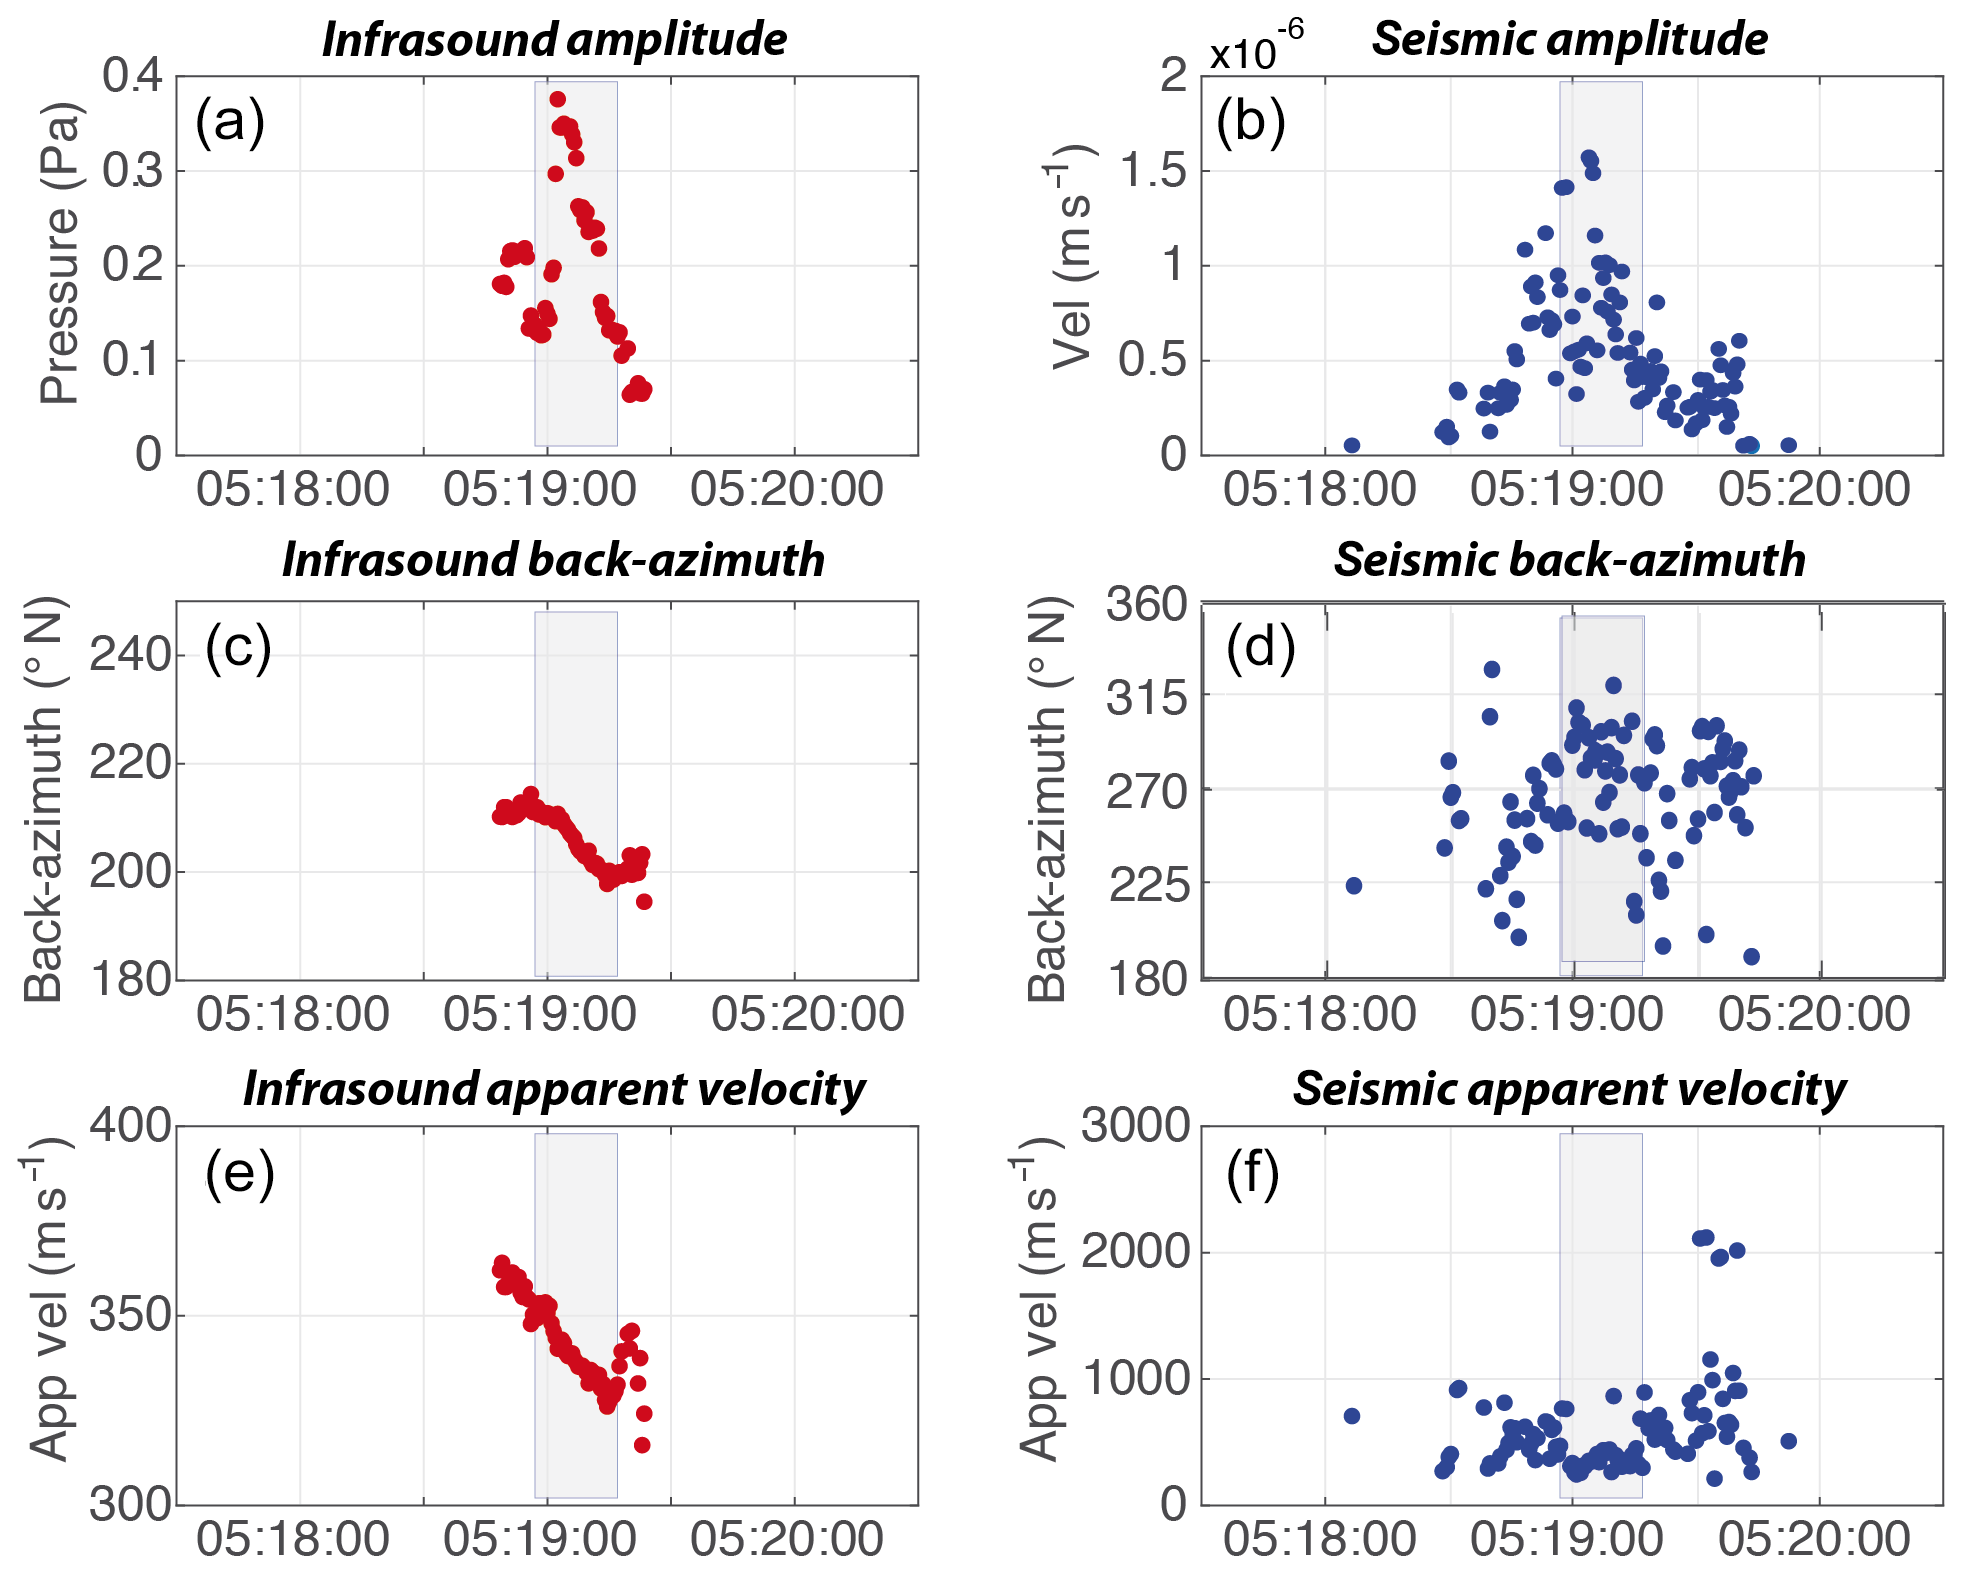
Figure 6Amplitude, back-azimuth and apparent velocity of infrasound (a, c, e,) and seismic (b, d, f,) detections for the avalanche of 5 February 2016. The shaded area highlights the time window of sound propagation velocity recorded for the seismic signal.
Unlike infrasound, which has a duration of ∼45 s and is marked by a clear variation of wave parameters (back-azimuth and apparent velocity), the seismic signal radiated by the event is much longer in duration (∼60 s), and changes in wave parameters are less clear. The first seismic detections were recorded around 05:18:40 UTC, ∼10 s before the first infrasound detection, with a back-azimuth angles between 220 and 250∘, corresponding reasonably well with the release area of the snow avalanches (Fig. 1). During the following 20 s we observe a general migration of the seismic back-azimuth up to ∼270–300∘ N at 05:19:00 UT, corresponding to the run-out area. Afterwards, the seismic back-azimuth remains rather stable until the end of the event at 05:19:45 UT.
The results of infrasound and seismic array processing presented in Fig. 6, allow us to describe the mutual infrasound and seismic energy radiation during the avalanche. Just considering the event duration, it is clear from Fig. 6 that the avalanche initiation phase is radiating seismic energy in the ground, while no or minor infrasound is radiated into the atmosphere. This is likely related to the first stage of the event, while the powder front is not developed yet. Only 20–25 s after the avalanche onset, once the flow accelerates (Marchetti et al., 2020), infrasound starts to be radiated by a source that is moving downhill along the avalanche path, as tracked by the infrasound wave parameters (back-azimuth and apparent velocity, Fig. 6c and e).
In order to calculate the portion of the avalanche path where seismic and infrasound energies are radiated, we performed a blind search to minimize the difference between wave parameters (Bazs, Bazi, ca and BV) calculated for the seismic and infrasound detections (Fig. 6) and the theoretical values calculated for the DEM (Fig. 5). Figure 7 shows all the possible source points along the DEM based on the seismic back-azimuth (Fig. 7a), the infrasound back-azimuth alone (Fig. 7b), the infrasound apparent velocity intersected with back-azimuth (Fig. 7c) and their product intersected both with back-azimuth and apparent velocity (Fig. 7d). The dark red areas are highlighting all the points of the DEM that satisfy a minimum difference threshold. This is fixed into 1∘ for seismic (Bazs) and infrasound (Bazi) back-azimuths, 1 m s−1 for apparent velocity (ca) and 500 for their product (BV). Given the absolute value of Bazi (1–360∘) and ca (330–400 m s−1), such an experimental value accounts for a limited (<1∘ or 1 m s−1) variation of one single parameter at once. Figure 7 shows that, considering only one parameter at once, only limited information on the source radiation area can be deduced, without additional constraints regarding the avalanche path. Such an approach was applied successfully in previous studies that evaluated the avalanche velocity from infrasound detections (Havens et al., 2014; Marchetti et al., 2015) but limits the analysis to a single avalanche path.
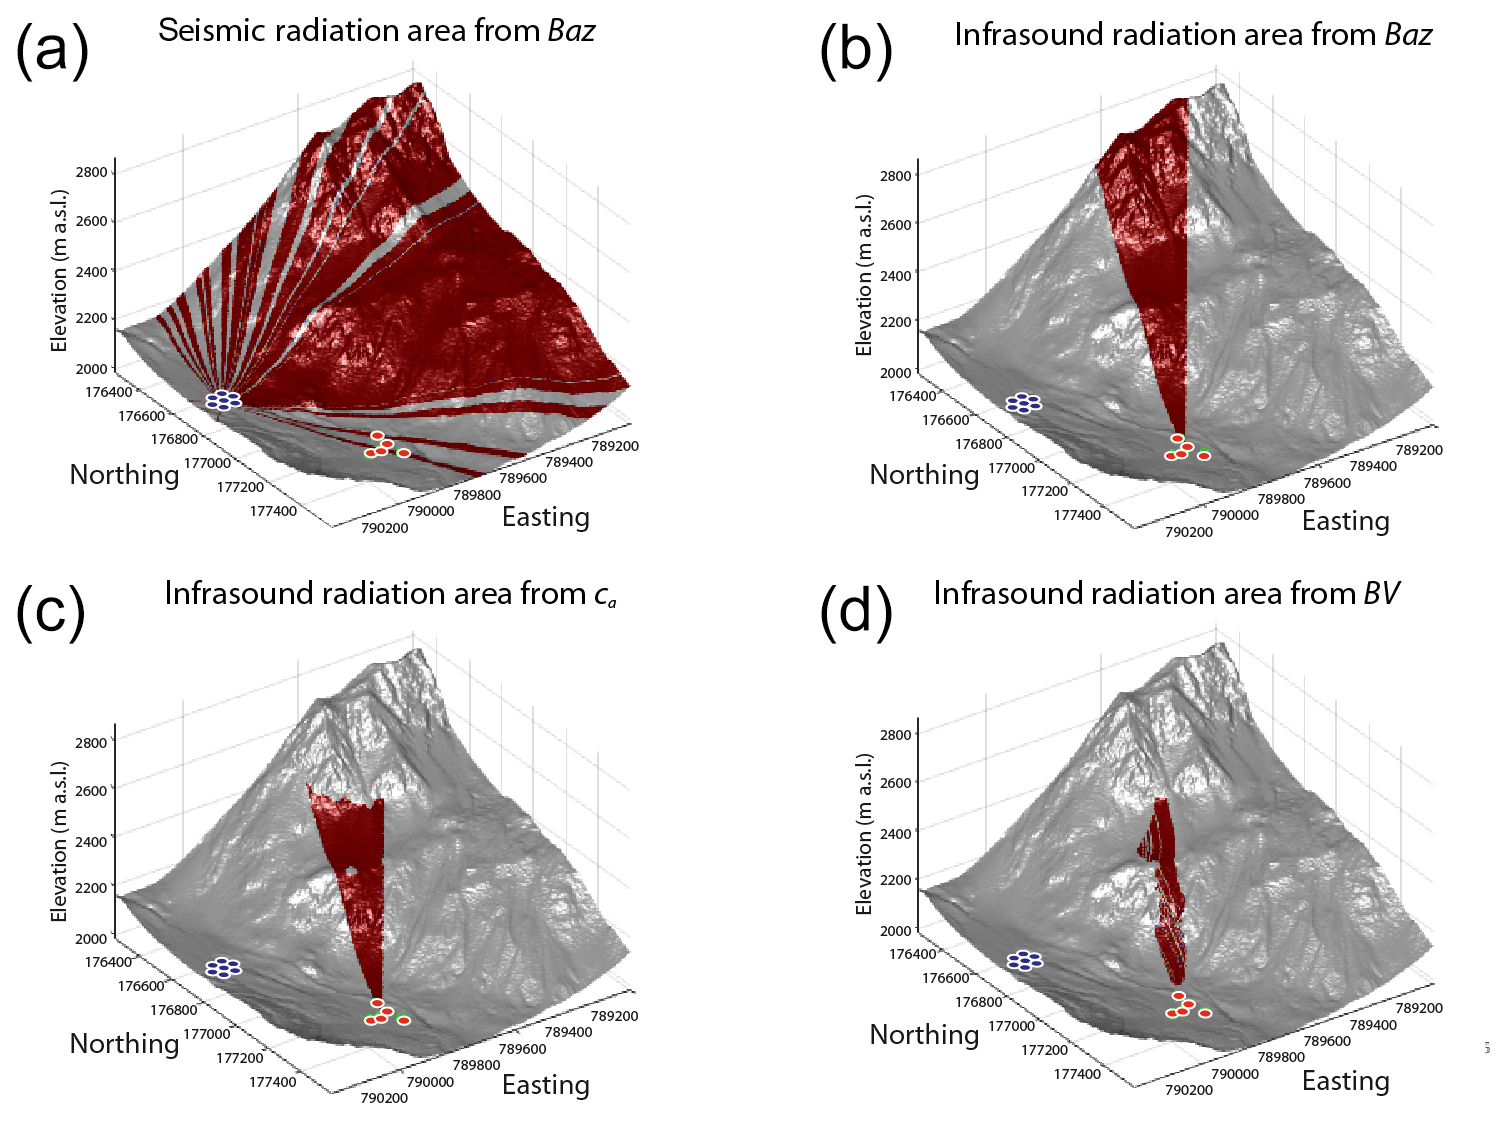
Figure 7Possible radiation areas (dark red) of seismic and infrasound energy, obtained from seismic back-azimuth (Bazs, a), infrasound back-azimuth (Bazi, b), infrasound apparent velocity (ca, c) and the combination of infrasound back-azimuth and apparent velocity (BV, d). The position of the seismic array is shown by blue circles, while the position of the infrasound array is shown by red circles.
Considering the seismic back-azimuth (Bazs, Fig. 7a) only, the detections do not provide any constraint on the source position, as they are consistent with many different directions around the array spanning between 200 and 325∘ N. However, if we assume that the seismic source is confined within the avalanche path (Fig. 2a), it appears that the seismic energy is radiated from the detachment point to the depositional area. Moreover, the scattered values of the back-azimuth of the recorded seismic signals suggest that multiple sources of seismic energy are active at the same time in different sectors of the avalanche path.
The relative position of the avalanche path and the infrasound array influences the efficiency of the infrasound back-azimuth to identify the source position along the path. Considering the infrasound back-azimuth alone (Bazi, Fig. 7b), the back-projection of infrasound detections to the topography does no allow us to constrain the position of the source along the path. The infrasound apparent velocity constrains the source elevation (ca, Fig. 7c). The maximum value of the apparent velocity of 364 m s−1 (Fig. 6) limits the energy radiation to the lowest part of the avalanche path, which is clearly suggesting that no, or minor, infrasound is produced high up in the path during the initiation phase. This conclusion is confirmed by the blind search of the infrasound energy radiation area, based on the combination of back-azimuth and apparent velocity (BV, Fig. 7d). Here, the minimization of residuals between theoretical and measured values highlights a limited area on the entire DEM, from the base of the starting zone, where the avalanche accelerates and follows the channel down to the valley.
In order to investigate the recorded seismic and infrasound signals in terms of avalanche dynamics, we performed RAMMS modelling of the flow evolution (Fig. 8). Based on field observations and on typical snow profile characteristics at the time of the event, we assumed a release volume of 9.525 m3, with release depth of 80 cm. The modelled flow depth evolution (Marchetti et al., 2020) predicts a total flow duration of ∼90 s, with ∼60 s required for the avalanche to initiate, accelerate and reach the valley bottom, followed by ∼30 s of snow deposition.

Figure 8Figure showing the flow extent modelled by RAMMS and highlighting maximum flow depth (a) and flow velocity (b). Profiles of the modelled flow depth (c) and flow velocity (d) along the path imposed on the avalanche path profile (colour coded according to its slope) as a function of the travelled horizontal distance are shown.
Since the path geometry is characterized by a sharp terrain break at an elevation of approximately 2300 m (Fig. 8c), the modelled avalanche accelerated along the release area where slopes exceed 35∘ then it rapidly decelerated and lost mass at the terrain break (Fig. 8d). The modelled avalanche then accelerated again after entering a steep (slope > 30∘) narrow channel (<50 m) within the lowest part of the path. Finally, the flow slowed down when it reached the valley bottom at an elevation of ∼2030 m (Figs. 2 and 8), where the snow mass was spread out horizontally on the run-out area. RAMMS predicted a maximum flow depth of almost 3.5 m, which was reached after a travel distance of ∼200 m along the path. The maximum front velocity, of ∼35 m s−1, was reached at the end of the first, and highest, part of the path, before the deceleration at the terrain break (Fig. 8). Lower values of front velocity and flow depth result from the model below the terrain break. The modelled snow avalanche qualitatively compared well to the information we obtained from the images from the automatic cameras (Fig. 2b).
The flow evolution modelled by RAMMS (Fig. 8) appears to be consisted with the two distinct phases observed for both the seismic and infrasound signals. These two phases appear to be controlled by the path geometry forcing the avalanche to slow down and lose mass at the terrain break at an elevation of 2300 m.
The clear variation of the back-azimuth and apparent velocity of the recorded infrasound signals provides a strong constraint on the source mechanism of infrasound energy. The comparison of infrasound radiation area (Fig. 7d) with RAMMS modelling (Fig. 8) clearly shows that infrasound is radiated when the flow is accelerated within the channel. This is in agreement with the hypothesis that infrasound is produced by the powder cloud and with the dynamical evolution of a PSA in terms of an eruption current (Carrol et al., 2013). They showed that the powder cloud formation is strongly enhanced by the narrowing of the avalanche path, while it is reduced by the path spreading in the initiation and deposition area.
As discussed in detail by Marchetti et al. (2015), in the case of multiple sources, the array analysis identifies the most energetic source. Therefore, being able to detect and track one predominant source (Fig. 6c and e), moving downhill with time, we suggest that snow avalanches are characterized by a dominant source of infrasound energy, allowing the source mechanism of infrasound to be treated as a point source moving downhill. This is very different from other density currents, like debris flows, where recorded infrasound is lacking a clear correlation and thus limiting the efficiency of array processing procedures (Marchetti et al., 2019). Differently from infrasound, the scattered back-azimuth of seismic detections (Fig. 6d) suggests that seismic signals are most likely produced by multiple sources or by an elongated source acting along the path at the same time (Fig. 6d and f).
Previous studies (Surinach et al., 2001; Vilajosana et al., 2007b) showed that seismic signals produced by snow avalanches mostly consist of surface waves. They assumed that the seismic energy was radiated mostly by the basal friction and snow ploughing at the avalanche front (Vilajosana et al., 2007b, and references therein). The seismic energy was calculated accounting for geometrical spreading and attenuation of surface waves along the front-to-receiver distance. Any possible contribution from multiple sources along the path or by an elongated source were not considered. This could lead to an underestimation of the total seismic energy of the event.
An additional consideration is that the recorded seismic amplitude may be increased by the sound transmitted locally into the ground, as suggested already by Kogelnig et al. (2011). In this study, this process is confirmed by the combined analysis of seismic and infrasound detections (Fig. 6). Considering the apparent velocity of seismic waves, the array processing highlights high values (>650 m s−1) at the beginning and at the end of the event. These values are in agreement with phase velocities (500–950 m s−1) measured by Vilajosana et al. (2007a) for snow avalanches in Ryggfonn in Norway, as well as values used by Lacroix et al. (2012) for beam forming in the French Alps. The central part of the signal, between 05:19:00 and 05:19:15 UT, is characterized by a lower propagation velocity (∼330 m s−1), suggesting that the seismic array is likely recording infrasound waves. This corresponds to the time when the infrasound amplitude was maximum (Fig. 6a). We suggest that the central part of the signal is strongly affected by the infrasound radiated by the event, which converts to seismic waves at the earth free surface and is efficiently recorded by seismometers. This is an agreement with results obtained by Heck et al. (2017) for an avalanche that did occur from the same path in 2017 and applying the multiple signal classification (MUSIC) analysis to seismic array data.
The process of infrasound to seismic energy transition was described by Ichihara et al. (2012). An infrasonic wave hitting the ground (p(t,x)) produces a vertical ground velocity (w(t,x)) that is directly proportional to the amplitude of the incident wave ()). The conversion factor (H) is defined as
where λ and μ are Lame's constants of the ground and c is the velocity of sound. It is worth noting how Eq. (1) is derived for longitudinal waves (pressure wave in the atmosphere and vertical ground velocity for seismic wave), and it does not account for any frequency dependance. Considering typical values of the Lame's constant for soil (∼108 Pa) and a sound velocity (c) of 340 m s−1, the conversion factor (H) results in m s−1 Pa−1. Therefore, an infrasonic wave of 1 Pa will produce a detectable seismic signal in the ground. In the specific case of the 5 February avalanche (Fig. 4), the recorded pressure of 0.4 Pa will produce a seismic signal with an amplitude of m s−1, which superimposes on the body and surface seismic waves produced at the source and corresponds to ∼20 % of the recorded seismic amplitude in our frequency range (>4.5 Hz) of analysis. This is in agreement with sound velocities recorded in the seismic data during the phase of maximum infrasound radiation (Fig. 6).
This study, combining for the first time seismic and infrasound array data, highlights the complexity of the seismic radiation by snow avalanches and the contribution of the air-to-ground energy transmission. These have an influence on the recorded seismic signal and, if not accounted for, might limit the applicability of seismic signals for energy estimations. The absolute seismic amplitude, and corresponding energy, can change according to snow characteristics (dry/wet) (Vilajosana et al., 2007b) and efficiency of air-to-ground energy transmission (Ichihara et al., 2012). This approach is even more critical considering that seismic energy is radiated all along the avalanche path (Fig. 7a). Moreover, it requires a-priori characterization of the quality factor of surface waves at the site (Vilajosana et al., 2007b), thus preventing a general application of the proposed procedure at various sites.
Similarly, infrasound amplitude is expected to change dramatically as a function of avalanche type (dry/wet) and path geometry, and our results suggest that estimating avalanche size from infrasound signals could be difficult. Signal duration is, for example, reflecting only the part of the path where the avalanche is accelerated or where the powder cloud develops (Fig. 7d). Considering the radiation of sound by a moving body assumed to be a solid sphere, Naugolnykh and Bedard (1990) suggested that the frequency of recorded infrasound must scale inversely with the body size as follows:
where c is the velocity of sound in the atmosphere and D is the diameter of the sphere.
For the specific case of the avalanche recorded on 5 February 2016, Eq. (2) predicts a moving sphere-like body with diameter D of ∼30 m. This value is obtained by assuming a sound propagation velocity of 330 m s−1 and considering a peak frequency of 3.3 Hz (Fig. 4), and it is of the same order as the width of the avalanche channel (<50 m). Nevertheless, a snow avalanche is far from being a rigid sphere moving in the atmosphere. Already Naugolnykh and Bedard (1990) suggested that additional processes might contribute to the avalanche infrasound radiation, such as the turbulent pressure pulsation of the powder cloud and/or secondary source mechanisms. Kogelnig et al. (2011) successfully modelled the pressure amplitude radiated by a snow avalanche at the Vallée de la Sionne test site, considering a moving turbulent source, where pressure amplitude was dependent on flow dimension and velocity, inferred from independent observation of the event. Therefore, while the approach proposed here following Naugolnykh and Bedard (1990) seems to work fine as a first approximation, analyses will be required to further investigate the source mechanisms of infrasound possibly combining infrasound, seismic and high-resolution video observations.
Results presented here, and obtained from seismic and infrasound array analysis for a powder snow avalanches at a short distances (<1000 m), highlight two separate mechanisms of elastic energy radiation by a snow avalanche. The infrasound energy is radiated only when the powder part develops and is not produced during the initiation or deposition phase. The duration of the infrasound signal is thus not representative of the entire volume of snow that was transported by the avalanche. Because of the clear migration of infrasound detections in terms of back-azimuth and apparent velocity, we suggest that the source mechanism of the infrasound signal can be interpreted as a moving point source. The clear variation of back-azimuth and apparent velocity obtained from the array analysis suggests that infrasound can be used as an efficient monitoring method for avalanche detection purposes in the case when a powder cloud develops. Back-projection of the infrasound detections on the avalanche path suggested that the infrasound energy is radiated only when the flow is confined within a narrow path. According to the analytical formulation of Carrol et al. (2013), such a condition enhances the formation of the powder front.
In contrast, the seismic signal is produced during the entire avalanche evolution, including the initiation and deposition area. Therefore, the signal duration is longer and more representative of the entire flow evolution and run-out distance. Unlike infrasound, the seismic back-azimuth and apparent velocity values were more scattered, and the detection and location of avalanche events is less straightforward. Furthermore, the scattering of wave parameters suggests multiple sources that act simultaneously along the path.
In agreement with Heck et al. (2017), the combined seismic and infrasound array analysis showed also that during the phase of maximum infrasound radiation, seismic energy is strongly affected by the infrasonic signal. In the specific case presented here, where the different frequency responses of the infrasound (>0.01 Hz) and seismic waves (>4.5 Hz) limits the analysis to the high-frequency component (>4.5 Hz) of the elastic energy radiation, infrasound contributes to ∼20 % of the recorded seismic amplitude. This needs to be accounted for when the seismic amplitude is used to estimate the avalanche energy. Similarly, the amplitude of recorded infrasound is controlled by the avalanche type (wet/dry) and the flow evolution (i.e. the formation of the powder cloud). The use of the frequency of the recorded infrasonic signal to estimate the event size is, on the contrary, more promising for the avalanche event investigated here. Following Naugolnykh and Bedard (1990), the recorded peak infrasound frequency of 3.3 Hz is consistent with a sphere-like body with a diameter of 30 m, in agreement with the geometry and extension of the avalanche path. Such an approach could be used as a first approximation for the volume involved in the case when independent observations are available, but it cannot explain, on its own, the recorded infrasound signal, where a moving turbulent source has been considered to model recorded infrasound at instrumented sites (Kogelnig et al., 2011).
Although many open questions remain concerning the mechanisms of infrasound and seismic energy radiation by snow avalanches, the combined seismic and infrasound array analyses presented in this study help in clarifying some key aspects of the recorded seismic and infrasound signals, such as source origin, possible source mechanisms and mutual relation of seismic and infrasonic signals. Further studies will be required, however, to investigate in detail the source mechanisms of elastic energy radiation; secondary source processes, like turbulence of the powder front; and possible use of the seismic and the infrasound signal to evaluate the magnitude of the event.
Infrasound and seismic detections resulting from array processing and used here to achieve most of the findings and create most of the figures are freely available in the Open Science Framework repository https://doi.org/10.17605/OSF.IO/P28GC (Marchetti et al., 2020).
The RAMMS::Avalanche simulation, depicting the flow depth (m) along the avalanche path is given. Red colours indicate flow depths larger than 2 m. The video is freely available in the Open Science Framework repository (https://doi.org/10.17605/OSF.IO/P28GC).
All of the authors contributed actively to the article. In detail, EM and AH initiated this study and installed and maintained the instrumentation during the winter season. They worked on the infrasound and seismic data array analysis, developed the model of infrasound and seismic energy partitioning, and wrote the text. MC performed the RAMMS modelling of the avalanche. MCS and GB contributed to the text, figures and discussion. MCS worked primarily on seismic data, while GB worked mostly on infrasound data and developed the relationship between infrasound and volume.
The authors declare that they have no conflict of interest.
We thank Emma Surinach and Bradley Lipovsky for their careful review that helped us to greatly improve the article, and we thank the associate editor Claire Masteller for helpful comments. We would like to thank all our colleagues who helped us with installing and maintaining the instrumentation in the field, in particular Stephanie Mayer, Tobias Burgherr, Matthias Heck, Riccardo Genco and Lorenzo Innocenti.
This research has been supported by the Swiss National Science Foundation (grant no. 200021149329).
This paper was edited by Claire Masteller and reviewed by Emma Surinach and Bradley Lipovsky.
Adam, V., Chritin, V., Rossi, M., and Van Lancker, E.: Infrasonic monitoring of snow-avalanche activity: what do we know and where do we go from here?, Ann. Glaciol., 26, 324–328, 1998. a
Bedard, A.: Detection of avalanches using atmospheric infrasound, in: Proceedings of the Western Snow Conference, edited by: Shafer, B., Western Snow Conference, April 1989, Colorado State University, Fort Collins, CO, USA, 52–58, 1989. a, b
Biescas, B., Dufour, F., Furdada, G., Khazaradze, G., and Suriñach, E.: Frequency content evolution of snow avalanche seismic signals, Surv. Geophys., 24, 447–464, 2003. a, b
Carrol, C. S., Louge, M. Y., and Turnbull, B.: Frontal dynamics of powder snow avalanches, J. Geophys. Res.-Earth, 118, 913–924, https://doi.org/10.1002/jgrf20068, 2013. a, b, c, d, e
Christen, M., Kowalski, J., and Bartelt, P.: RAMMS: Numerical simulation of dense snow avalanches in three-dimensional terrain, Cold Reg. Sci. Technol., 63, 1–14, https://doi.org/10.1016/j.coldregions.2010.04.005, 2010. a, b
Chritin, V., Rossi, M., and Bolognesi, R.: Acoustic detection System for Operational Avalanche Forecasting, in: Proceeding of International Snow Science Workshop, 6–11 October 1996, Banff, Alberta, 129–133, 1996. a
Comey, R. H. and Mendenhall, T.: Recent Studies Using Infrasound Sensors to Remotely Monitor Avalanche Activity, in: Proceeding of International Snow Science Workshop, 19–24 September 2004, Jackson, WY, 640–646, 2004. a
Hammer, C., Fah, D., and Ohrnberger, M.: Automatic detection of wet-snow avalanche seismic signals, Nat. Hazards, 86, 601–618, https://doi.org/10.1007/s11069-016-2707-0, 2017. a
Havens, S., Marshall, H. P., Johnson, J. B., and Nicholson, B.: Calculating the velocity of a fast-moving snow avalanche using an infrasound array, Geophys. Res. Lett., 41, 6191–6198, https://doi.org/10.1002/2014GL061254, 2014. a, b, c
Heck, H., Hobiger, M., van Herwijnen, A., Schweizer, J., and Fah, D.: Localization of seismic events produced by avalanches using multiple signal classification, Geophys. J. Int., 216, 201–217, https://doi.org/10.1093/gji/ggy394, 2017. a, b, c
Ichihara, M., Takeo, M., Yokoo, A., Oikawa, J., and Ohminato, T.: Monitoring volcanic activity using correlation patterns between infrasound and ground motion, Geophys. Res. Lett., 39, L04304, https://doi.org/10.1029/2011GL050542, 2012. a, b, c
Issler, D.: Experimental information on the dynamics of dry-snow avalanches, in: Dynamic Response of Granular and Pouros Materials under Large and Catastrophic Deformations, Lecture Notesin Applied and Computational Mechaniscs, vol. 11, edited by: Hutter, K. and Kirchner, N., Springer, Berlin, Germany, 109–160, 2003. a
Kogelnig, A., Surinach, E., Vilajosana, I., Hubl, J., Sovilla, B., Hiller, M., and Dufour, F.: On the complementariness of infrasound and seismic sensors for monitoring snow avalanches, Nat. Hazards Earth Syst. Sci., 11, 2355–2370, https://doi.org/10.5194/nhess-11-2355-2011, 2011. a, b, c, d, e
Kohler, A., McElwaine, J. N., and Sovilla, B.: GEORADAR data and teh flow regimes of snow avalanches, J. Geophys. Res.-Earth, 123, 1272–1294, https://doi.org/10.1002/2017JF004375, 2018. a
Lacroix, P., Grasso, J.-R., Roulle, J., Giraud, G., Goetz, D., Morin, S., and Helmstetter, A.: Monitoring of snow avalanches using a seismic array: Location, speed estimation, and relationships to meteorological variables, J. Geophys. Res., 117, F01034, https://doi.org/10.1029/2011JF002106, 2012. a, b
Louge, M. Y., Turnbull, B., and Carrol, C. S.: Volume growth of a powder snow avalanches, Ann. Galciol., 53, 57–60, https://doi.org/10.3189/2012AoG61A030, 2012. a
Marchetti, E., Ripepe, M., Ulivieri, G., and Kogelnig, A.: Infrasound array criteria for automatic detection and front velocity estimation of snow avalanches: towards a real-time early-warning system, Nat. Hazards Earth Syst. Sci., 15, 2545–2555, https://doi.org/10.5194/nhess-15-2545-2015, 2015. a, b, c, d, e, f, g, h
Marchetti, E., Walter, F., Barfucci, G., Genco, R., Wenner, M., Ripepe, M., McArdell, B., and Price, C.: Infrasound array analysis of debris flow activity and implication for early warning, J. Geophys. Res.-Earth, 124, 567–587, https://doi.org/10.1029/2018JF004785, 2019. a
Marchetti, E., van Herwijnen, A., Christian, M., Silengo, M. C., and Barfucci, G.: Seismo-acoustic energy partitioning of a powder snow avalanche: data, Open Science Framework Repository, https://doi.org/10.17605/OSF.IO/P28GC, 2020. a, b, c, d
Mayer, S., van Herwijnen, A., Ulivieri, G., and Schweizer, J.: Evaluating the performance of operational infrasound avalanche detection systems, in: Geop. Res. Abstracts, EGU General Assemply, 8–13 April 2018, Vienna, Austria, 2018. a, b
Naugolnykh, K. and Bedard, A.: A model of the avalanche infrasonic radiation, in: IEEE International Geoscience and Remote Sensing Symposium, 20–24 May 1990, College Park, Maryland, USA, https://doi.org/10.1109/IGARSS.2002.1025713, 1990. a, b, c, d, e
Sabot, F., Naaim, M., Granada, F., Surinach, E., Planet-Ladret, P., and Furdada, G.: Study of the avalanche dynamics by means of seismic methods, image processing techniques and numerical models, Ann. Glaciol., 26, 319–323, 1998. a, b
Schaerer, P. and Salway, A.: Seismic and impact-pressure monitoring of flowing avalanches, J. Glaciol., 26, 179–187, 1980. a
Scott, E. D., Hayward, C. T., Kubichek, R. F., Hamann, J. C., Pierre, J. W., Corney, B., and Mendenhall, T.: Single and multiple sensor identification of avalanche-generated infrasound, Cold Reg. Sci. Technol., 47, 159–170, 2007. a
Steinkogler, W., Sovilla, B., and Lehning, M.: Influence of snow cover properties on avalanche dynamics, Cold Reg. Sci. Technol., 97, 121–131, https://doi.org/10.1016/j.coldregions.2013.10.002, 2014. a
Surinach, E., Furdada, G., Sabot, F., Biescas, B., and Vilaplana, J. M.: On the characterization of seismic signals generated by snow avalanches for monitoring purposes, Ann. Glaciol., 32, 268–274, 2001. a, b
Ulivieri, G., Marchetti, E., Ripepe, M., Chiambretti, I., De Rosa, G., and Segor, V.: Monitoring snow avalanches in Northwestern Italian Alps using an infrasound array, Cold Reg. Sci. Technol., 69, 177–183, https://doi.org/10.1016/j.coldregions.2011.09.006, 2011. a, b, c, d
van Herwijnen, A. and Schweizer, J.: Seismic sensor array for monitoring an avalanche start zone: Design, deployment and preliminary results, J. Glaciol., 57, 267–276, https://doi.org/10.3189/002214311796405933, 2011a. a
van Herwijnen, A. and Schweizer, J.: Monitoring avalanche activity using a seismic sensor, Cold Reg. Sci. Technol., 69, 165–176, https://doi.org/10.1016/j.coldregions.2011.06.008, 2011b. a
Vilajosana, I., Khazaradze, G., Surinach, E., Lied, E., and Kristensen, K.: Snow avalanche speed determination using seismic methods, Cold Reg. Sci. Technol., 49, 2–10, https://doi.org/10.1016/j.coldregions.2006.09.007, 2007a. a, b
Vilajosana, I., Surinach, E., Khazaradze, G., and Gauer, P.: Snow avalanche energy estimation from seismic signal analysis, Cold Reg. Sci. Technol., 50, 72–85, 2007b. a, b, c, d, e